Kubeflow Pipelines (kfp)
Overview
Kubeflow Pipelines (kfp) is a platform for building and deploying portable, scalable machine learning (ML) workflows based on Docker containers.
This integration lets users apply decorators to kfp python functional components to automatically log parameters and artifacts to W&B.
This feature was enabled in wandb==0.12.11 and requires kfp<2.0.0
Quickstart
Install W&B and login
- Notebook
- Command Line
!pip install kfp wandb

import wandb
wandb.login()
pip install kfp wandb
wandb login
Decorate your components
Add the @wandb_log decorator and create your components as usual. This will automatically log the input/outputs parameters and artifacts to W&B each time you run your pipeline.
from kfp import components
from wandb.integration.kfp import wandb_log

@wandb_log
def add(a: float, b: float) -> float:
    return a + b

add = components.create_component_from_func(add)
Passing env vars to containers
You may need to explicitly passWANDB env varsto your containers. For two-way linking, you should also set the env var WANDB_KUBEFLOW_URL to the base URL of your Kubeflow Pipelines instance (e.g. https://kubeflow.mysite.com)
import os
from kubernetes.client.models import V1EnvVar

def add_wandb_env_variables(op):
    env = {
        "WANDB_API_KEY": os.getenv("WANDB_API_KEY"),
        "WANDB_BASE_URL": os.getenv("WANDB_BASE_URL"),
    }

    for name, value in env.items():
        op = op.add_env_variable(V1EnvVar(name, value))
    return op

@dsl.pipeline(name="example-pipeline")
def example_pipeline(...):
    conf = dsl.get_pipeline_conf()
    conf.add_op_transformer(add_wandb_env_variables)
    ...
Where is my data? Can I access it programmatically?
Via the Kubeflow Pipelines UI
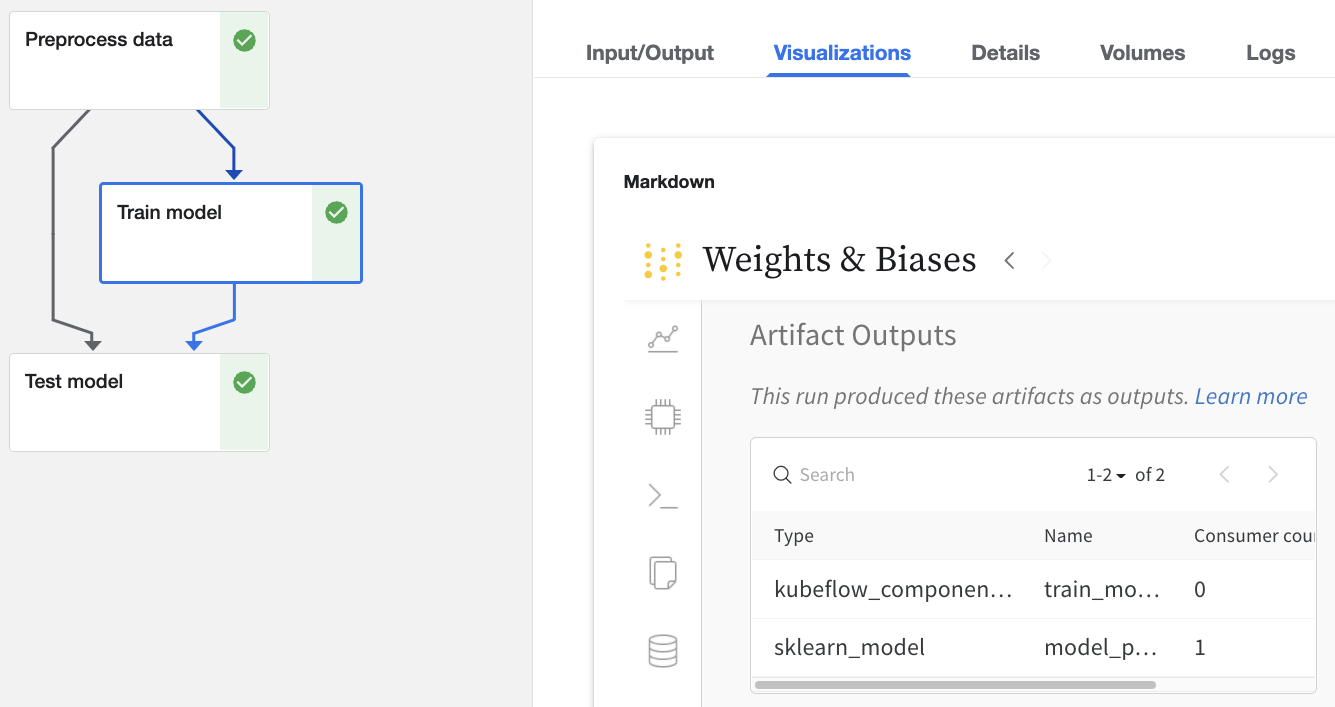
Click on any Run in the Kubeflow Pipelines UI that has been logged with W&B.
- Inputs and outputs will be tracked in the
Input/OutputandML Metadatatabs - You can also view the W&B web app from the
Visualizationstab.
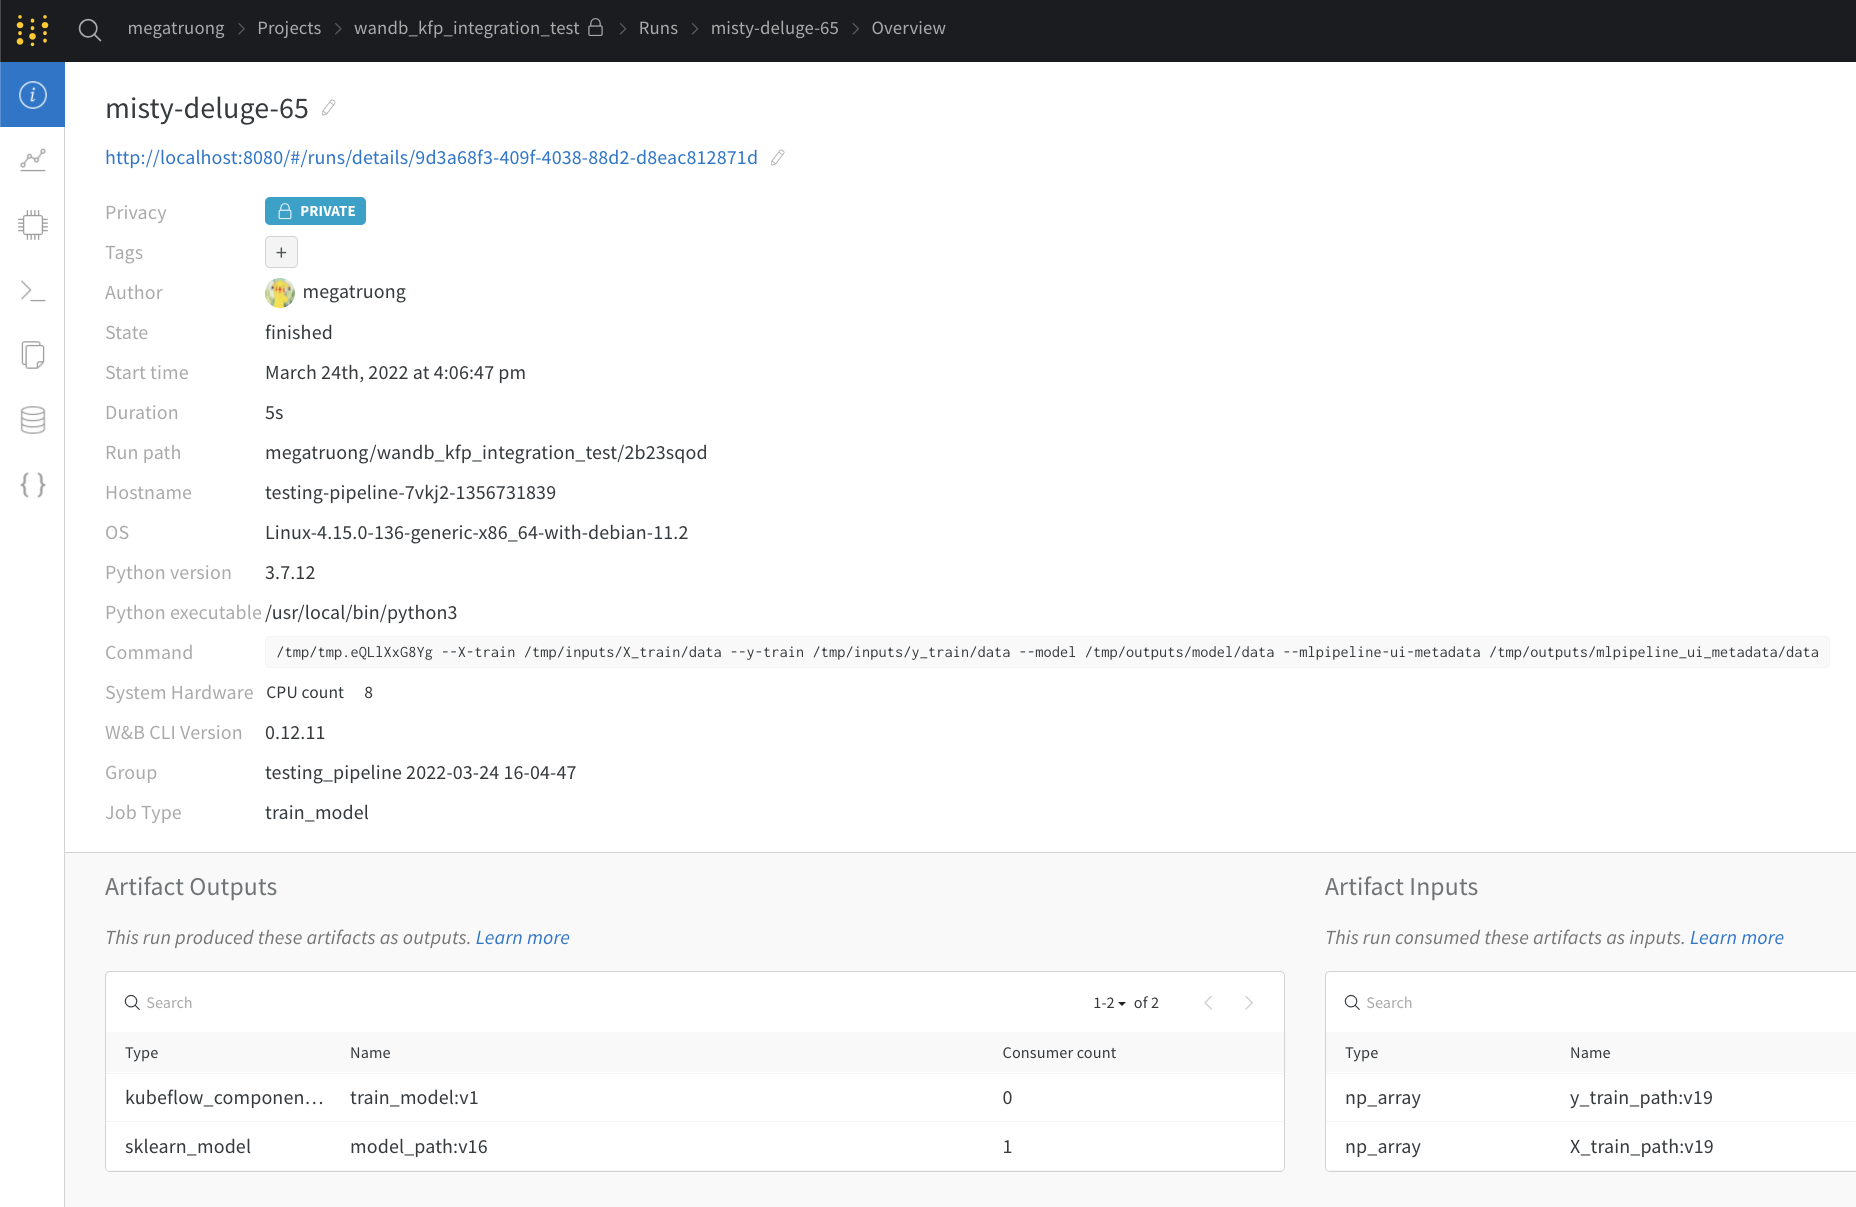
Via the web app UI
The web app UI has the same content as the Visualizations tab in Kubeflow Pipelines, but with more space! Learn more about the web app UI here.
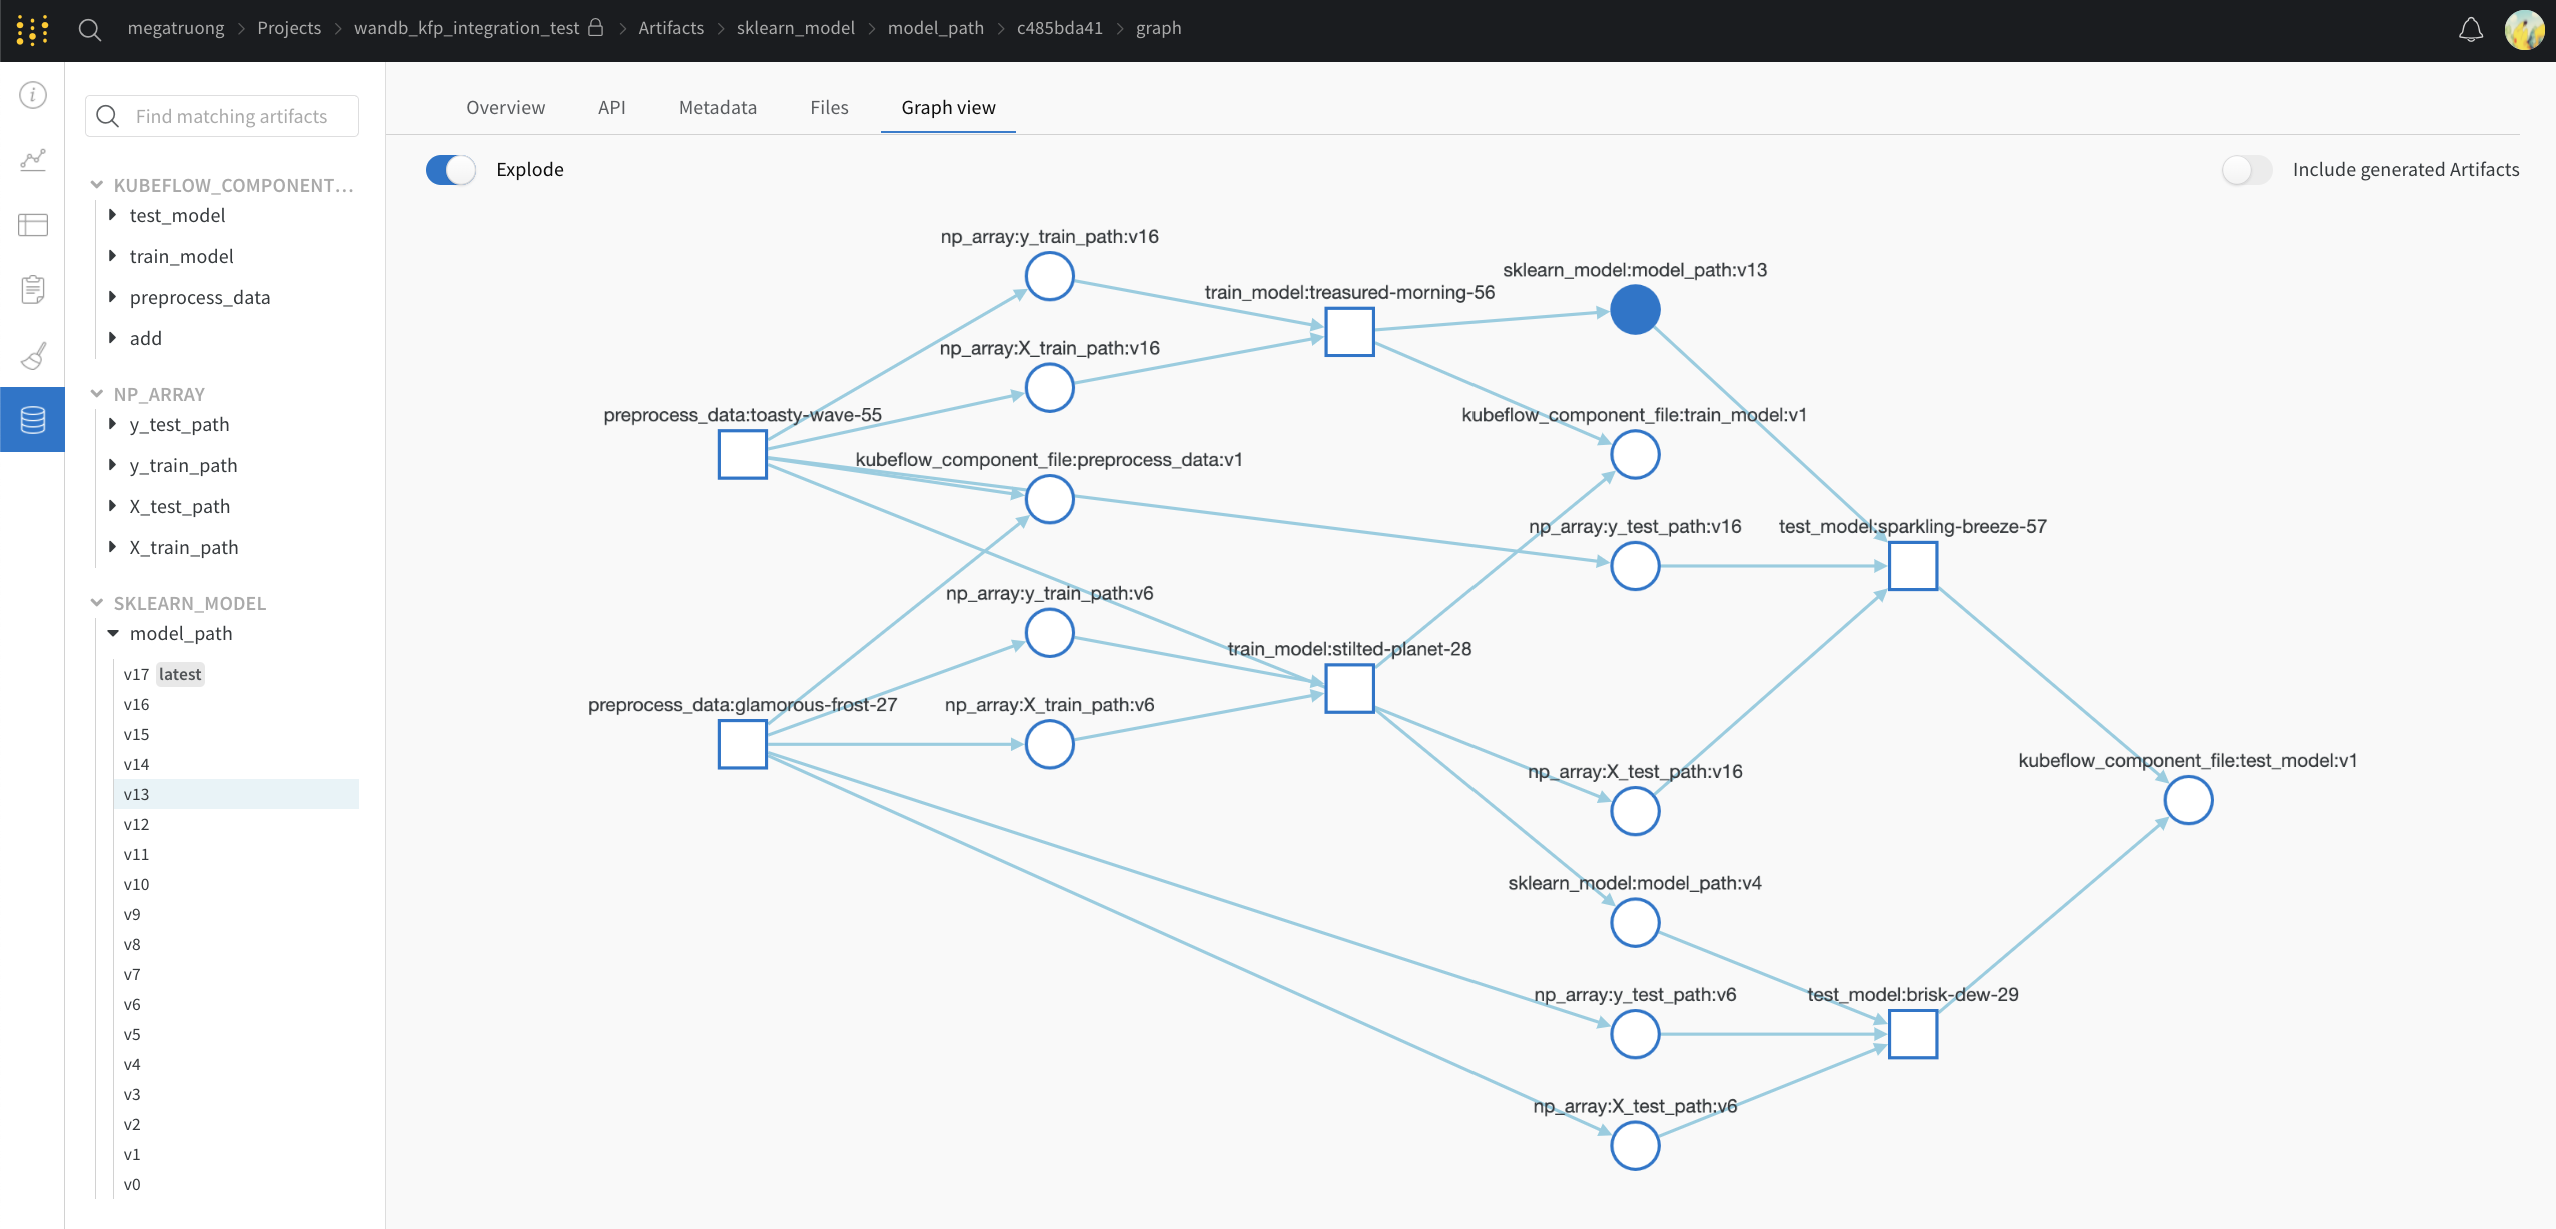
Via the Public API (for programmatic access)
- For programmatic access, see our Public API.
Concept mapping from Kubeflow Pipelines to W&B
Here's a mapping of Kubeflow Pipelines concepts to W&B
| Kubeflow Pipelines | W&B | Location in W&B |
|---|---|---|
| Input Scalar | [`config`](https://docs.wandb.ai/guides/track/config) | Overview tab |
| Output Scalar | [`summary`](https://docs.wandb.ai/guides/track/log) | Overview tab |
| Input Artifact | Input Artifact | Artifacts tab |
| Output Artifact | Output Artifact | Artifacts tab |
Fine-grain logging
If you want finer control of logging, you can sprinkle in wandb.log and wandb.log_artifact calls in the component.
With explicit wandb logging calls
In this example below, we are training a model. The @wandb_log decorator will automatically track the relevant inputs and outputs. If you want to log the training process, you can explicitly add that logging like so:
@wandb_log
def train_model(
    train_dataloader_path: components.InputPath("dataloader"),
    test_dataloader_path: components.InputPath("dataloader"),
    model_path: components.OutputPath("pytorch_model")
):
    ...
    for epoch in epochs:
        for batch_idx, (data, target) in enumerate(train_dataloader):
            ...
            if batch_idx % log_interval == 0:
                wandb.log({
                    "epoch": epoch,
                    "step": batch_idx * len(data),
                    "loss": loss.item()
                })
        ...
        wandb.log_artifact(model_artifact)
With implicit wandb integrations
If you're using a framework integration we support, you can also pass in the callback directly:
@wandb_log
def train_model(
    train_dataloader_path: components.InputPath("dataloader"),
    test_dataloader_path: components.InputPath("dataloader"),
    model_path: components.OutputPath("pytorch_model")
):
    from pytorch_lightning.loggers import WandbLogger
    from pytorch_lightning import Trainer

    trainer = Trainer(logger=WandbLogger())
    ...  # do training