> ## Documentation Index
> Fetch the complete documentation index at: https://docs.wandb.ai/llms.txt
> Use this file to discover all available pages before exploring further.
> 画像分類、オーディオ、テキスト分析、その他のユースケース向けの W&B Tables のサンプルプロジェクトを紹介します。
# Tables の例
以下のセクションでは、Tables の活用方法の一部を紹介します。
### データを表示する
モデルのトレーニングまたは評価中にメトリクスとリッチメディアをログし、その結果を、クラウドまたはご利用の[ホスティング インスタンス](/ja/platform/hosting)と同期される永続データベースで可視化できます。
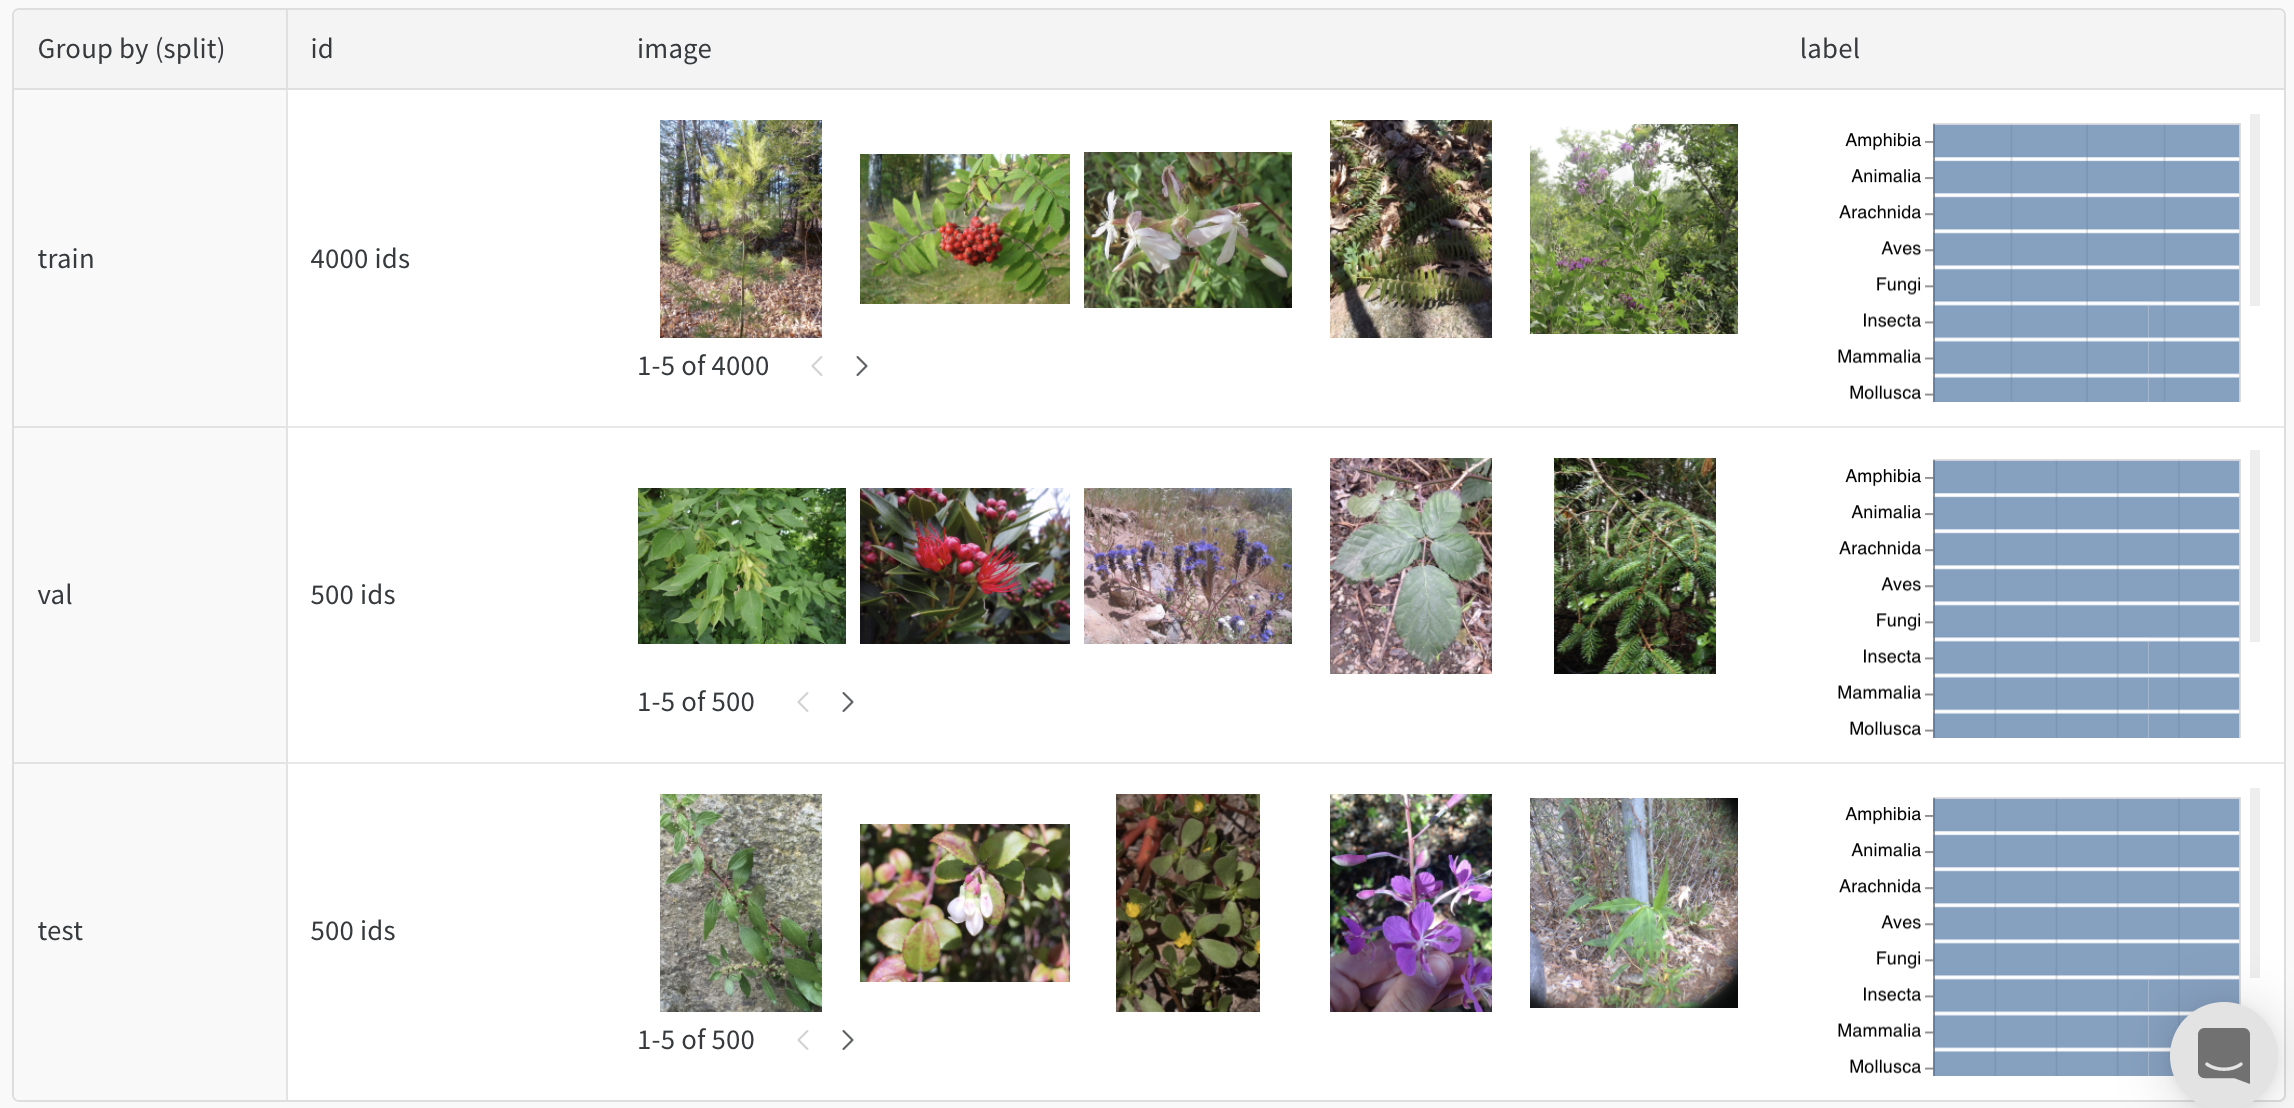 たとえば、[写真データセットをバランスよく分割した例](https://wandb.ai/stacey/mendeleev/artifacts/balanced_data/inat_80-10-10_5K/ab79f01e007113280018/files/data_split.table.json)を示すこの表をご覧ください。
### データをインタラクティブに探索
静的ファイルを確認したり、分析スクリプトを再実行したりしなくても、表を表示し、並べ替え、フィルター、グループ化、結合、クエリすることで、データとモデル性能を理解できます。
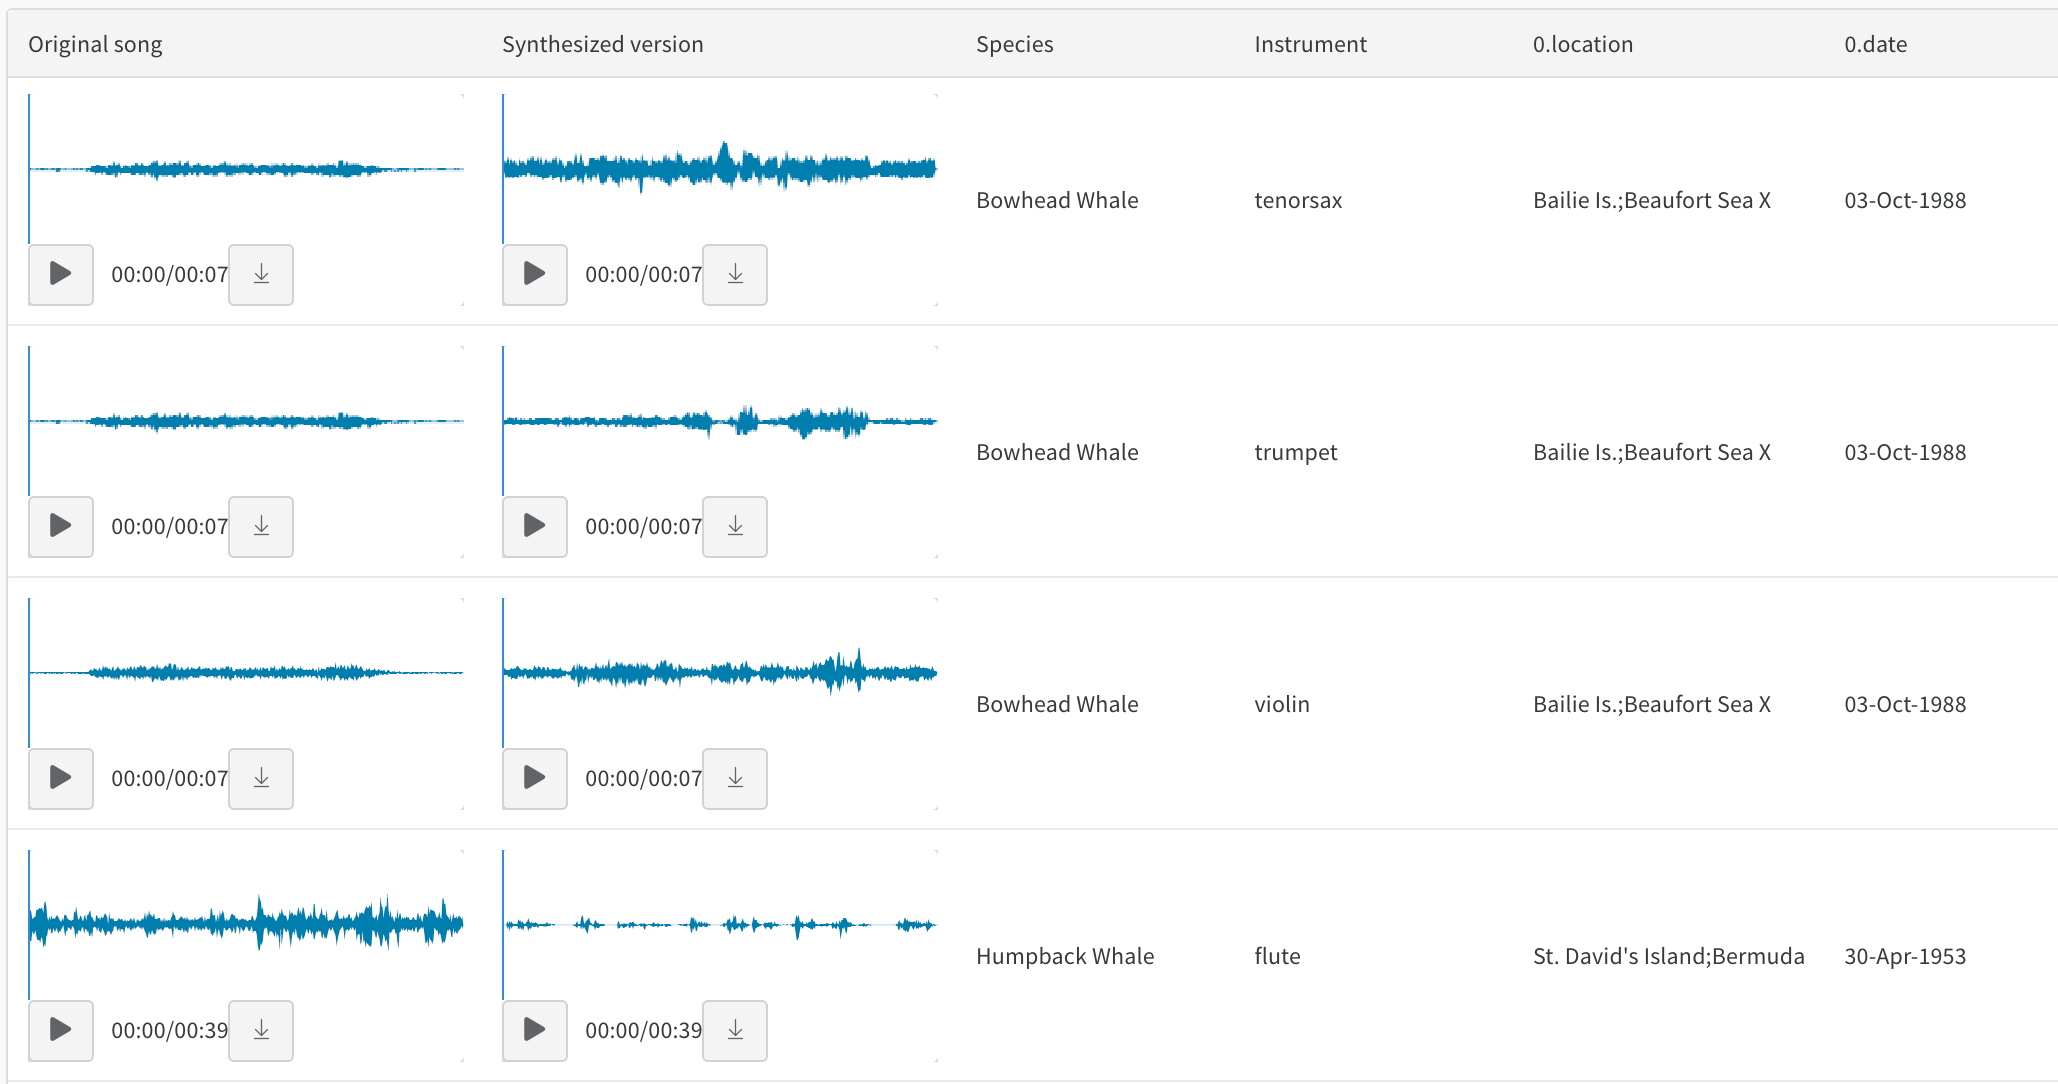 たとえば、[スタイル変換されたオーディオ](https://wandb.ai/stacey/cshanty/reports/Whale2Song-W-B-Tables-for-Audio--Vmlldzo4NDI3NzM)に関するこのレポートをご覧ください。
### モデルバージョンを比較する
異なるエポック、データセット、ハイパーパラメーターの設定、モデルアーキテクチャなどにまたがる結果をすばやく比較できます。
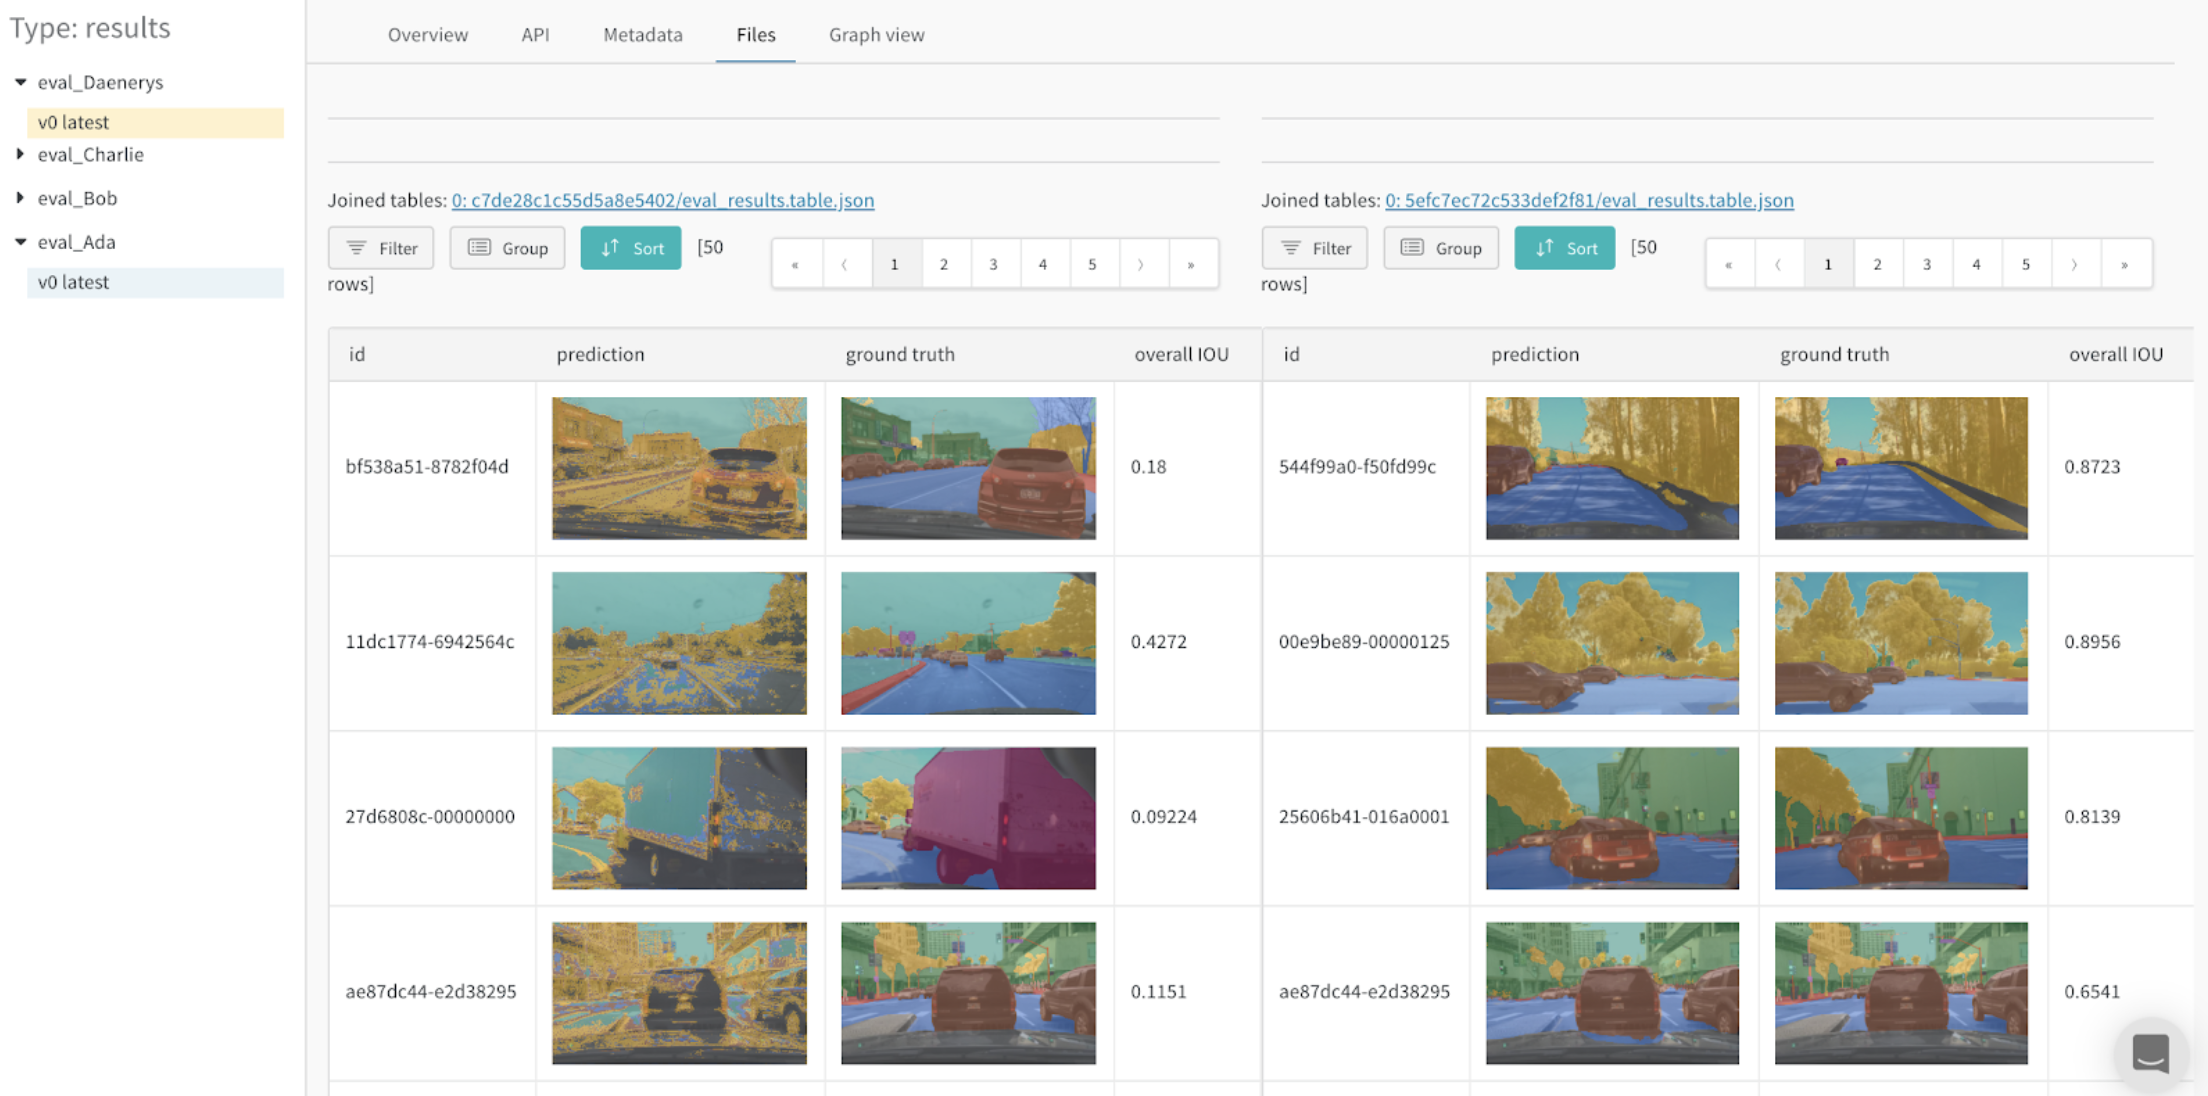
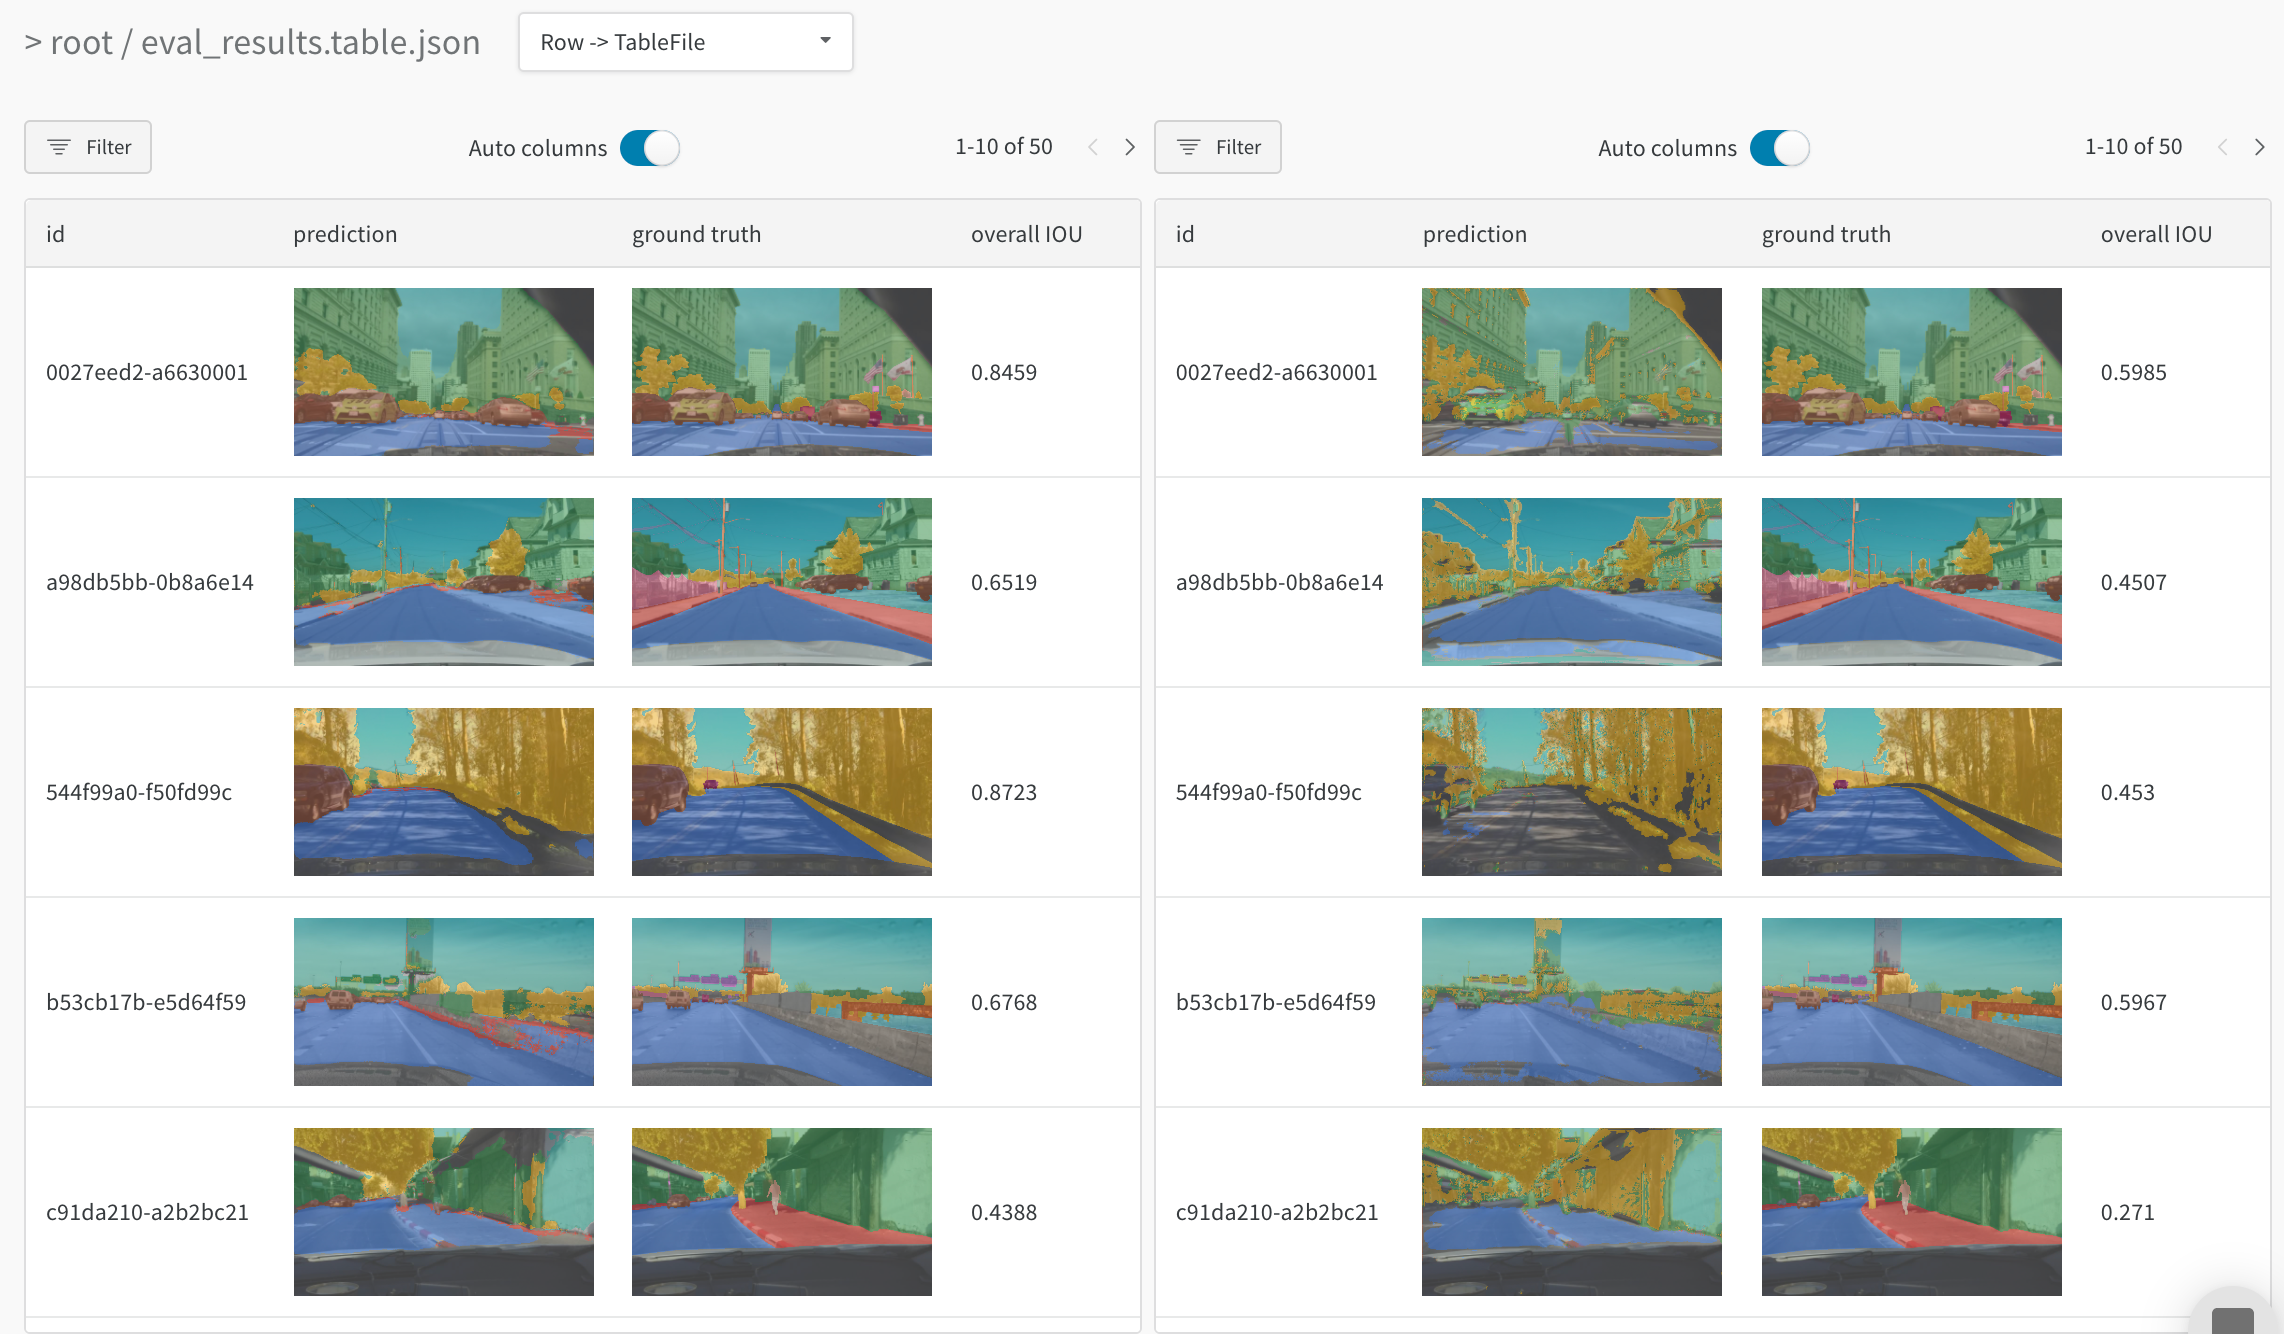 たとえば、[同じテスト画像で2つのモデルを比較した](https://wandb.ai/stacey/evalserver_answers_2/artifacts/results/eval_Daenerys/c2290abd3d7274f00ad8/files/eval_results.table.json#b6dae62d4f00d31eeebf\$eval_Bob)表を参照してください。
### 細部までトラッキングして全体像を把握する
ズームインすると、特定のstepにおける特定の予測を可視化できます。ズームアウトすると、集計統計を確認し、誤りのパターンを特定して、改善の余地を把握できます。このツールは、単一のモデル トレーニング内のstepを比較する場合にも、異なるモデルバージョン間の結果を比較する場合にも使用できます。
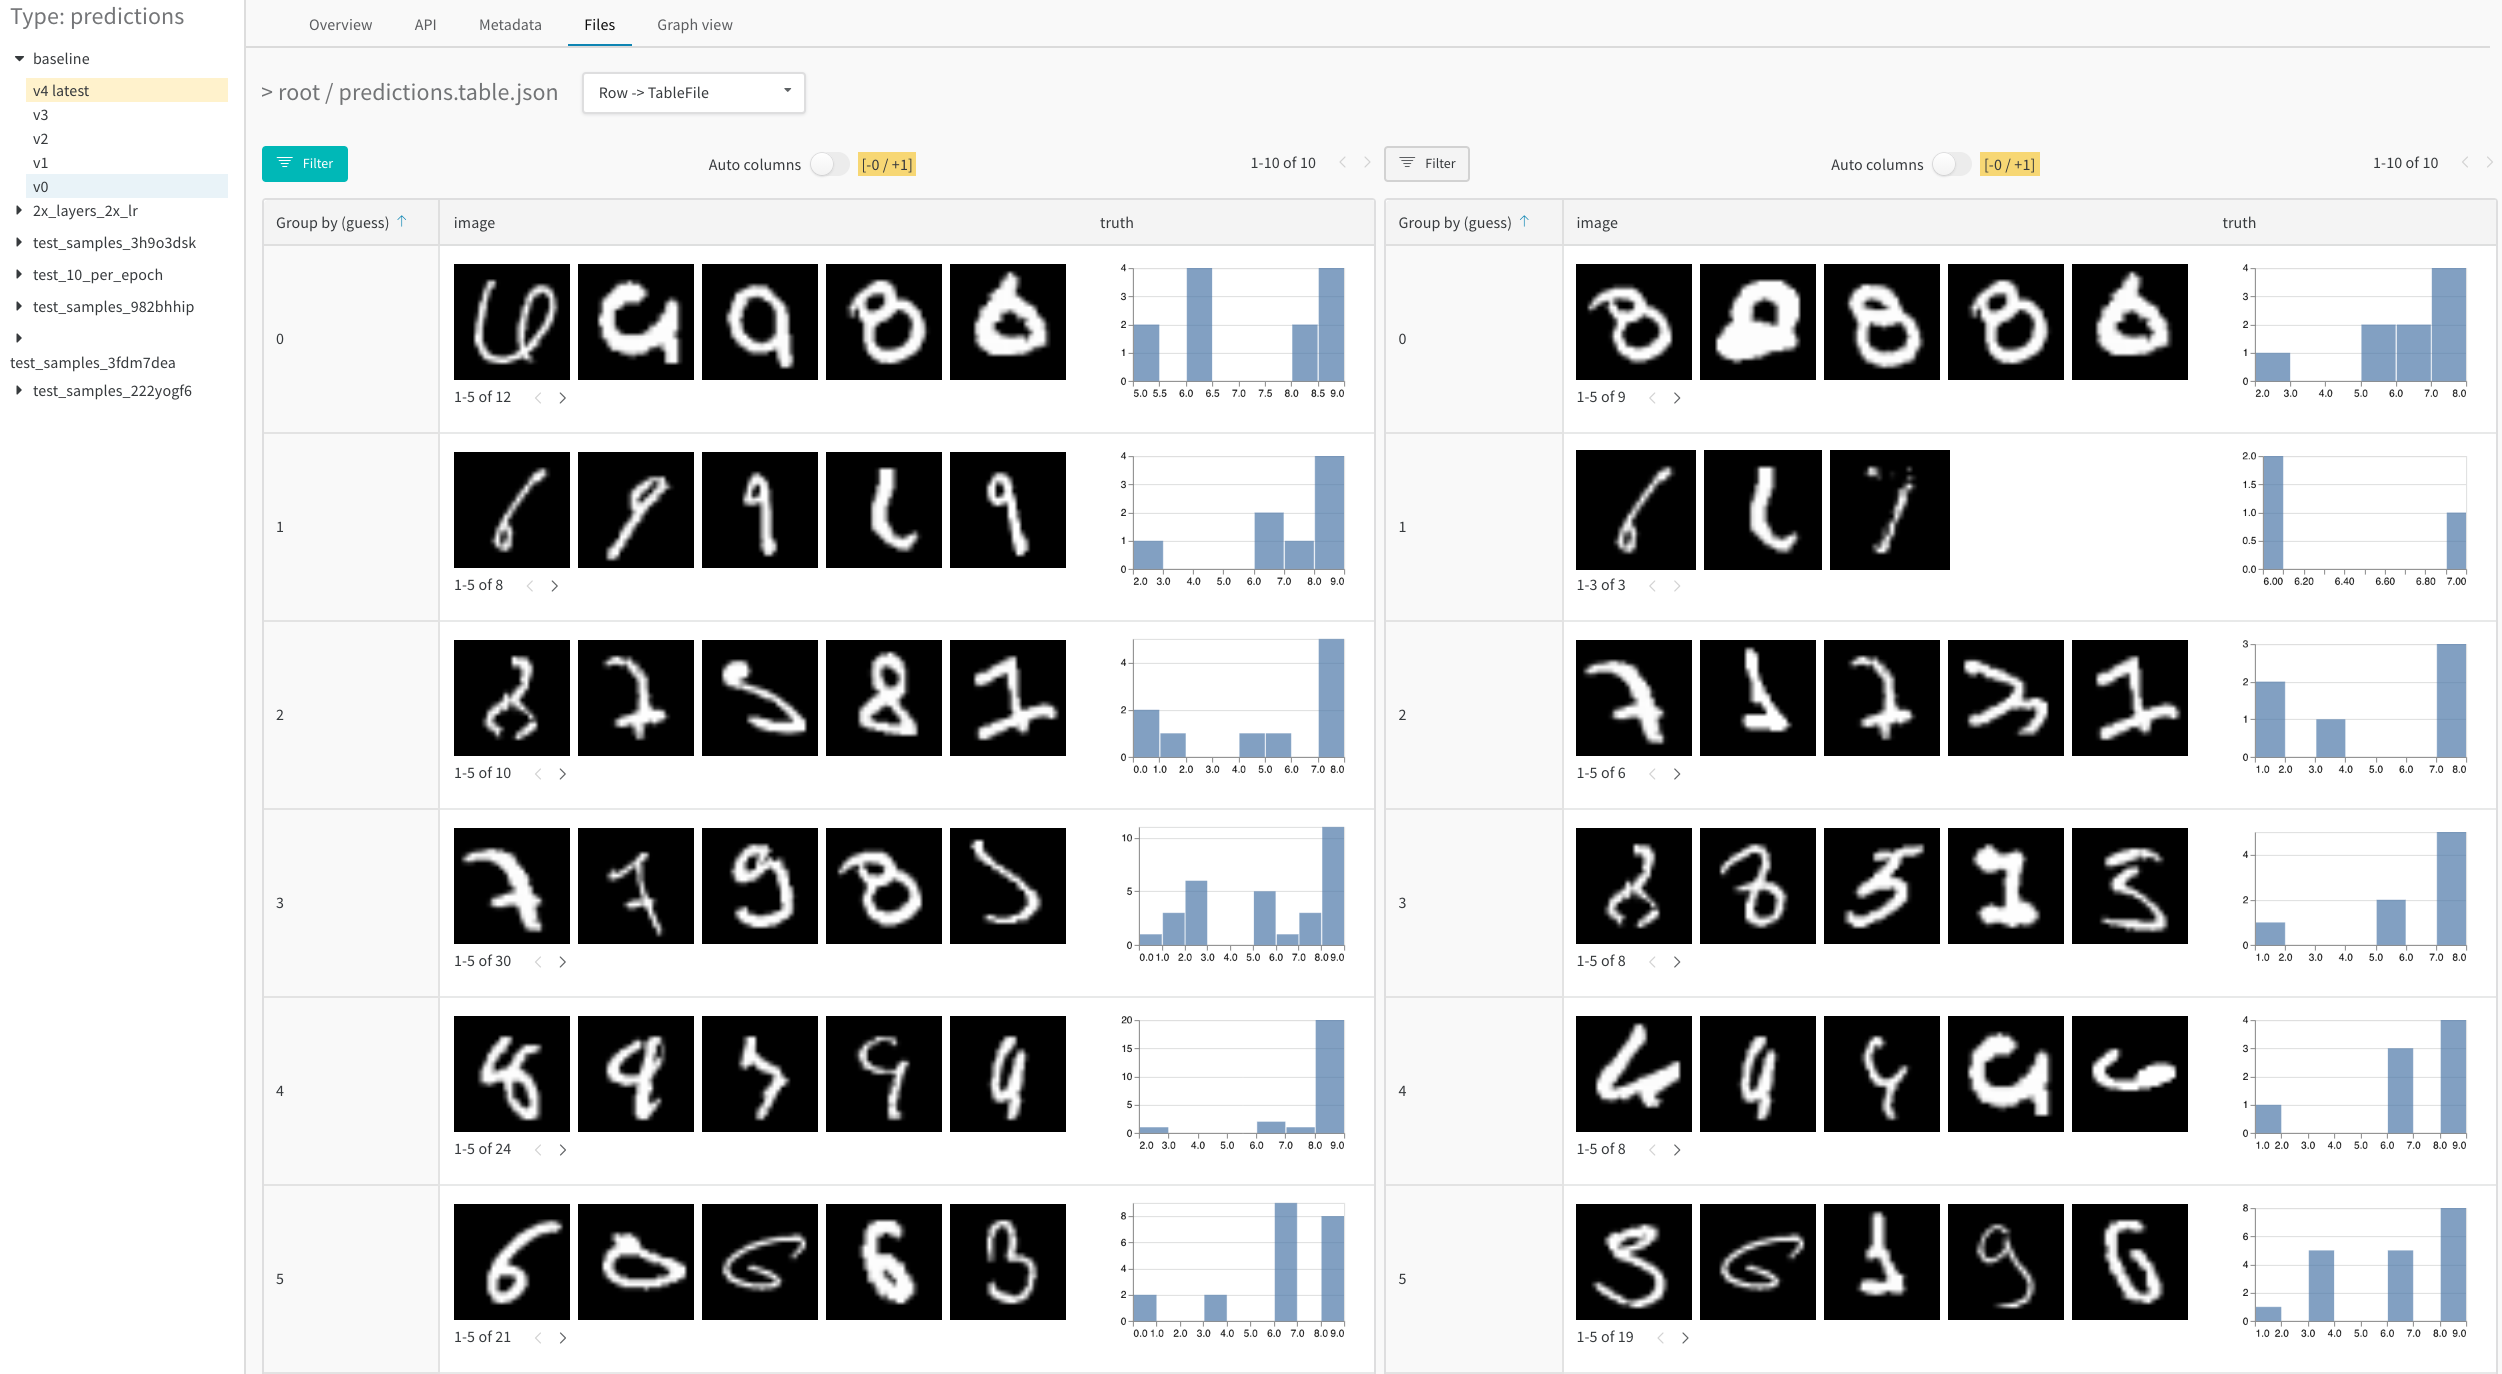 たとえば、[MNISTデータセットで1エポック後と5エポック後の結果を分析した](https://wandb.ai/stacey/mnist-viz/artifacts/predictions/baseline/d888bc05719667811b23/files/predictions.table.json#7dd0cd845c0edb469dec)このサンプル表を参照してください。
## W\&B Tablesを使用しているProjectsの例
以下では、W\&B Tablesを使用している実際のW\&B Projectsをいくつか紹介します。
### 画像分類
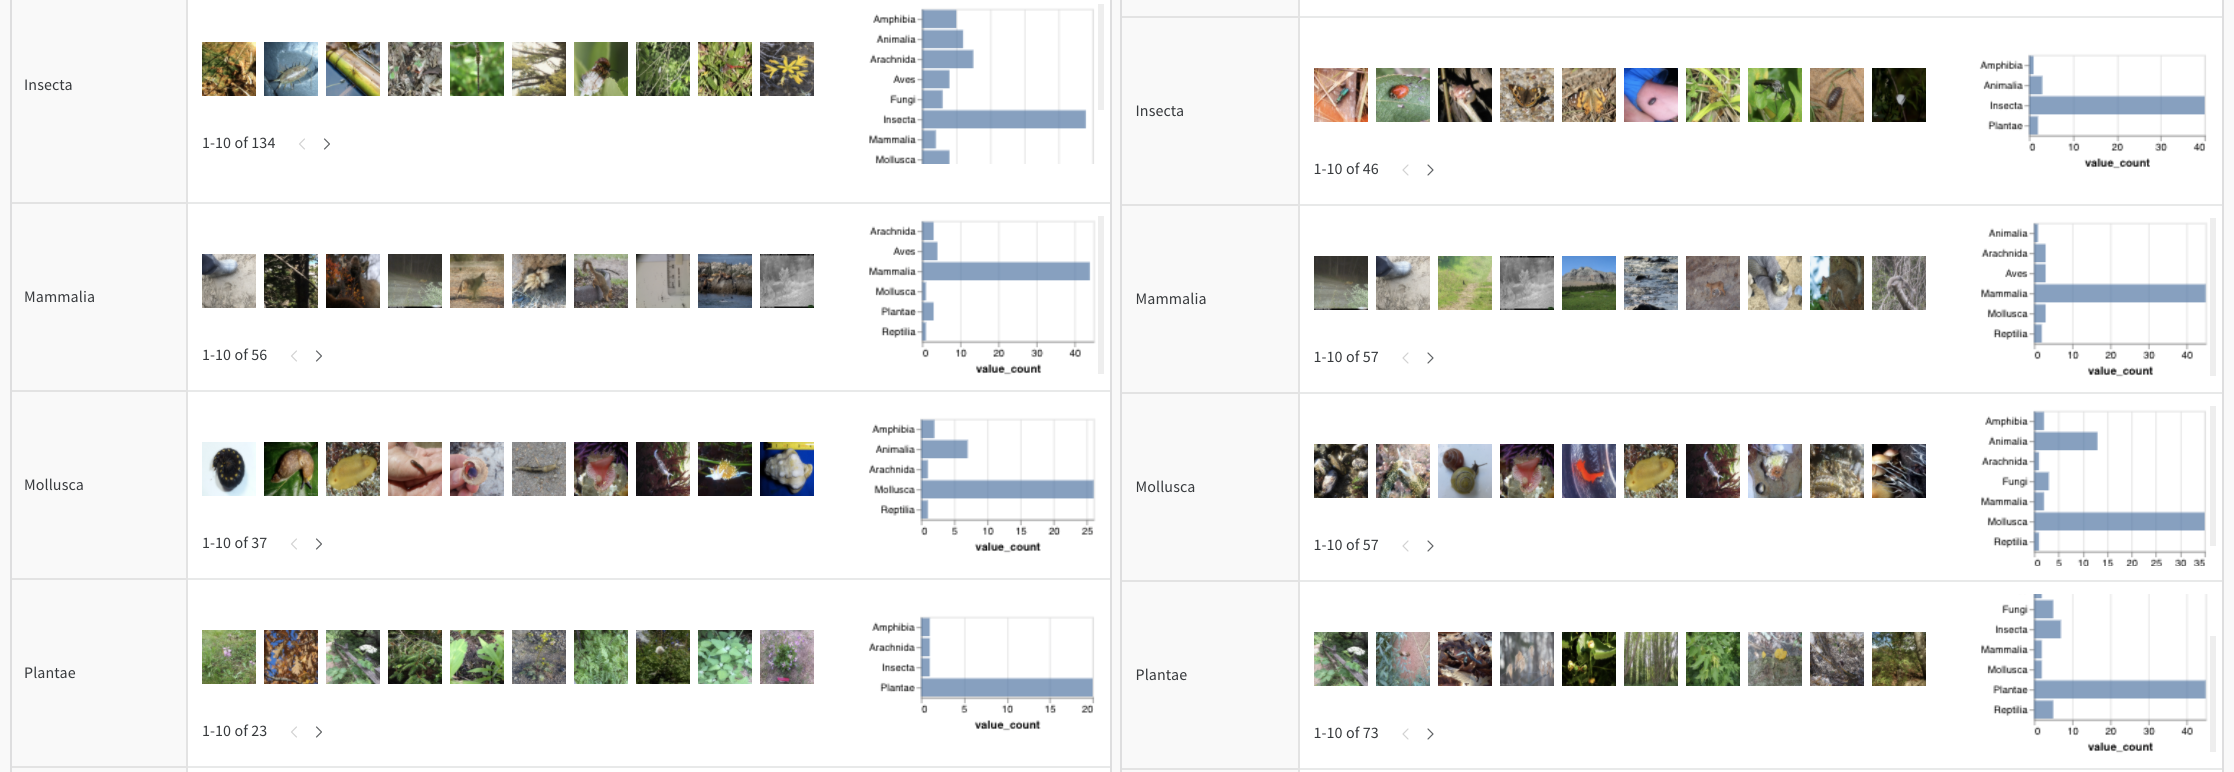
[画像分類向けのデータ可視化](https://wandb.ai/stacey/mendeleev/reports/Visualize-Data-for-Image-Classification--VmlldzozNjE3NjA)を読み、[data visualization nature Colab](https://wandb.me/dsviz-nature-colab)をたどるか、[Artifacts のコンテキスト](https://wandb.ai/stacey/mendeleev/artifacts/val_epoch_preds/val_pred_gawf9z8j/2dcee8fa22863317472b/files/val_epoch_res.table.json)を見て、[iNaturalist](https://www.inaturalist.org/pages/developers) の写真から CNN が生き物の10種類 (植物、鳥、昆虫など) をどのように識別するかを確認してください。
### オーディオ
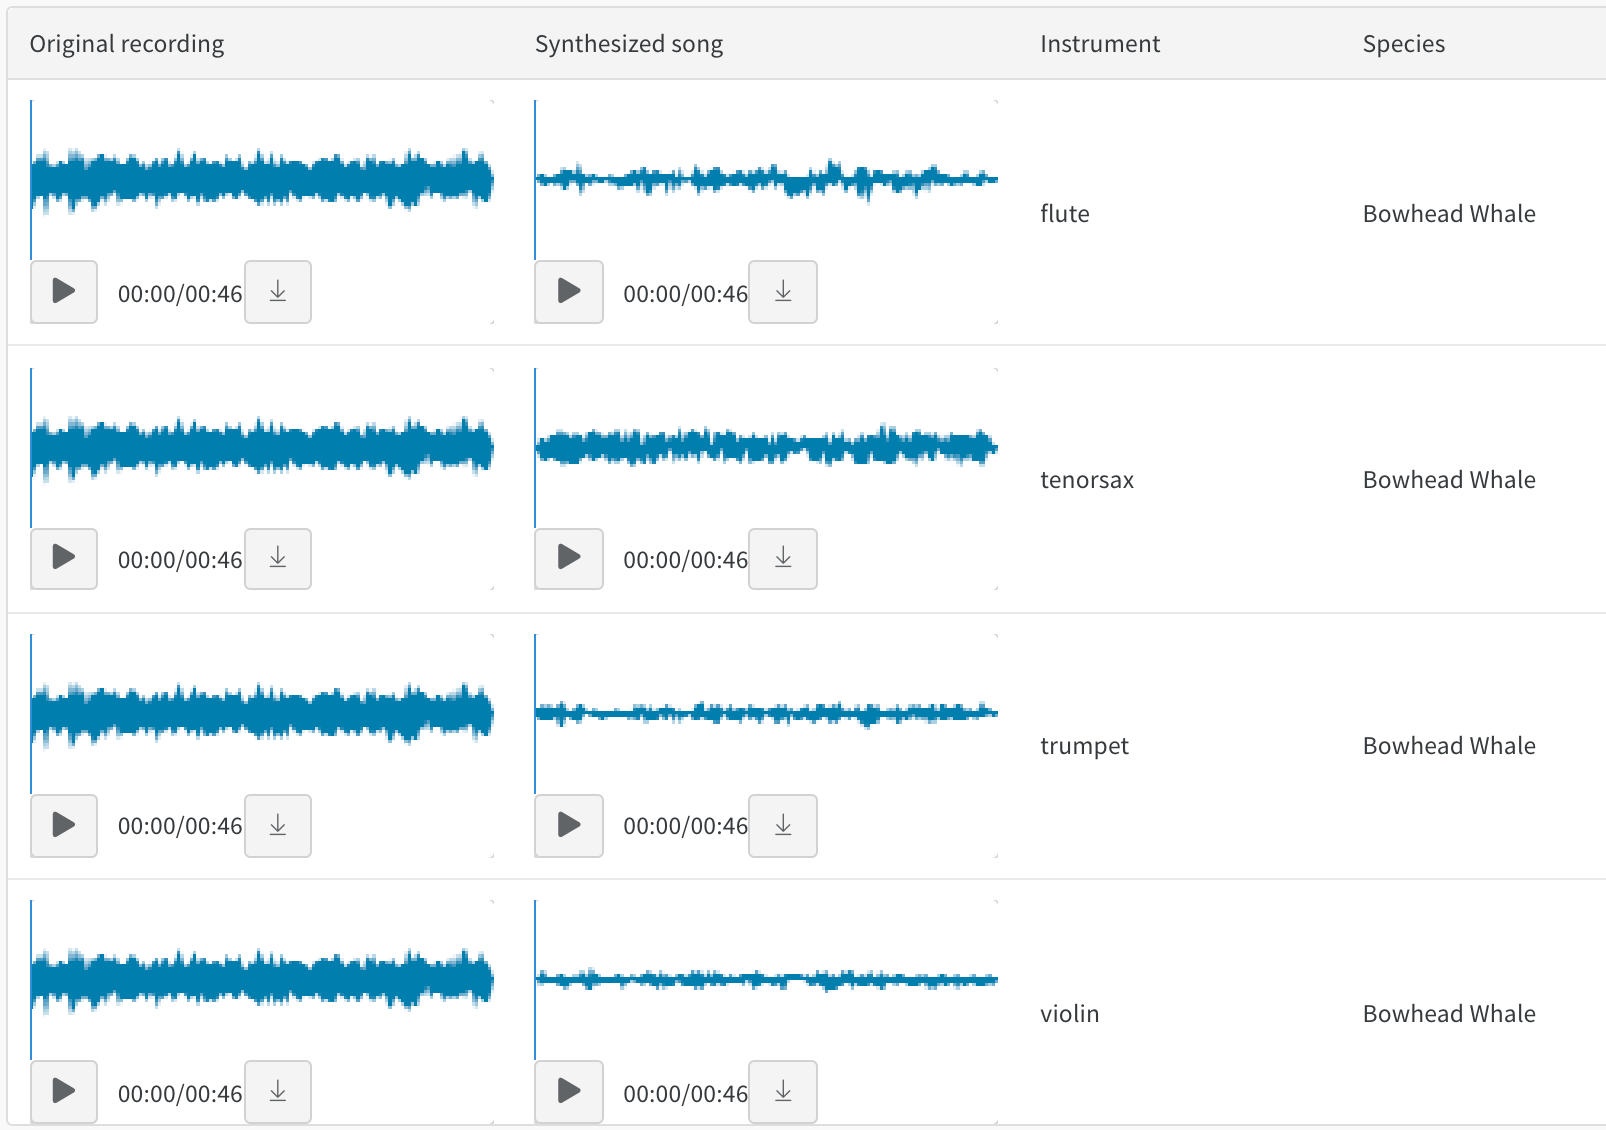
音色変換については、[Whale2Song - W\&B Tables for Audio](https://wandb.ai/stacey/cshanty/reports/Whale2Song-W-B-Tables-for-Audio--Vmlldzo4NDI3NzM) でオーディオテーブルを操作できます。録音したクジラの歌と、同じメロディーをバイオリンやトランペットなどの楽器で合成した音を比較できます。また、[audio transfer Colab](http://wandb.me/audio-transfer) を使って自分の歌を録音し、その合成版を W\&B で試すこともできます。
### テキスト
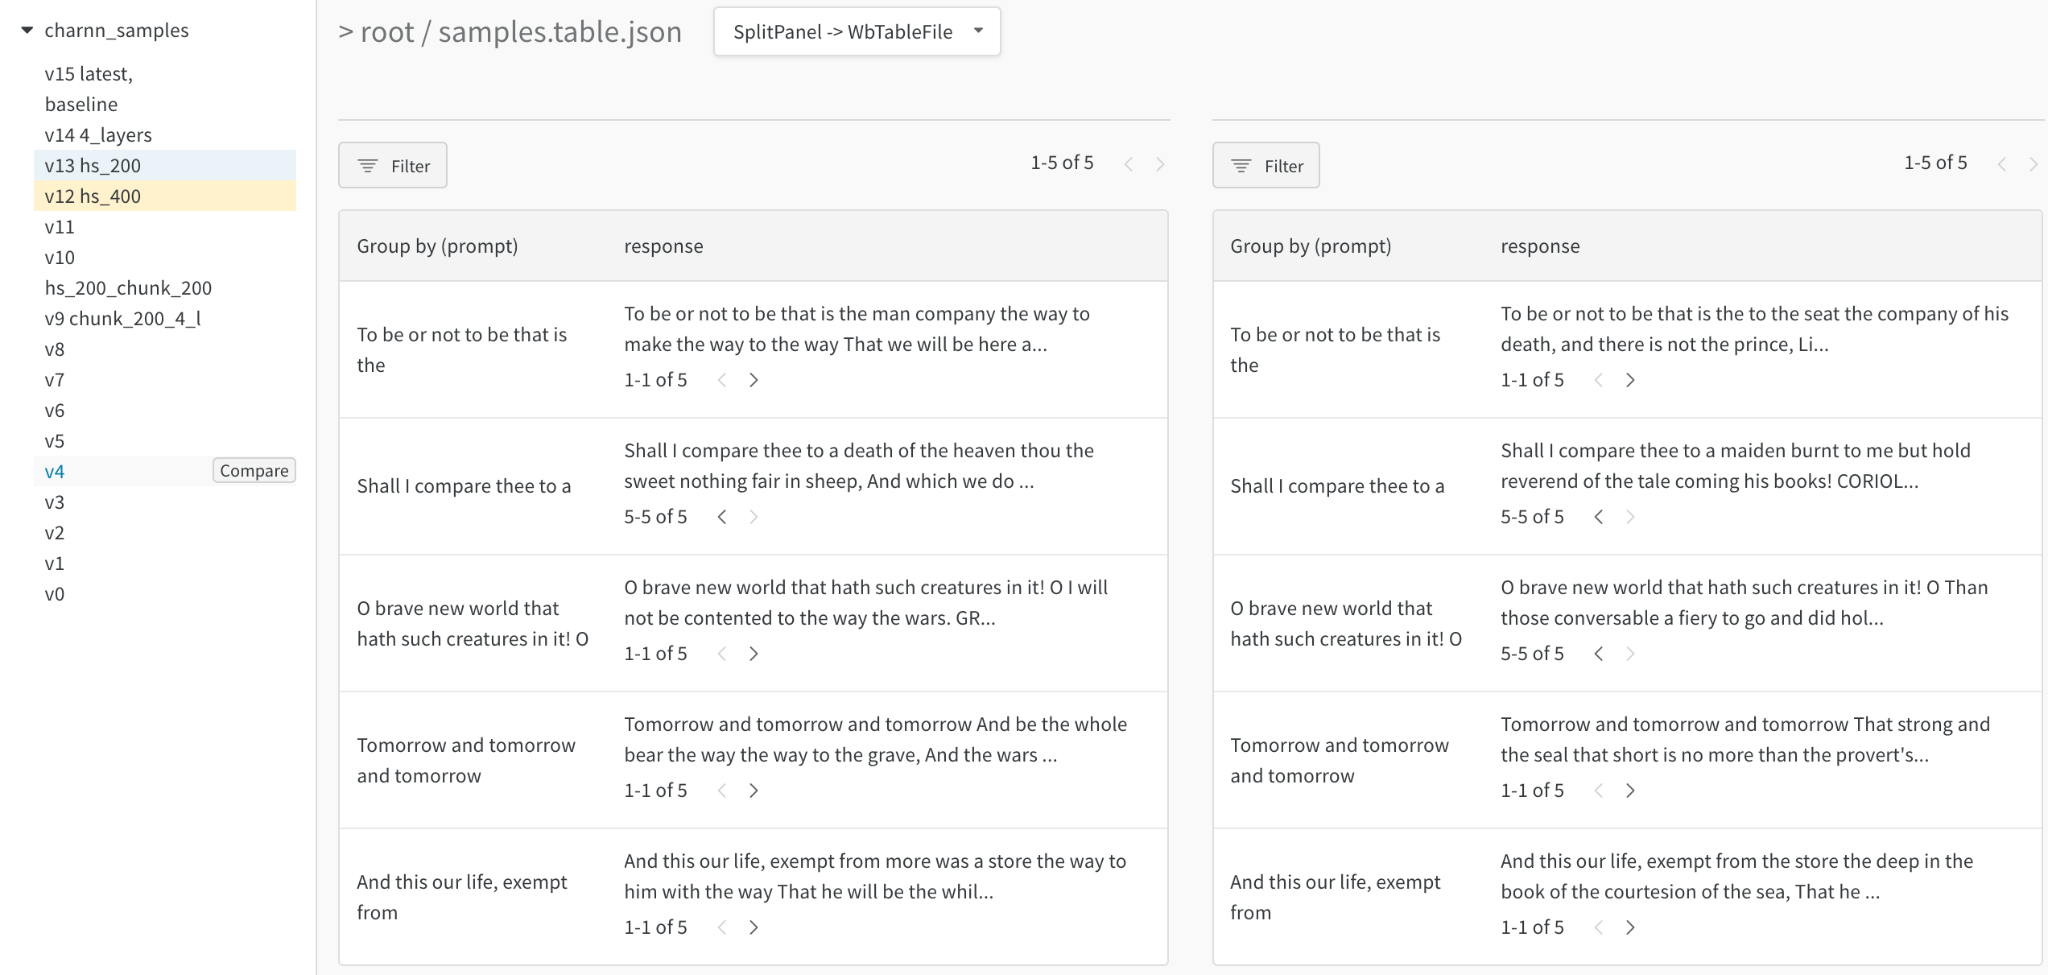
トレーニングデータや生成出力のテキストサンプルを閲覧し、関連するフィールドで動的にグループ化して、モデルのバリアントや実験設定をまたいで評価結果を揃えられます。テキストは Markdown として表示でき、ビジュアル差分モードを使用してテキスト同士を比較することもできます。文字ベースの RNN の例については、[Shakespeare テキスト生成レポート](https://wandb.ai/stacey/nlg/reports/Visualize-Text-Data-Predictions--Vmlldzo1NzcwNzY) を参照してください。
### 動画
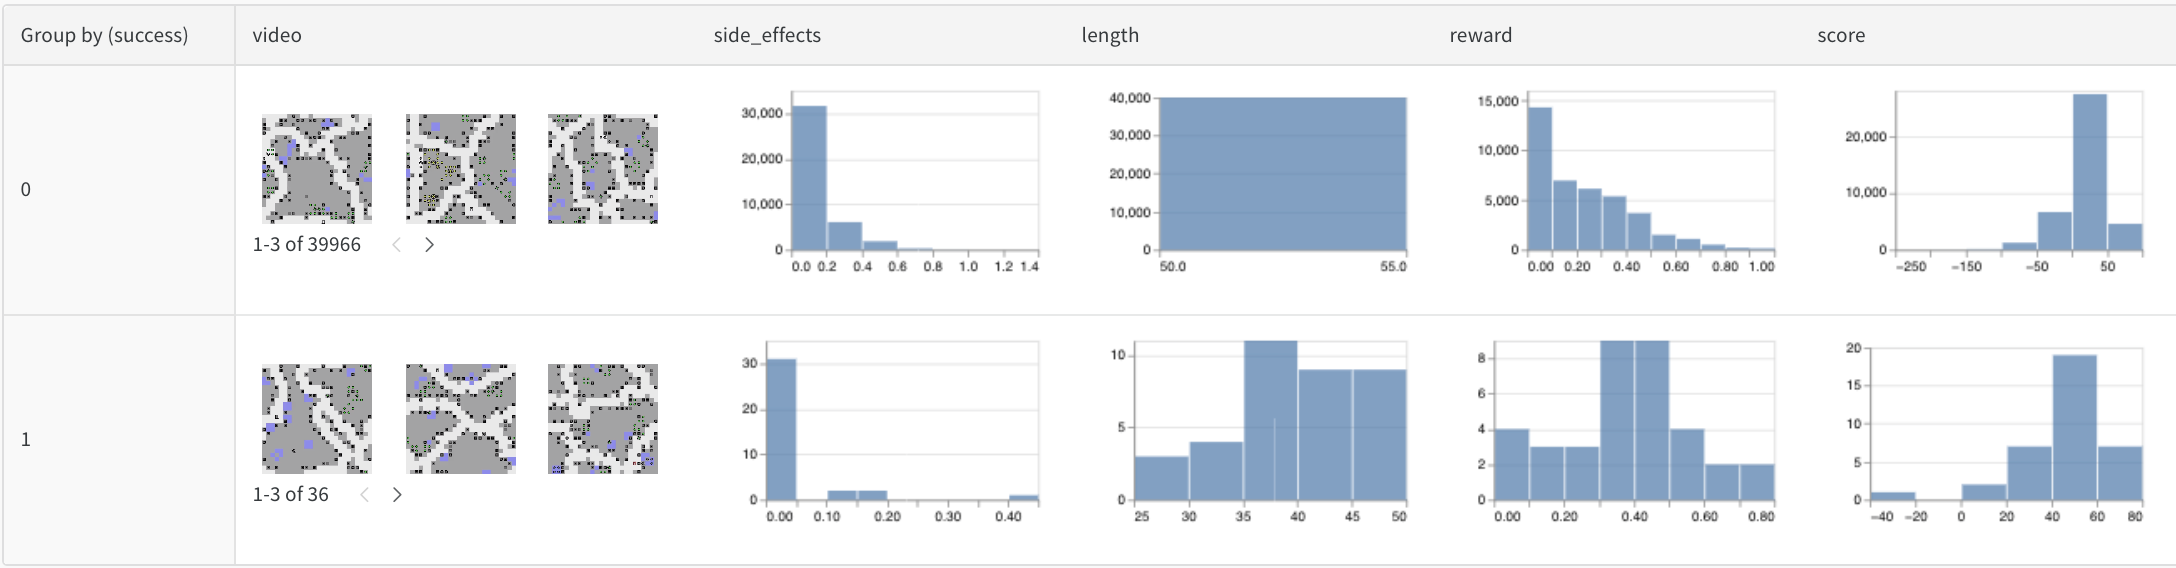
トレーニング中にログした動画を閲覧・集約して、モデルの挙動を把握できます。以下は、副作用を[最小限に抑える](https://wandb.ai/stacey/saferlife/artifacts/video/videos_append-spawn/c1f92c6e27fa0725c154/files/video_examples.table.json)ことを目指す RL エージェント向けに [SafeLife benchmark](https://wandb.ai/safelife/v1dot2/benchmark) を使用した初期の例です。
### 表形式データ
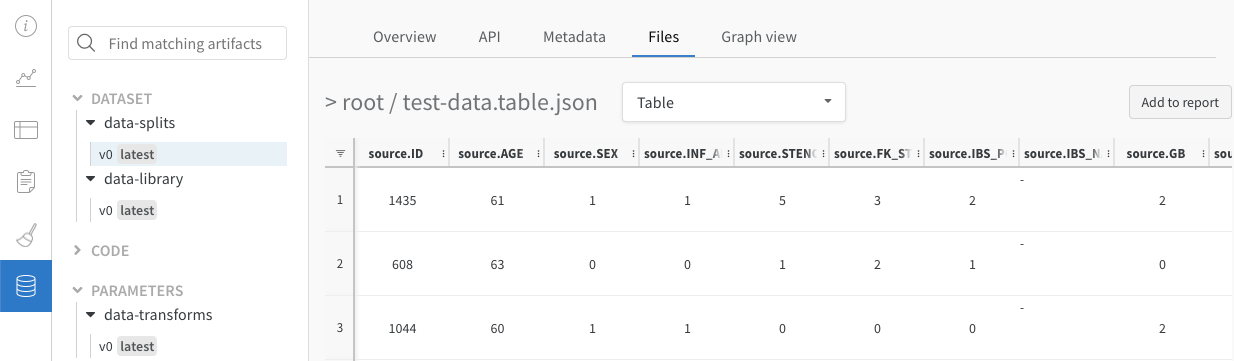
バージョン管理と重複排除を行いながら[表形式データを分割して前処理する方法](https://wandb.ai/dpaiton/splitting-tabular-data/reports/Tabular-Data-Versioning-and-Deduplication-with-Weights-Biases--VmlldzoxNDIzOTA1)を紹介するレポートをご覧ください。
### モデルのバリアントを比較する (セマンティックセグメンテーション)
セマンティックセグメンテーションで Tables をログし、異なるモデルを比較するための[インタラクティブノートブック](https://wandb.me/dsviz-cars-demo)と[ライブデモ](https://wandb.ai/stacey/evalserver_answers_2/artifacts/results/eval_Daenerys/c2290abd3d7274f00ad8/files/eval_results.table.json#a57f8e412329727038c2\$eval_Ada)です。[この Table](https://wandb.ai/stacey/evalserver_answers_2/artifacts/results/eval_Daenerys/c2290abd3d7274f00ad8/files/eval_results.table.json)で独自のクエリを試してみてください。
### トレーニングの進行に伴う改善の分析
[時間経過に伴う予測の可視化](https://wandb.ai/stacey/mnist-viz/reports/Visualize-Predictions-over-Time--Vmlldzo1OTQxMTk)の方法を解説した詳細なレポートと、対応する[インタラクティブノートブック](https://wandb.me/dsviz-mnist-colab)。