> ## Documentation Index
> Fetch the complete documentation index at: https://docs.wandb.ai/llms.txt
> Use this file to discover all available pages before exploring further.
# モデルを比較してランク付けする
> 評価メトリクスに基づいて異なるモデルバージョンを比較し、ランク付けする
Weave のリーダーボードを使用すると、複数のメトリクスにわたって複数のモデルを評価・比較し、精度、生成品質、レイテンシ、またはカスタム評価ロジックを測定できます。リーダーボード を使うと、モデル性能を一元的に可視化し、経時的な変化をトラッキングし、チーム全体でベンチマークを共有できます。
このガイドでは、チームが共有ベンチマークに対してモデルバージョンを比較できるように、リーダーボードを作成、設定、および公開する方法を説明します。
リーダーボード は、次の用途に最適です。
* モデル性能のリグレッションをトラッキングする。
* 共有の評価ワークフローを調整する。
リーダーボード を作成できるのは、Weave UI と Weave Python SDK のみです。TypeScript ユーザーは、[Weave UI](#use-the-ui) を使用して リーダーボード を作成および管理できます。
## リーダーボードを作成する
[Weave UI](#use-the-ui) または [プログラムから](#use-the-python-sdk) リーダーボードを作成できます。一時的な比較には UI を使用し、自動化された評価ワークフローにリーダーボードの作成を組み込むには Python SDK を使用してください。
### UI を使う
Weave UI を使用して、リーダーボードをインタラクティブに作成およびカスタマイズするには、次の手順に従います。
1. Weave UI で、**Leaders** セクションにアクセスします。表示されていない場合は、**More** → **Leaders** をクリックします。
2. **+ New Leaderboard** をクリックします。
3. **Leaderboard Title** フィールドに、わかりやすい名 (例: `summarization-benchmark-v1`) を入力します。
4. 必要に応じて、このリーダーボードで何を比較するのかがわかる説明を追加します。
5. 表示する評価とメトリクスを定義するために、[列を追加](#add-columns)します。
6. レイアウトの準備ができたら、リーダーボードを保存して公開し、他のユーザーと共有します。
#### 列を追加
列は、各モデルについてリーダーボードに表示する内容を定義します。リーダーボードの各列は、特定の評価のメトリクスを表します。列を設定するには、次を指定します。
* **評価**: ドロップダウンから評価 run を選択します (事前に作成されている必要があります) 。
* **Scorer**: その評価で使用するスコアリング関数 (たとえば `jaccard_similarity` または `simple_accuracy`) を選択します。
* **メトリクス**: 表示するサマリー メトリクス (たとえば `mean` または `true_fraction`) を選択します。
列をさらに追加するには、**列を追加** をクリックします。
列を編集するには、右側の action () メニューをクリックします。次の操作ができます。
* **前または後に移動**. 列の順序を変更します。
* **複製**. 列の定義をコピーします。
* **削除**. 列を削除します。
* **昇順で並べ替え**. リーダーボードのデフォルトの並べ替え順を設定します (もう一度クリックすると降順に切り替わります) 。
### Python SDK を使用する
Python SDK を使用すると、コード内でリーダーボードを定義、公開、取得できます。この方法では、評価コードとともにリーダーボードをバージョン管理し、自動化されたワークフローの一部として実行できます。
完全な実行可能コードのサンプルをお探しの場合は、[エンドツーエンドの Python の例](#end-to-end-python-example)を参照してください。
リーダーボードを作成して公開するには、次の手順に従います。
1. テスト用データセットを定義します。組み込みの[`Dataset`](./datasets)を使用することも、input と target のリストを手動で定義することもできます。
```python lines theme={null}
dataset = [
{"input": "...", "target": "..."},
...
]
```
2. 1 つ以上の[Scorer](../evaluation/scorers)を定義します。
```python lines theme={null}
@weave.op
def jaccard_similarity(target: str, output: str) -> float:
...
```
3. [`評価`](../core-types/evaluations)を作成します。
```python lines theme={null}
evaluation = weave.Evaluation(
name="My Eval",
dataset=dataset,
scorers=[jaccard_similarity],
)
```
4. 評価するモデルを定義します。
```python lines theme={null}
@weave.op
def my_model(input: str) -> str:
...
```
5. 評価を実行します。
```python lines theme={null}
async def run_all():
await evaluation.evaluate(model_vanilla)
await evaluation.evaluate(model_humanlike)
await evaluation.evaluate(model_messy)
asyncio.run(run_all())
```
6. リーダーボードを作成します。
```python lines theme={null}
spec = leaderboard.Leaderboard(
name="My Leaderboard",
description="Evaluating models on X task",
columns=[
leaderboard.LeaderboardColumn(
evaluation_object_ref=get_ref(evaluation).uri(),
scorer_name="jaccard_similarity",
summary_metric_path="mean",
)
]
)
```
7. リーダーボードを公開します。
```python lines theme={null}
weave.publish(spec)
```
8. 結果を取得します。
```python lines theme={null}
results = leaderboard.get_leaderboard_results(spec, client)
print(results)
```
公開後、リーダーボードは Weave UI の **Leaders** タブで利用できるようになり、チームでモデル性能を表示して比較できます。
## エンドツーエンドの Python の例
次の例では、Weave の評価機能を使用して、カスタムメトリクスで共有データセット上の 3 つの要約モデルを比較するリーダーボードを作成します。小規模なベンチマークを作成し、各モデルを評価し、[ジャッカード類似度](https://www.learndatasci.com/glossary/jaccard-similarity/)で各モデルをスコアリングし、その結果を Weave リーダーボードに公開します。
```python lines theme={null}
import weave
from weave.flow import leaderboard
from weave.trace.ref_util import get_ref
import asyncio
client = weave.init("leaderboard-demo")
dataset = [
{
"input": "Weave is a tool for building interactive LLM apps. It offers observability, trace inspection, and versioning.",
"target": "Weave helps developers build and observe LLM applications."
},
{
"input": "The OpenAI GPT-4o model can process text, audio, and vision inputs, making it a multimodal powerhouse.",
"target": "GPT-4o is a multimodal model for text, audio, and images."
},
{
"input": "The W&B team recently added native support for agents and evaluations in Weave.",
"target": "W&B added agents and evals to Weave."
}
]
@weave.op
def jaccard_similarity(target: str, output: str) -> float:
target_tokens = set(target.lower().split())
output_tokens = set(output.lower().split())
intersection = len(target_tokens & output_tokens)
union = len(target_tokens | output_tokens)
return intersection / union if union else 0.0
evaluation = weave.Evaluation(
name="Summarization Quality",
dataset=dataset,
scorers=[jaccard_similarity],
)
@weave.op
def model_vanilla(input: str) -> str:
return input[:50]
@weave.op
def model_humanlike(input: str) -> str:
if "Weave" in input:
return "Weave helps developers build and observe LLM applications."
elif "GPT-4o" in input:
return "GPT-4o supports text, audio, and vision input."
else:
return "W&B added agent support to Weave."
@weave.op
def model_messy(input: str) -> str:
return "Summarizer summarize models model input text LLMs."
async def run_all():
await evaluation.evaluate(model_vanilla)
await evaluation.evaluate(model_humanlike)
await evaluation.evaluate(model_messy)
asyncio.run(run_all())
spec = leaderboard.Leaderboard(
name="Summarization Model Comparison",
description="Evaluate summarizer models using Jaccard similarity on three short samples.",
columns=[
leaderboard.LeaderboardColumn(
evaluation_object_ref=get_ref(evaluation).uri(),
scorer_name="jaccard_similarity",
summary_metric_path="mean",
)
]
)
weave.publish(spec)
results = leaderboard.get_leaderboard_results(spec, client)
print(results)
```
### リーダーボード を表示して読み解く
スクリプトがリーダーボードを公開したら、Weave UI を使用して結果を確認し、モデル性能を並べて比較します。
1. **Weave UI** で **Leaders** タブに移動します。表示されていない場合は、**More** をクリックして **Leaders** を選択します。
2. リーダーボード の名をクリックします。たとえば `Summarization Model Comparison`。
リーダーボード の表では、各行が各モデル (`model_humanlike`、`model_vanilla`、`model_messy`) を表します。`mean` 列には、モデルの出力と参照サマリーの間のジャッカード類似度の平均が表示されます。
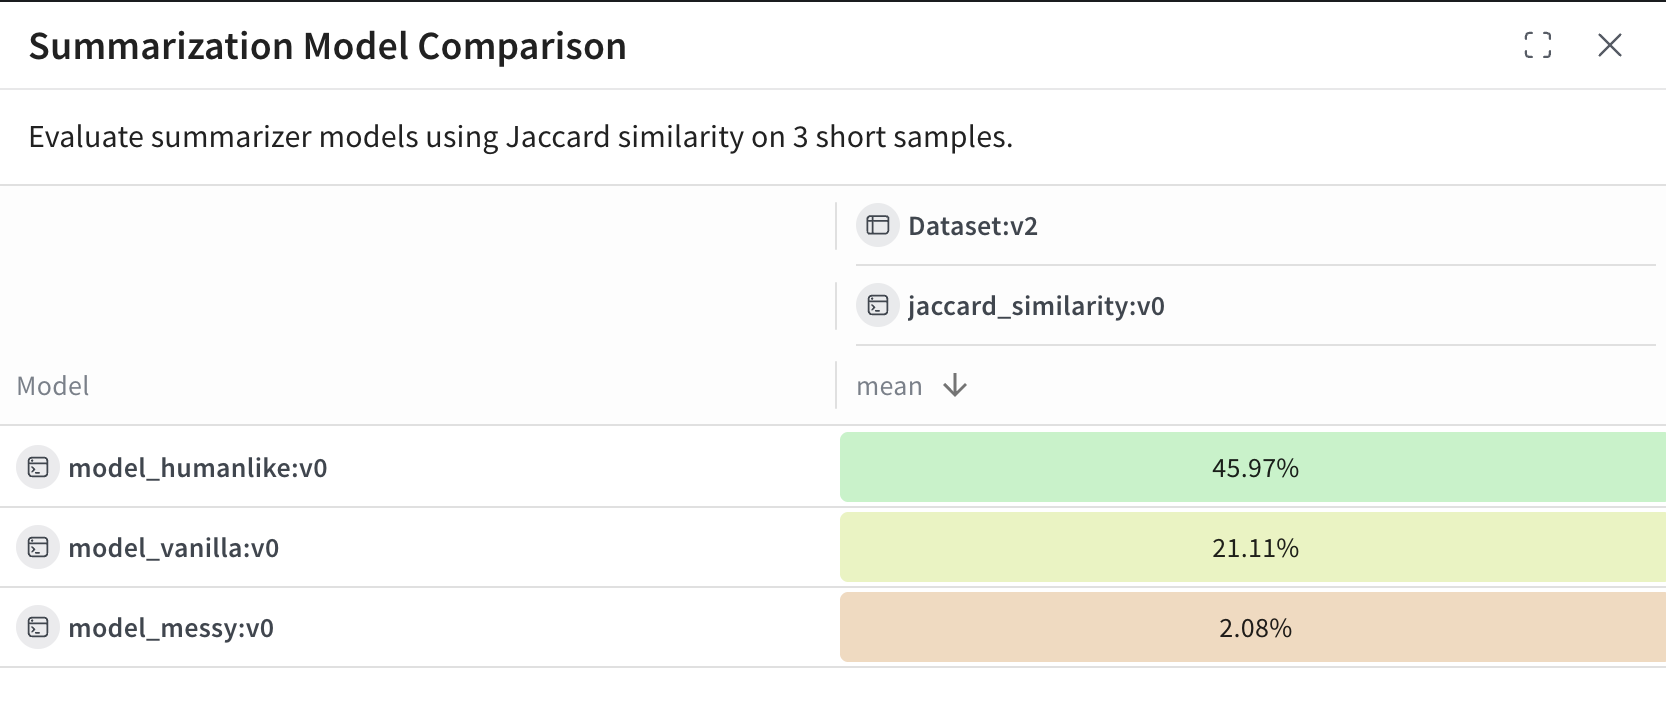 この例では:
* `model_humanlike` が最も良い結果で、重複率は約 46 パーセントです。
* `model_vanilla` (単純な切り詰め) は約 21 パーセントです。
* `model_messy` は意図的に性能を悪くしたモデルで、スコアは約 2 パーセントです。
この例では:
* `model_humanlike` が最も良い結果で、重複率は約 46 パーセントです。
* `model_vanilla` (単純な切り詰め) は約 21 パーセントです。
* `model_messy` は意図的に性能を悪くしたモデルで、スコアは約 2 パーセントです。