> ## Documentation Index
> Fetch the complete documentation index at: https://docs.wandb.ai/llms.txt
> Use this file to discover all available pages before exploring further.
> artifact 리니지 그래프를 확인하고 탐색하여 W&B run의 입력과 출력을 방향 비순환 그래프(DAG)로 추적합니다.
# artifact 리니지 그래프 탐색
W\&B는 *리니지 그래프* 라고 하는 방향 비순환 그래프(DAG)를 사용해 run의 입력과 출력을 추적합니다. 리니지 그래프는 ML 실험에서 artifact와 run 간의 관계를 시각적으로 나타낸 것입니다. 이 그래프는 원시 데이터 수집부터 모델 트레이닝과 평가에 이르기까지 ML lifecycle의 여러 단계에서 데이터와 모델이 어떻게
흐르는지 보여줍니다.
artifact 리니지를 추적하면 다음과 같은 주요 이점이 있습니다:
* **재현성**: 디버깅, 실험, 검증을 위해 팀이 Experiments, 모델, 결과를 재현할 수 있게 합니다.
* **버전 관리**: 시간에 따른 artifact의 변경 사항을 추적하여 필요할 때 팀이 이전 데이터 또는 모델 버전으로 되돌릴 수 있게 합니다.
* **감사**: artifact와 변환의 상세 기록을 유지하여 규정 준수와 거버넌스를 지원합니다.
* **협업**: 실험 이력을 투명하게 하여 중복 작업을 줄이고 개발 속도를 높임으로써 협업을 개선합니다.
## artifact의 리니지 그래프 보기
artifact의 리니지 그래프를 보려면 다음 단계를 따르세요:
1. W\&B App에서 프로젝트의 Workspace로 이동합니다.
2. 프로젝트 사이드바에서 **Artifacts** 탭을 클릭합니다.
3. artifact를 선택한 다음 **Lineage** 탭을 클릭합니다.
## 리니지 그래프 탐색
리니지 그래프는 ML 실험에서 artifact와 run 사이의 관계를 시각적으로 보여주는 그래프입니다. W\&B App UI 또는 Python SDK를 사용해 artifact의 리니지 그래프를 탐색하고 따라갈 수 있습니다.
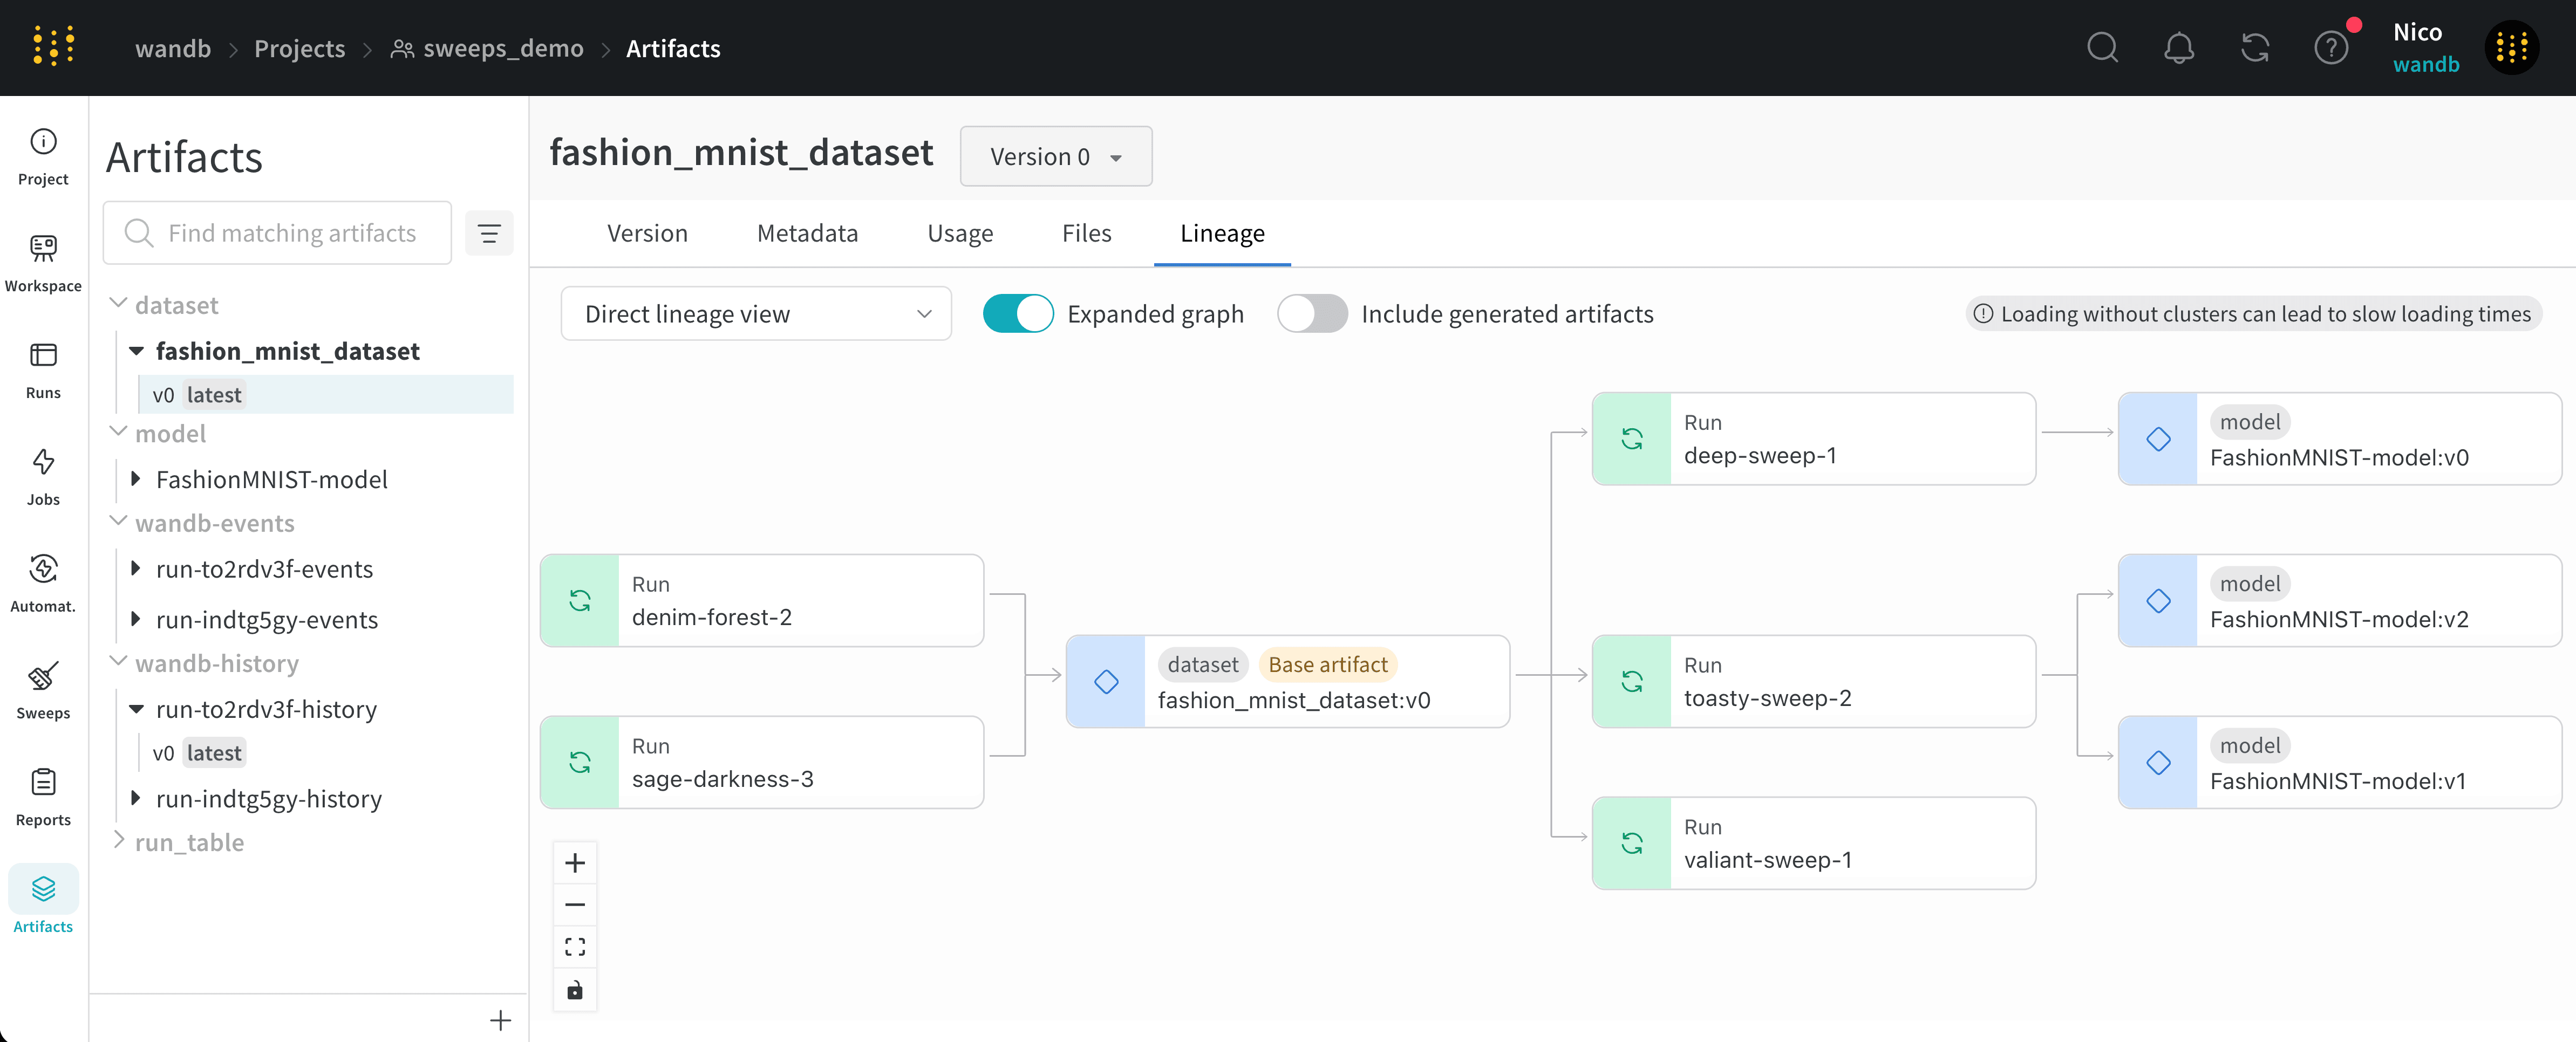
초록색 아이콘이 있는 노드는 run을 나타냅니다. 파란색 아이콘이 있는 노드는 artifact를 나타냅니다. 노드 사이의 화살표는 run 또는 artifact의 입력과 출력을 나타냅니다.
Artifact 노드에는 `:` 형식으로 artifact 이름과 버전이 함께 표시됩니다. artifact의 유형은 artifact 이름 위에 표시됩니다.
왼쪽 사이드바와 리니지 그래프 노드 모두에서 artifact의 유형과 이름을 확인할 수 있습니다.
Run 노드에는 run 이름이 표시됩니다.
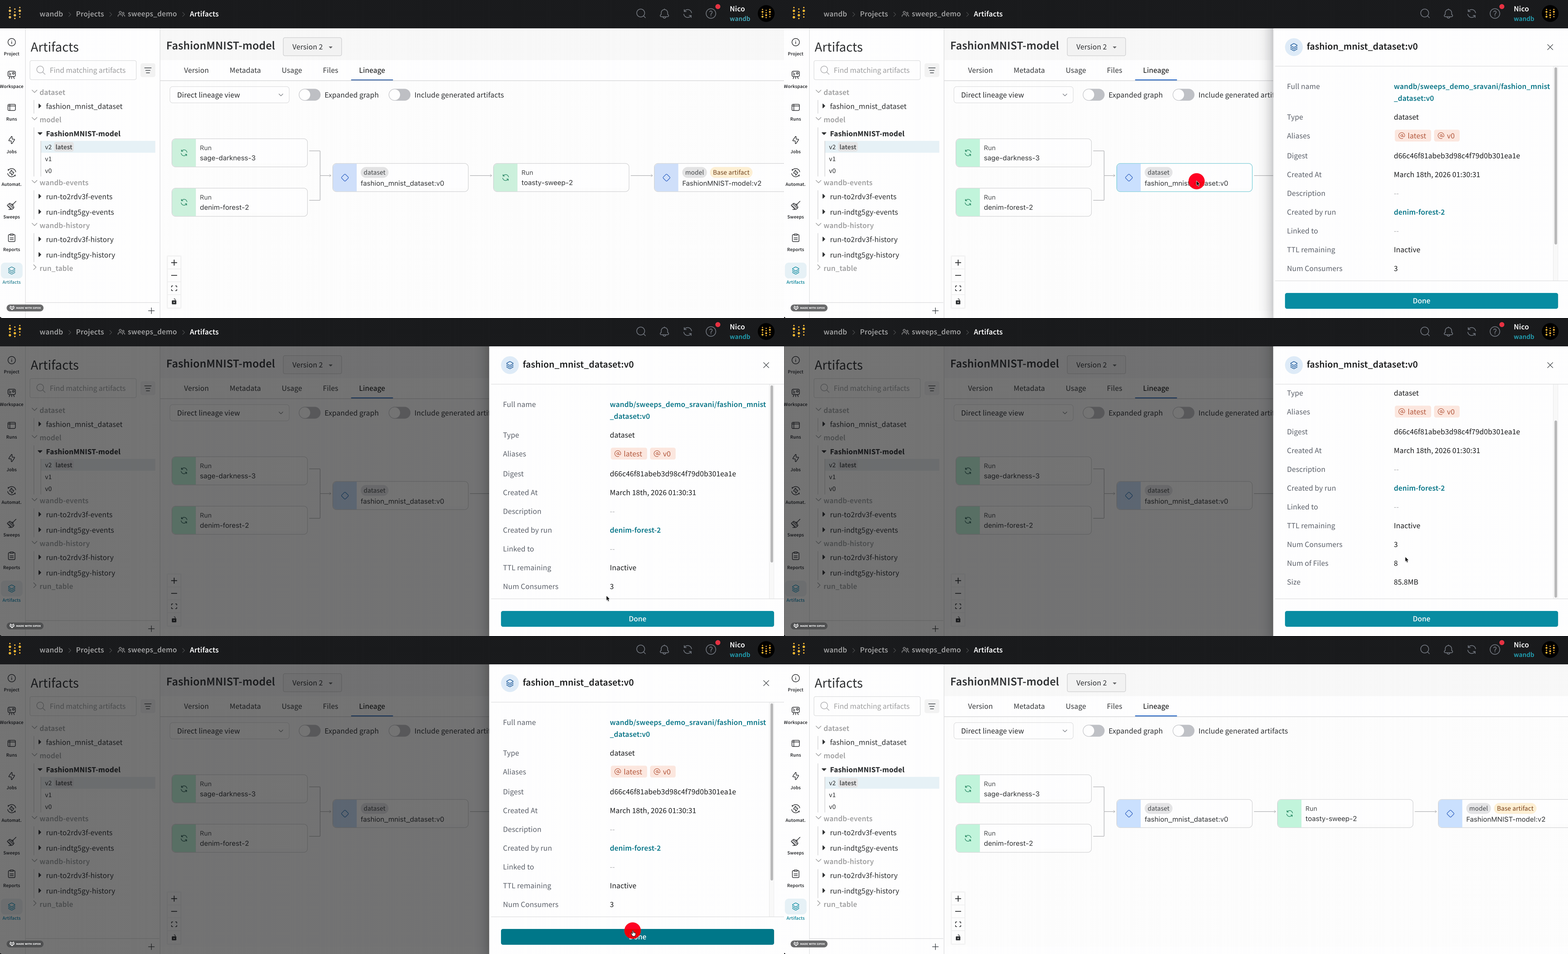
 개별 run을 클릭하면 시작 시간, 소요 시간, 작성자, 작업 유형 등 해당 run에 대한 자세한 정보를 확인할 수 있습니다. 개별 artifact를 클릭하면 alias, 생성 시간, 유형, 버전, 설명, 해당 artifact를 로깅한 run, 파일 크기 등 artifact에 대한 자세한 정보를 확인할 수 있습니다.
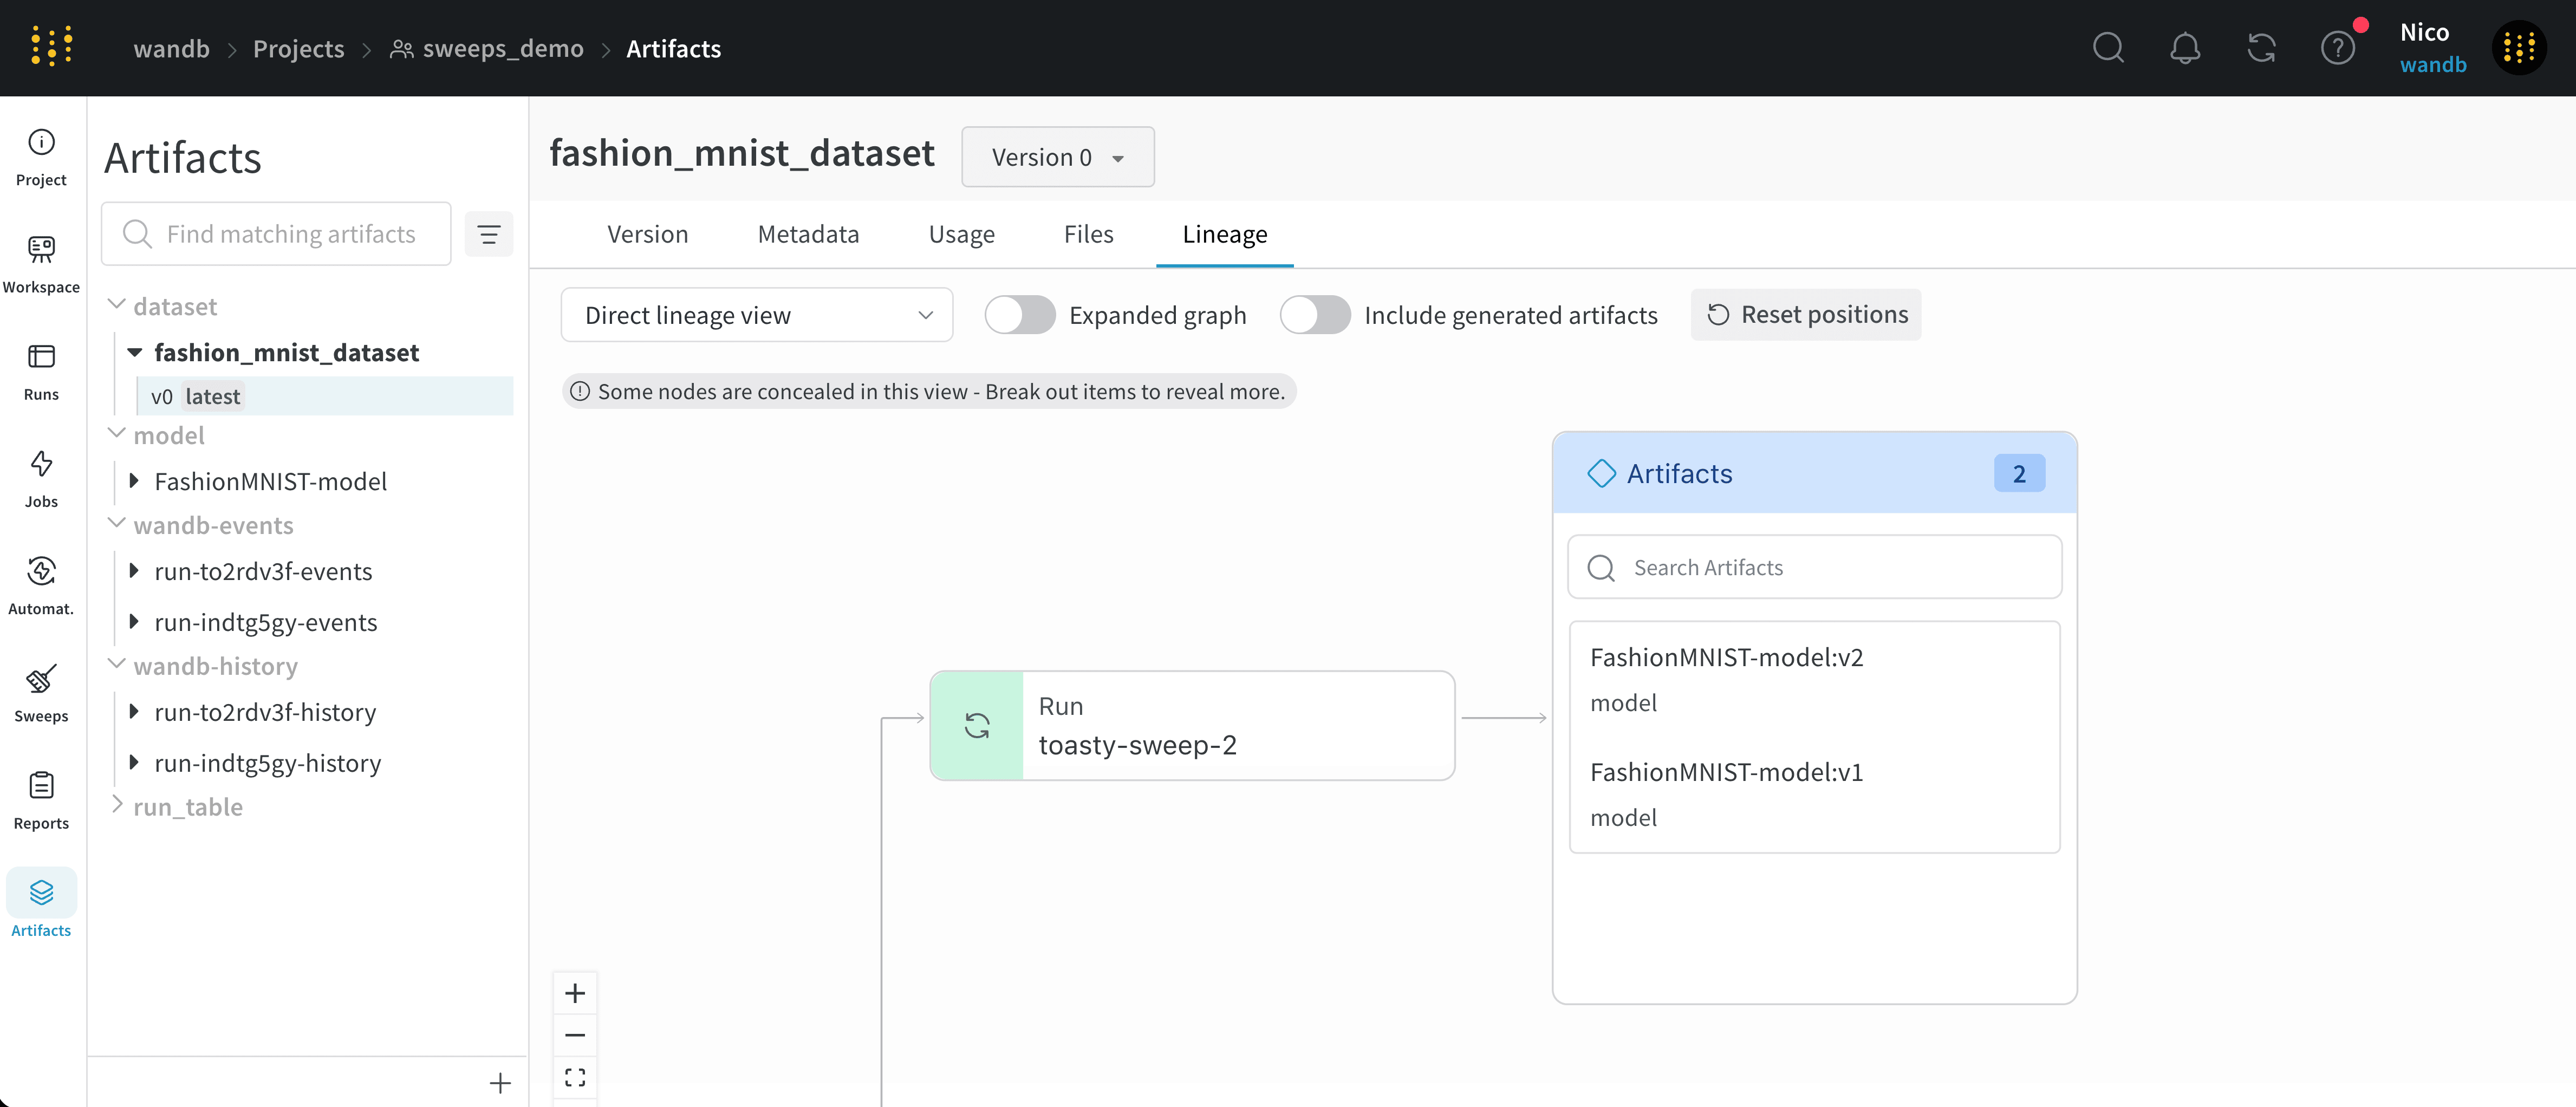
 동일한 artifact의 여러 버전을 생성하는 run은 cluster로 함께 그룹화됩니다. cluster 내에 나열된 특정 artifact 버전을 클릭하면 해당 artifact 버전에 대한 자세한 정보를 볼 수 있습니다.
 노드를 클릭한 채 끌어 그래프를 재배치해 레이아웃을 사용자 지정할 수 있습니다. 그래프를 확대하거나 축소해 노드와 그 관계를 더 잘 볼 수도 있습니다.
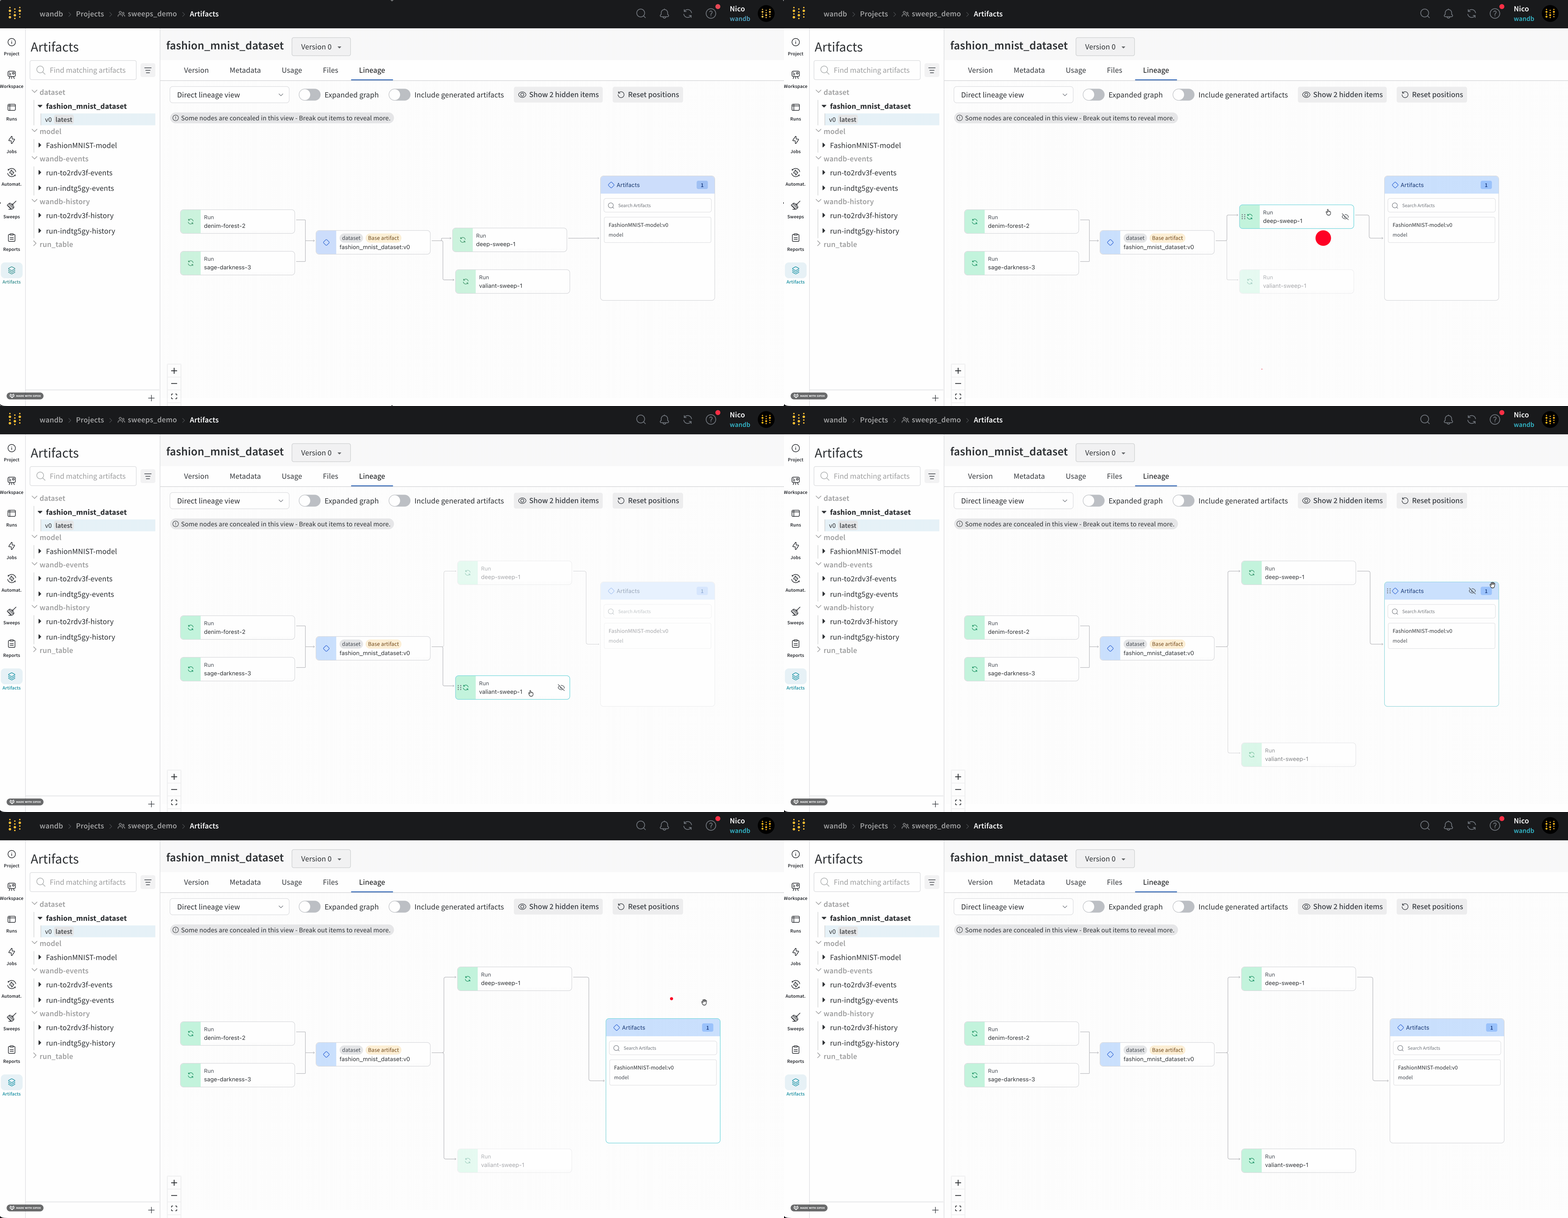 노드 위에 마우스를 올린 다음 눈 아이콘을 클릭하면 그래프에서 노드를 숨기거나 표시할 수 있습니다. 이는 특정 노드와 그 관계에 집중할 수 있도록 그래프를 정리할 때 유용합니다.
W\&B Python SDK를 사용해 프로그래밍 방식으로 그래프를 탐색할 수 있습니다. artifact 객체의
[`logged_by()`](/ko/models/ref/python/experiments/artifact#method-artifact-logged-by) 및 [`used_by()`](/ko/models/ref/python/experiments/artifact#method-artifact-used-by) 메서드를 사용해 그래프를 따라가세요:
```python theme={null}
with wandb.init() as run:
artifact = run.use_artifact("artifact_name:latest")
# artifact에서 그래프를 위아래로 따라갑니다:
producer_run = artifact.logged_by()
consumer_runs = artifact.used_by()
```
노드 위에 마우스를 올린 다음 눈 아이콘을 클릭하면 그래프에서 노드를 숨기거나 표시할 수 있습니다. 이는 특정 노드와 그 관계에 집중할 수 있도록 그래프를 정리할 때 유용합니다.
W\&B Python SDK를 사용해 프로그래밍 방식으로 그래프를 탐색할 수 있습니다. artifact 객체의
[`logged_by()`](/ko/models/ref/python/experiments/artifact#method-artifact-logged-by) 및 [`used_by()`](/ko/models/ref/python/experiments/artifact#method-artifact-used-by) 메서드를 사용해 그래프를 따라가세요:
```python theme={null}
with wandb.init() as run:
artifact = run.use_artifact("artifact_name:latest")
# artifact에서 그래프를 위아래로 따라갑니다:
producer_run = artifact.logged_by()
consumer_runs = artifact.used_by()
```
## 리니지 그래프 추적 활성화
리니지 그래프 추적을 활성화하려면 W\&B Python SDK를 사용해 artifact를 run의 [입력](/ko/models/artifacts/explore-and-traverse-an-artifact-graph) 또는
[출력](/ko/models/artifacts/explore-and-traverse-an-artifact-graph#track-the-output-of-a-run)으로 지정해야 합니다.
### run의 입력 추적
[`wandb.Run.use_artifact()`](/ko/models/ref/python/experiments/run#method-runuse_artifact)
방법을 사용해 artifact를 run의 입력(또는 종속성)으로 표시합니다. artifact의 이름과 해당 artifact의 특정 버전을 참조하기 위한 선택 alias를 지정합니다. 해당
artifact의 이름 형식은 `:` 또는 `:`입니다.
꺾쇠괄호(`< >`)로 묶인 값을 실제 값으로 바꾸세요:
```python theme={null}
import wandb
# run 초기화
with wandb.init(entity="", project="") as run:
# artifact 조회 후 dependency로 표시
artifact = run.use_artifact(artifact_or_name="", aliases="")
```
### run의 출력 추적하기
[`wandb.Run.log_artifact()`](/ko/models/ref/python/experiments/run#log_artifact)를 사용해 artifact를 run의 출력으로 선언합니다. 먼저,
[`wandb.Artifact()`](/ko/models/ref/python/experiments/artifact#wandb.Artifact) 생성자로 artifact를 만듭니다. 그런 다음,
`wandb.Run.log_artifact()`를 사용해 artifact를 run의 출력으로 로그합니다.
꺾쇠괄호(`< >`)로 둘러싸인 값을 사용자 값으로 바꾸세요:
```python theme={null}
import wandb
# run 초기화
with wandb.init(entity="", project="") as run:
# artifact 생성
artifact = wandb.Artifact(name = "", type = "")
artifact.add_file(local_path = "", name="")
# artifact를 run의 출력으로 로그
run.log_artifact(artifact_or_path = artifact)
```
## Artifact cluster
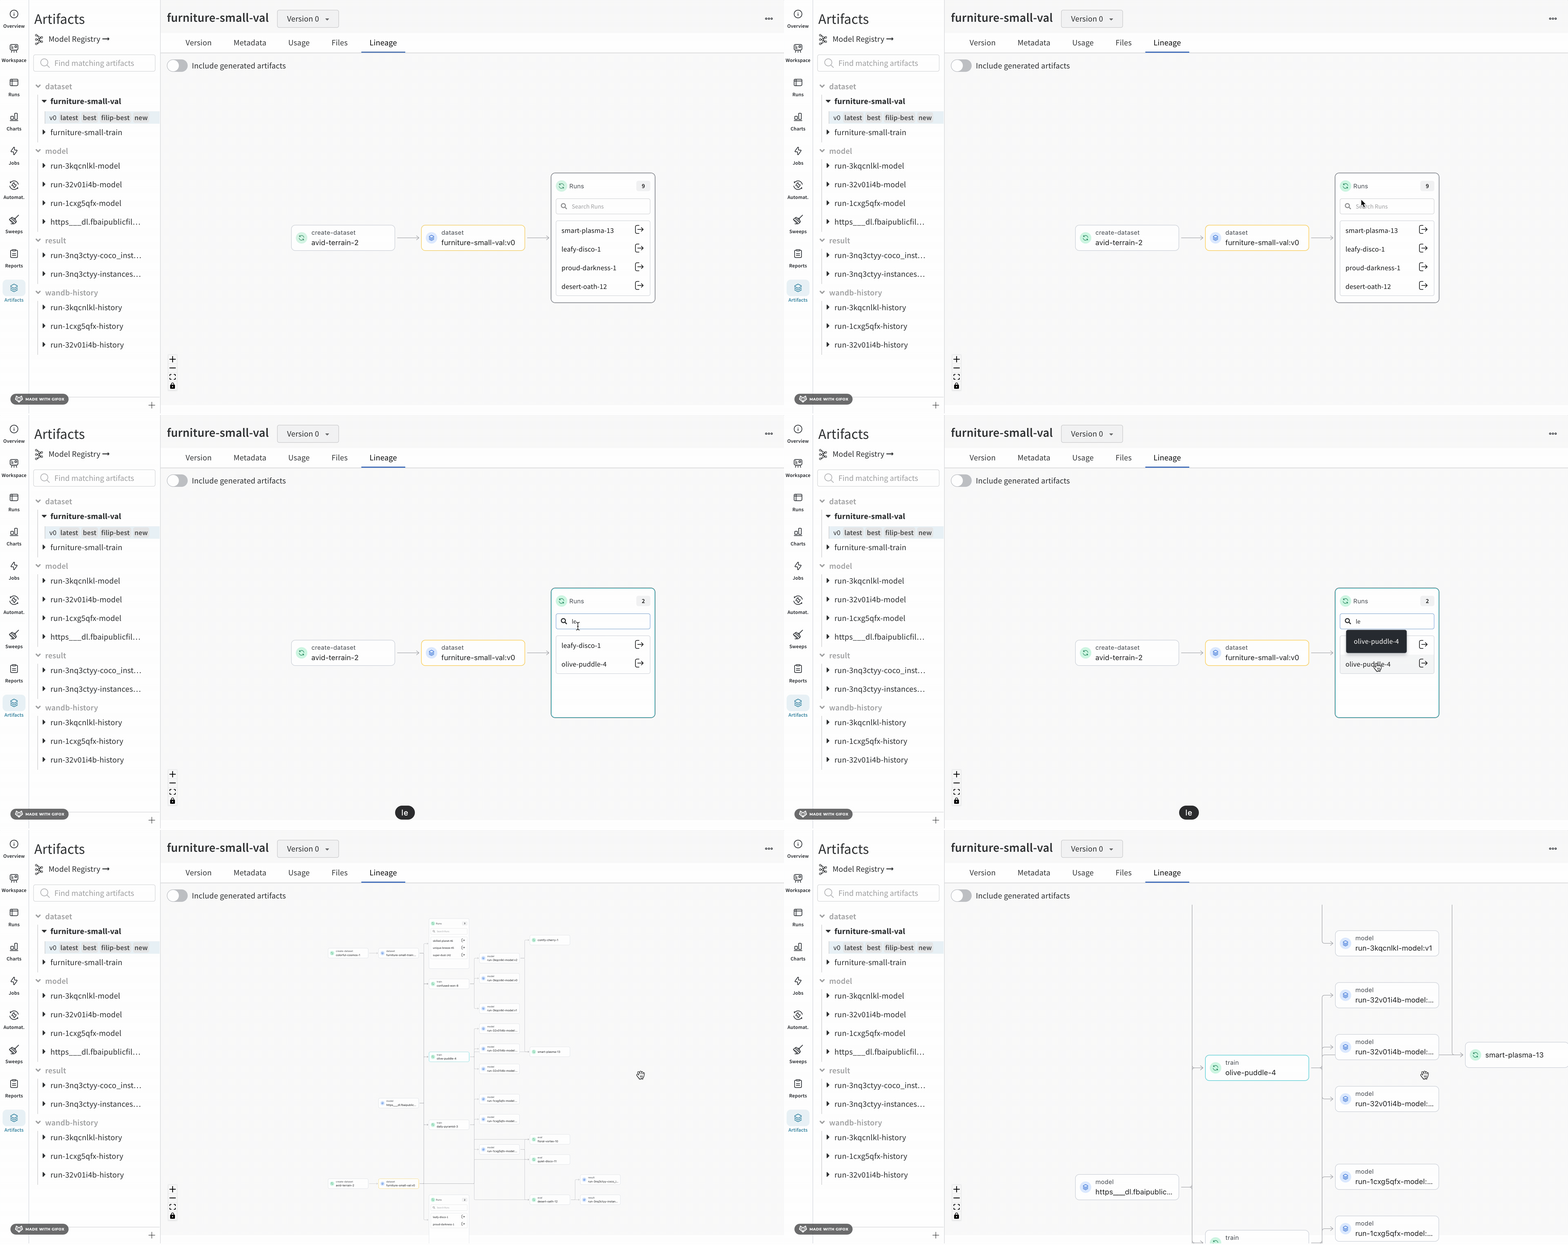
그래프의 한 레벨에 run 또는 artifact가 5개 이상 있으면 cluster가 생성됩니다. cluster에는 run 또는 artifact의 특정 버전을 검색할 수 있는 검색창이 있으며, 개별 노드를 cluster에서 꺼내 cluster 내부 노드의 리니지를 계속 추적할 수 있습니다.
노드를 클릭하면 노드의 Overview가 포함된 미리보기가 열립니다. 화살표를 클릭하면 개별 run 또는 artifact가 추출되며, 이렇게 추출한 노드의 리니지를 확인할 수 있습니다.