> ## Documentation Index
> Fetch the complete documentation index at: https://docs.wandb.ai/llms.txt
> Use this file to discover all available pages before exploring further.
> 이미지 분류, 오디오, 텍스트 분석 및 기타 사용 사례를 위한 예제 W&B 테이블 프로젝트를 살펴보세요.
# 예제 테이블
다음 섹션에서는 테이블를 활용하는 몇 가지 방법을 소개합니다:
### 데이터 보기
모델 트레이닝이나 평가 중에 메트릭과 리치 미디어를 로그하고, 클라우드 또는 사용 중인 [호스팅 인스턴스](/ko/platform/hosting)와 동기화되는 영구 데이터베이스에서 결과를 시각화하세요.
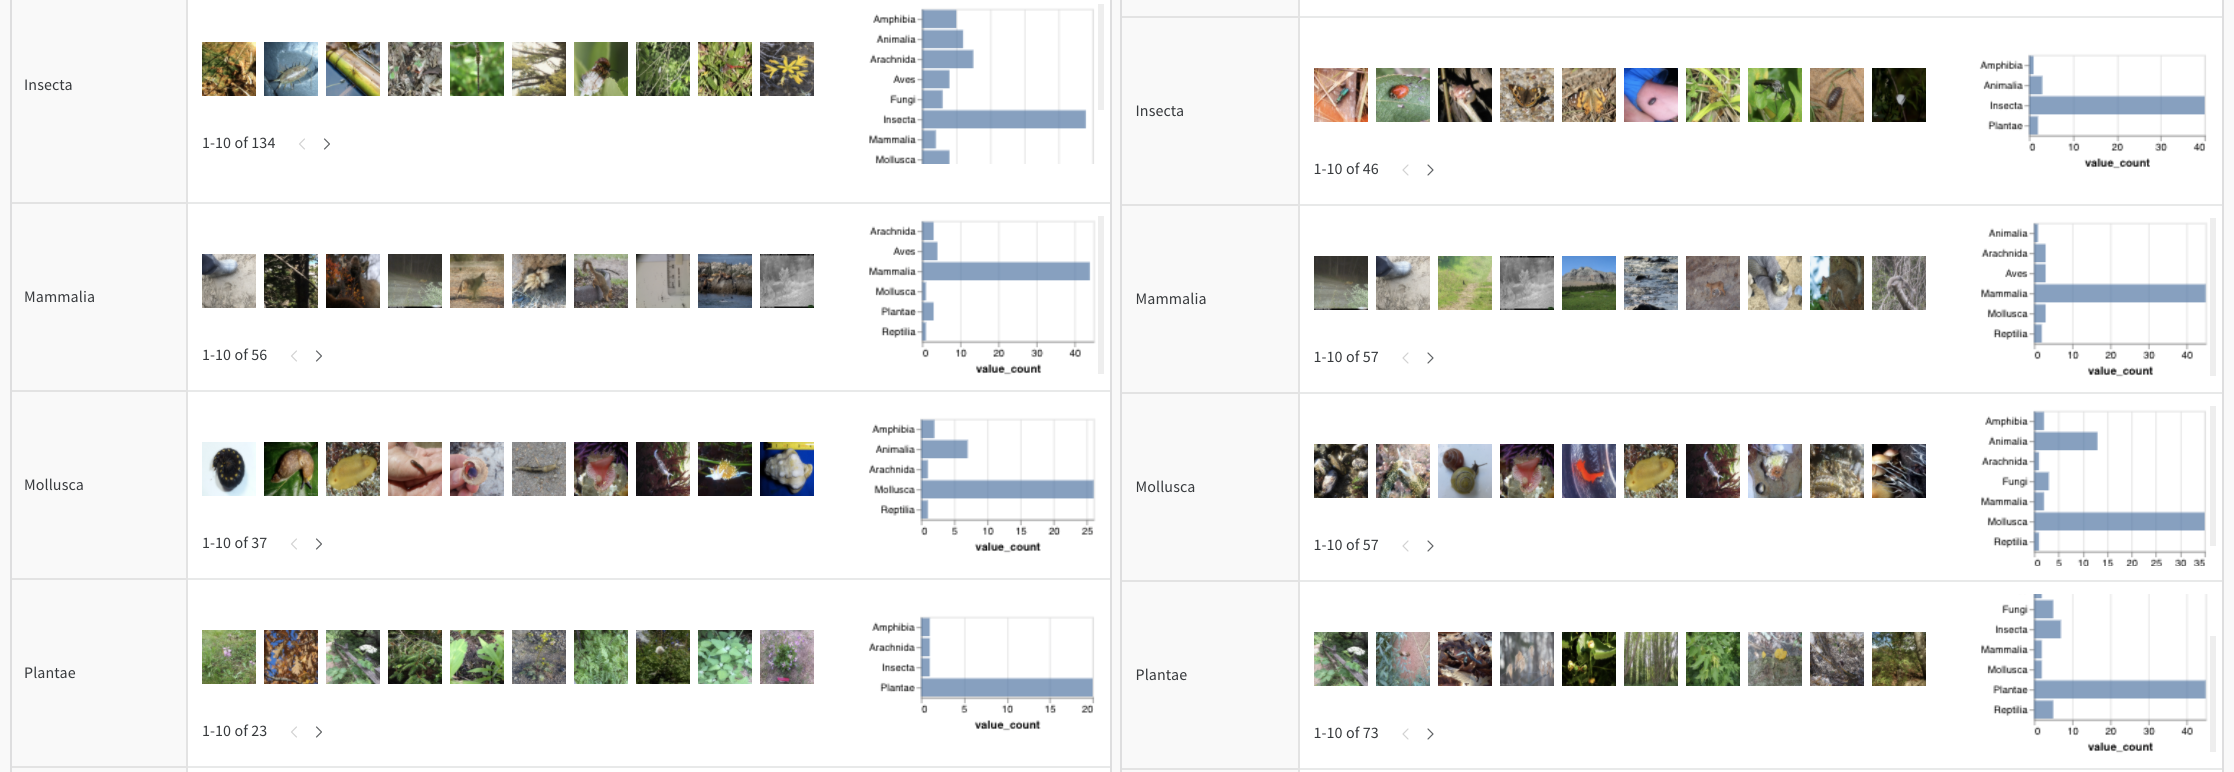
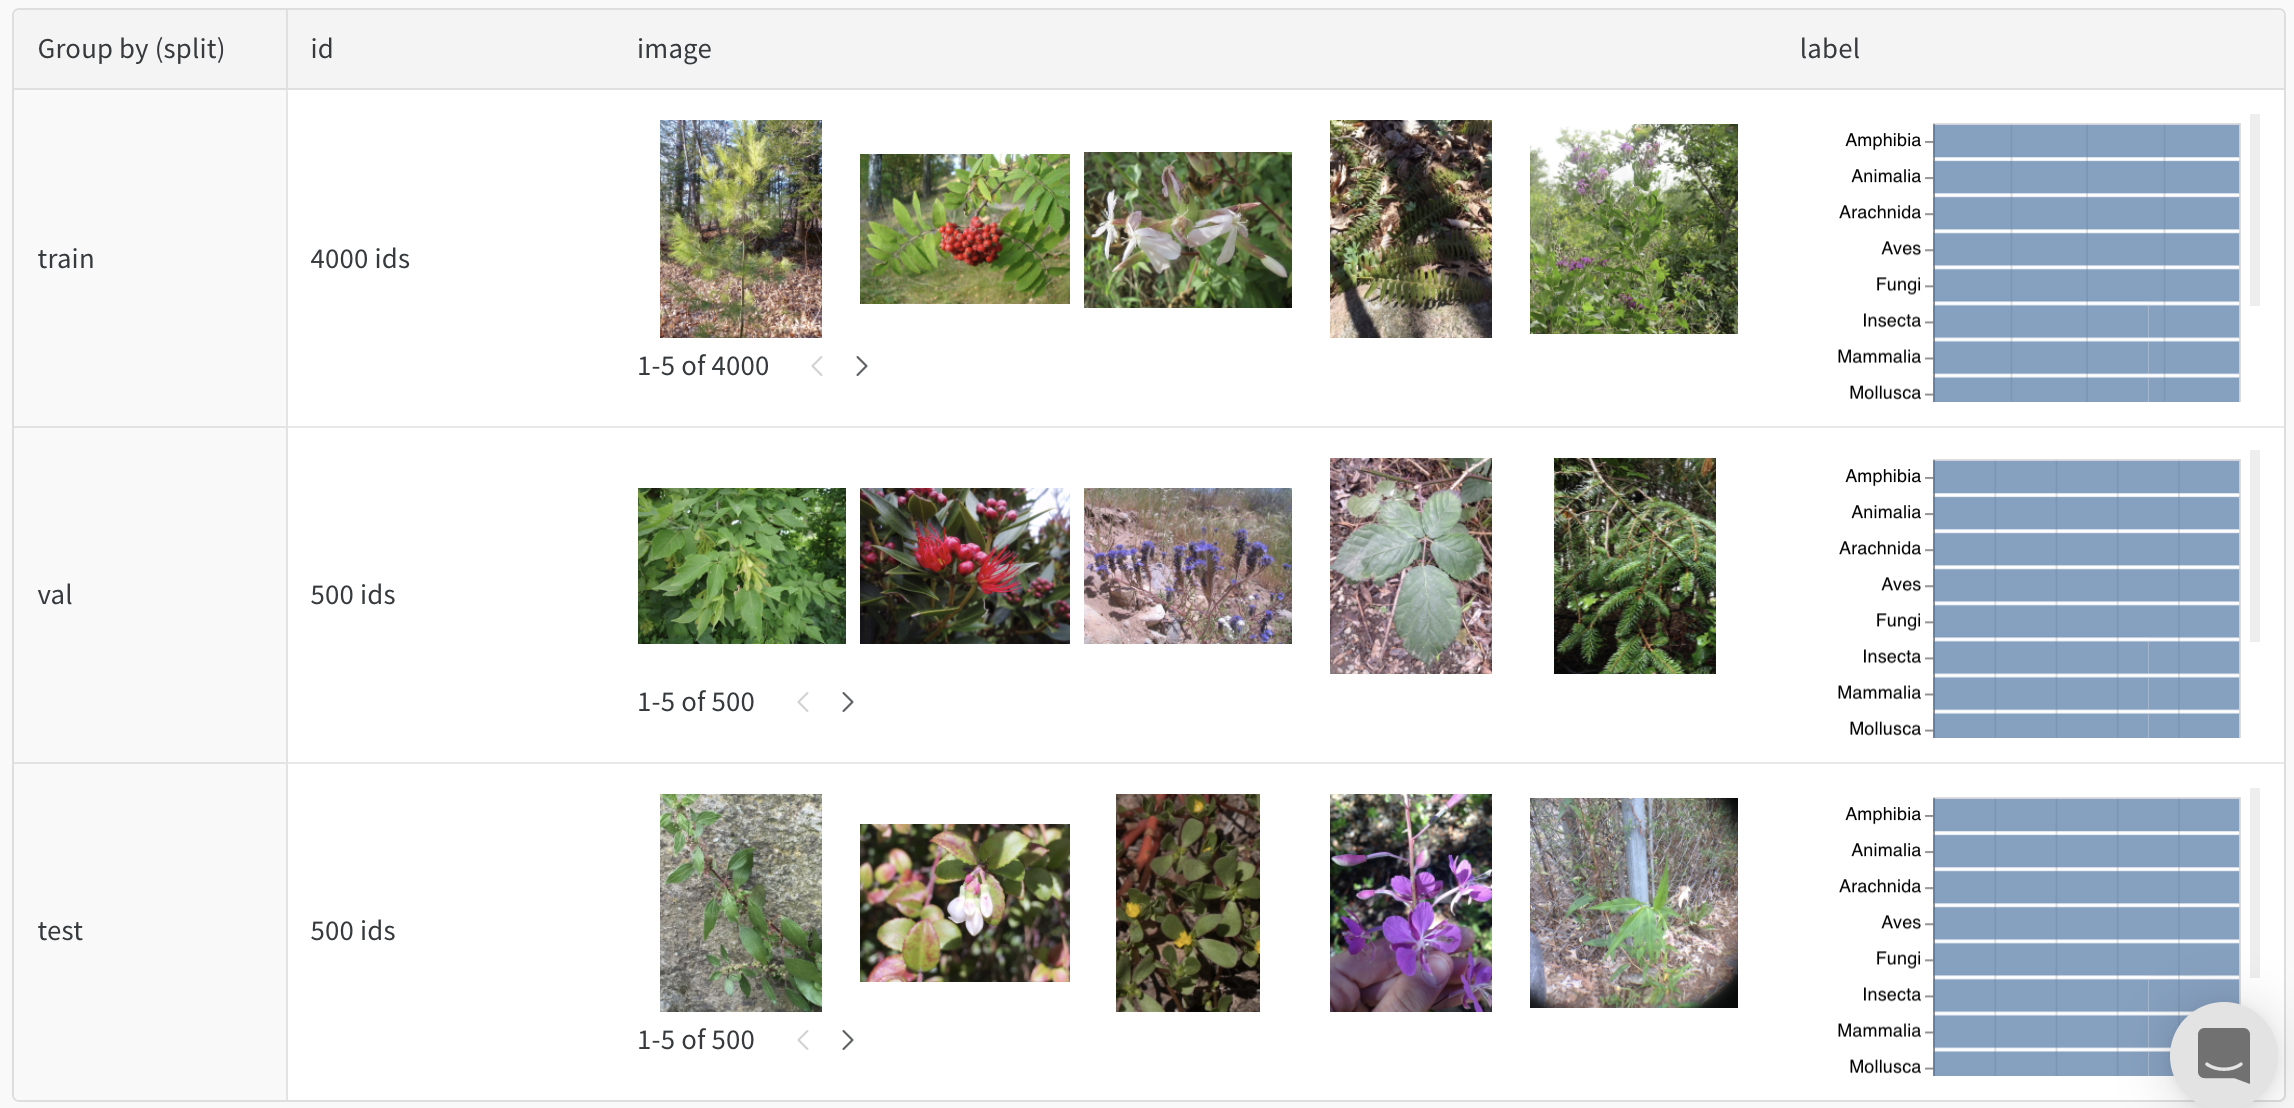 예를 들어, [사진 데이터셋의 균형 잡힌 분할](https://wandb.ai/stacey/mendeleev/artifacts/balanced_data/inat_80-10-10_5K/ab79f01e007113280018/files/data_split.table.json)을 보여주는 다음 테이블을 확인해 보세요.
### 데이터를 대화형으로 탐색하세요
테이블을 보고, 정렬하고, 필터링하고, 그룹화하고, 조인하고, 쿼리해 데이터와 모델 성능을 파악하세요. 정적 파일을 일일이 찾아보거나 분석 스크립트를 다시 실행할 필요가 없습니다.
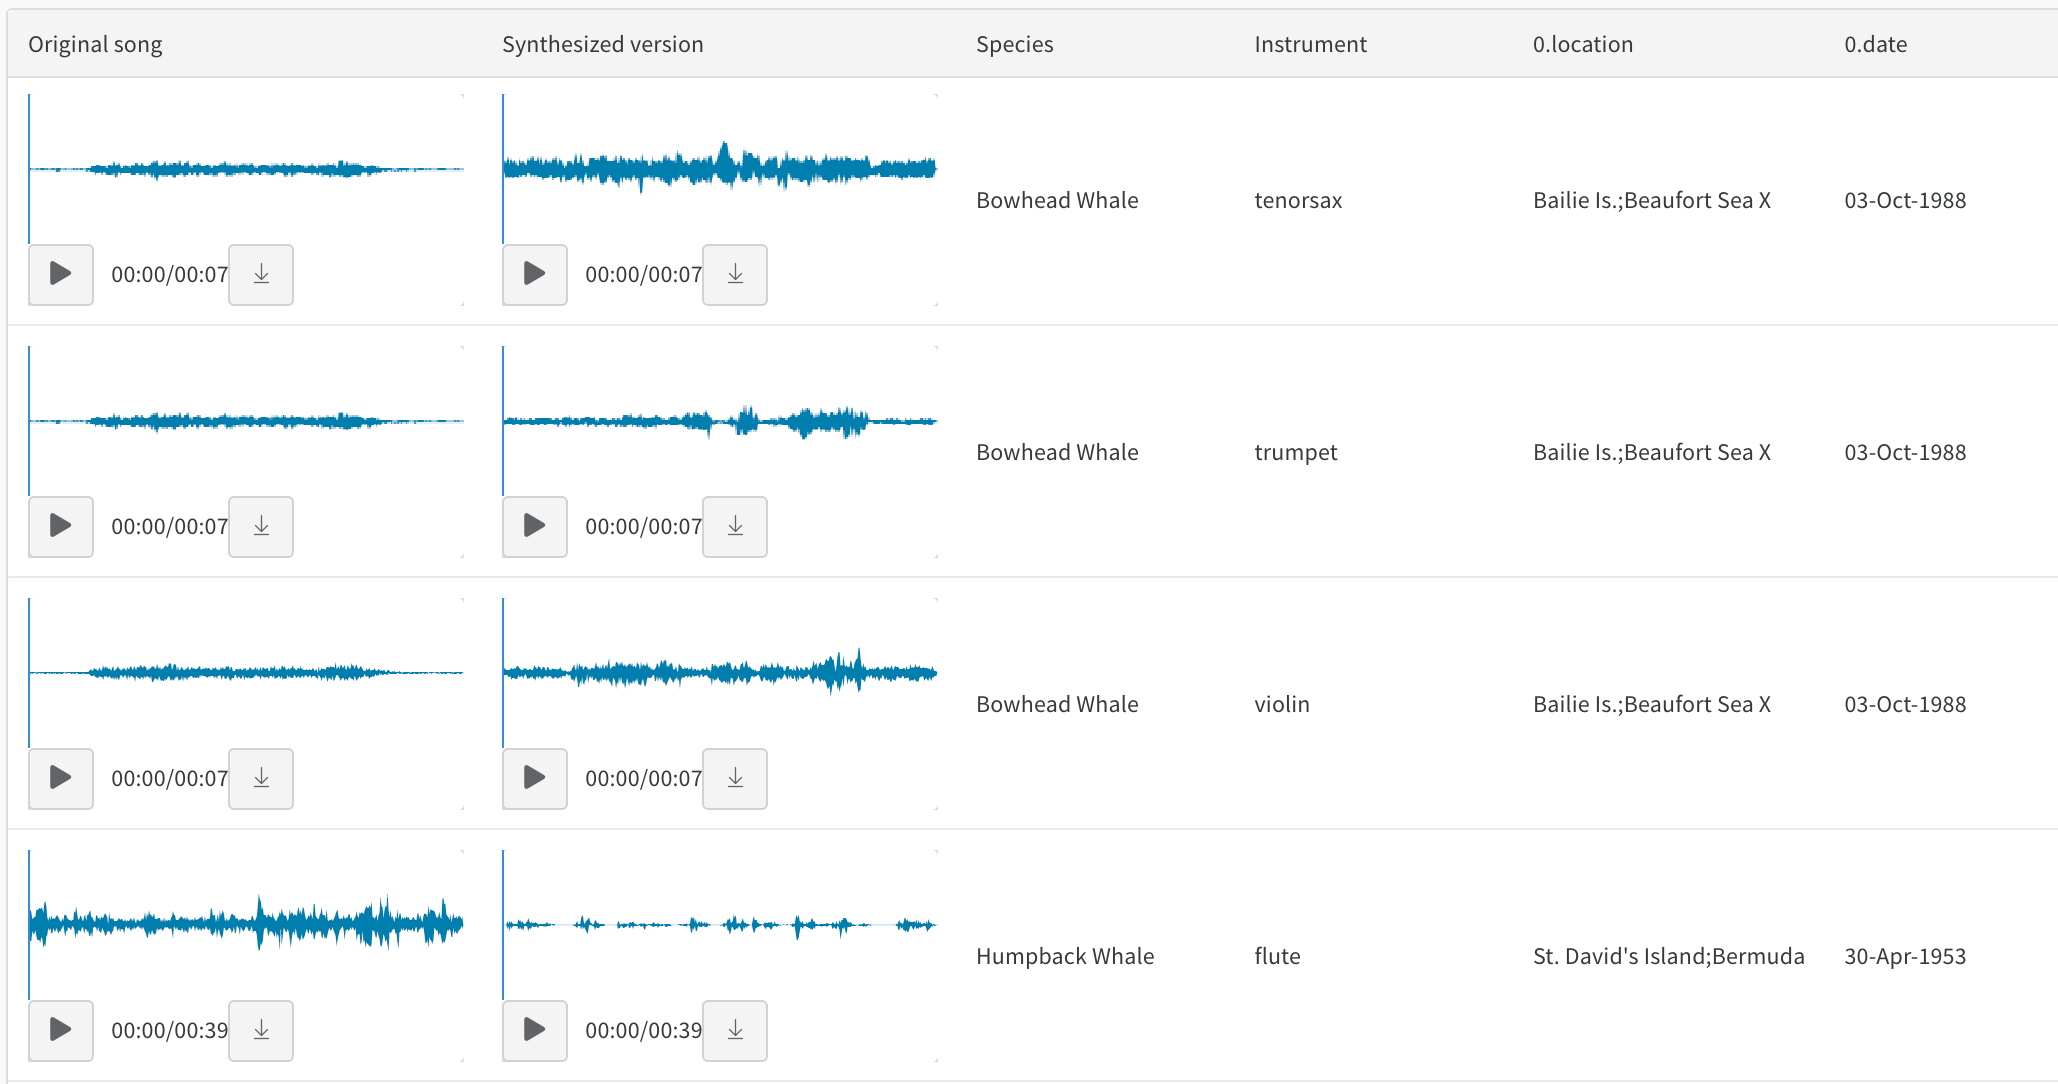 예를 들어, [스타일 전이 오디오](https://wandb.ai/stacey/cshanty/reports/Whale2Song-W-B-Tables-for-Audio--Vmlldzo4NDI3NzM)에 관한 이 리포트를 확인해 보세요.
### 모델 버전 비교
서로 다른 트레이닝 에포크, 데이터셋, 하이퍼파라미터 설정, 모델 아키텍처 등의 결과를 빠르게 비교하세요.
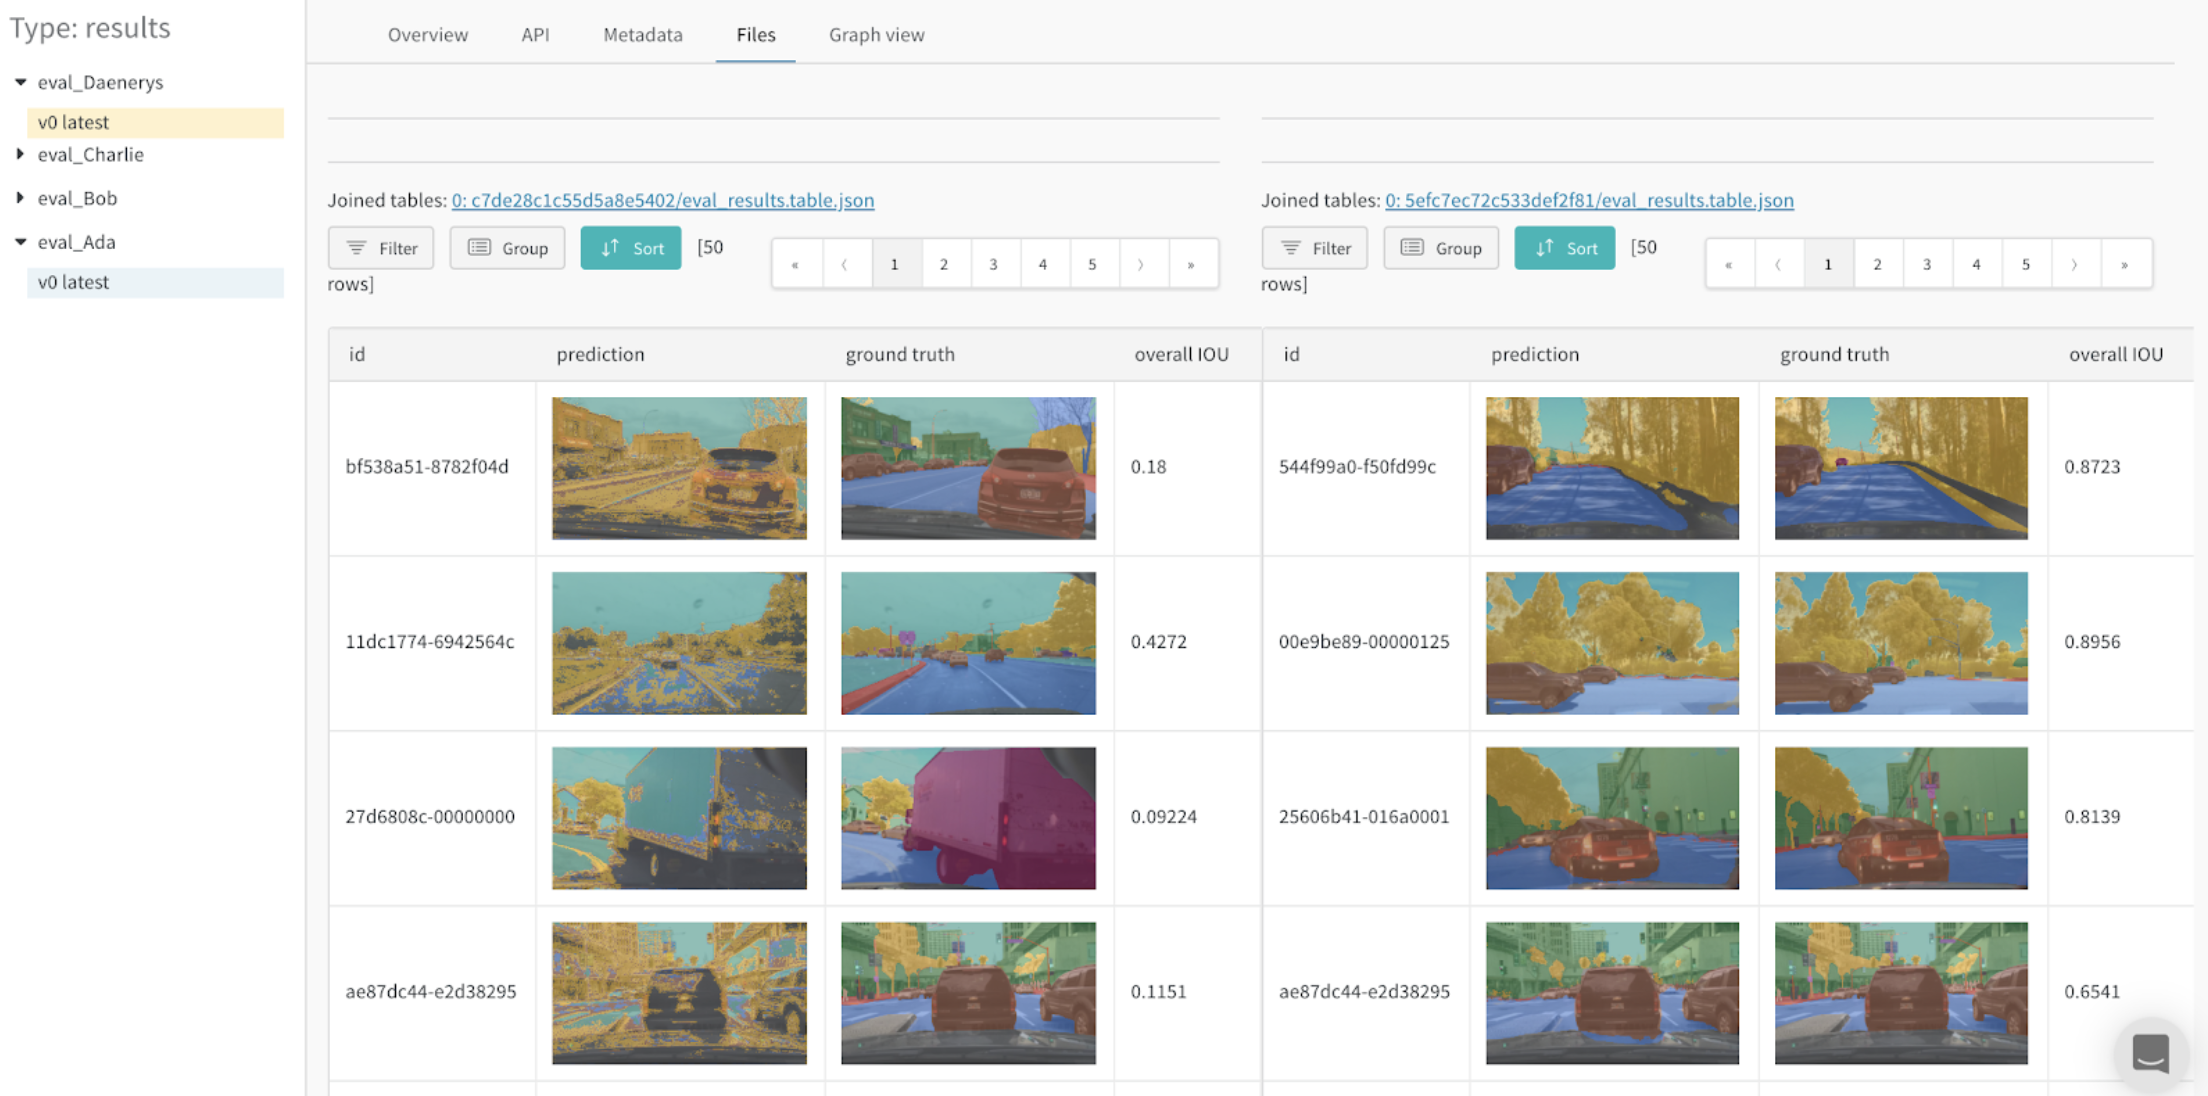
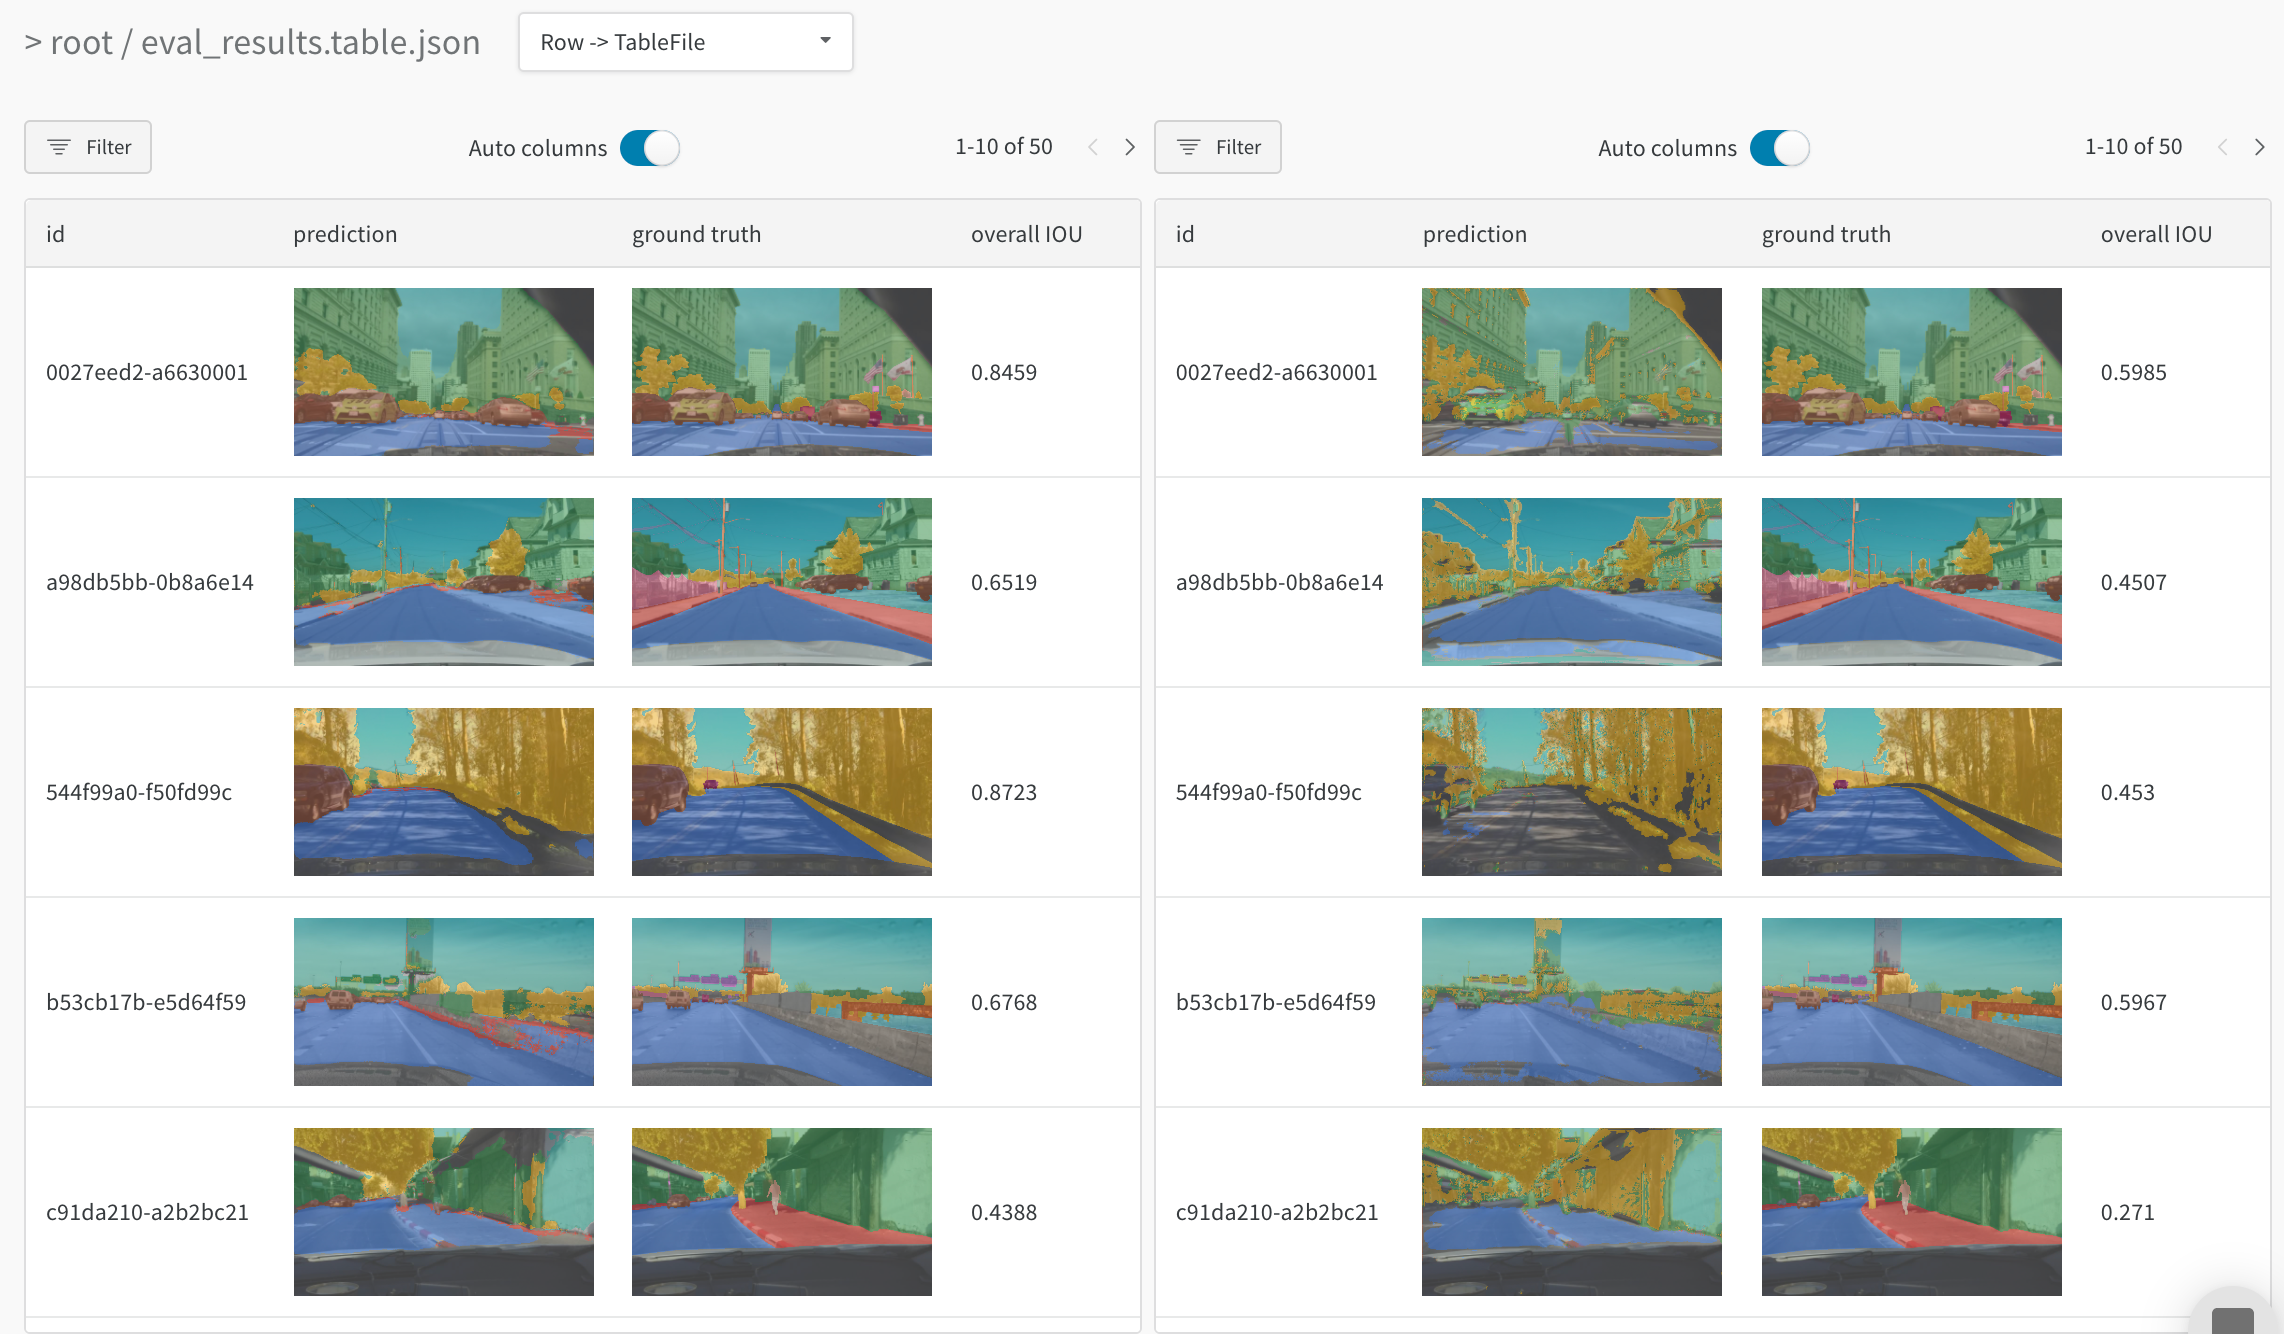 예를 들어, [동일한 테스트 이미지에서 두 모델을 비교한](https://wandb.ai/stacey/evalserver_answers_2/artifacts/results/eval_Daenerys/c2290abd3d7274f00ad8/files/eval_results.table.json#b6dae62d4f00d31eeebf\$eval_Bob) 이 테이블을 참조하세요.
### 모든 세부 정보를 추적하고 큰 그림을 확인하세요
특정 step의 특정 예측을 시각화하려면 확대하세요. 축소하면 집계 통계를 확인하고, 오류 패턴을 파악하며, 개선 기회를 이해할 수 있습니다. 이 도구는 단일 모델 트레이닝의 step을 비교하거나, 서로 다른 모델 버전의 결과를 비교할 때 사용할 수 있습니다.
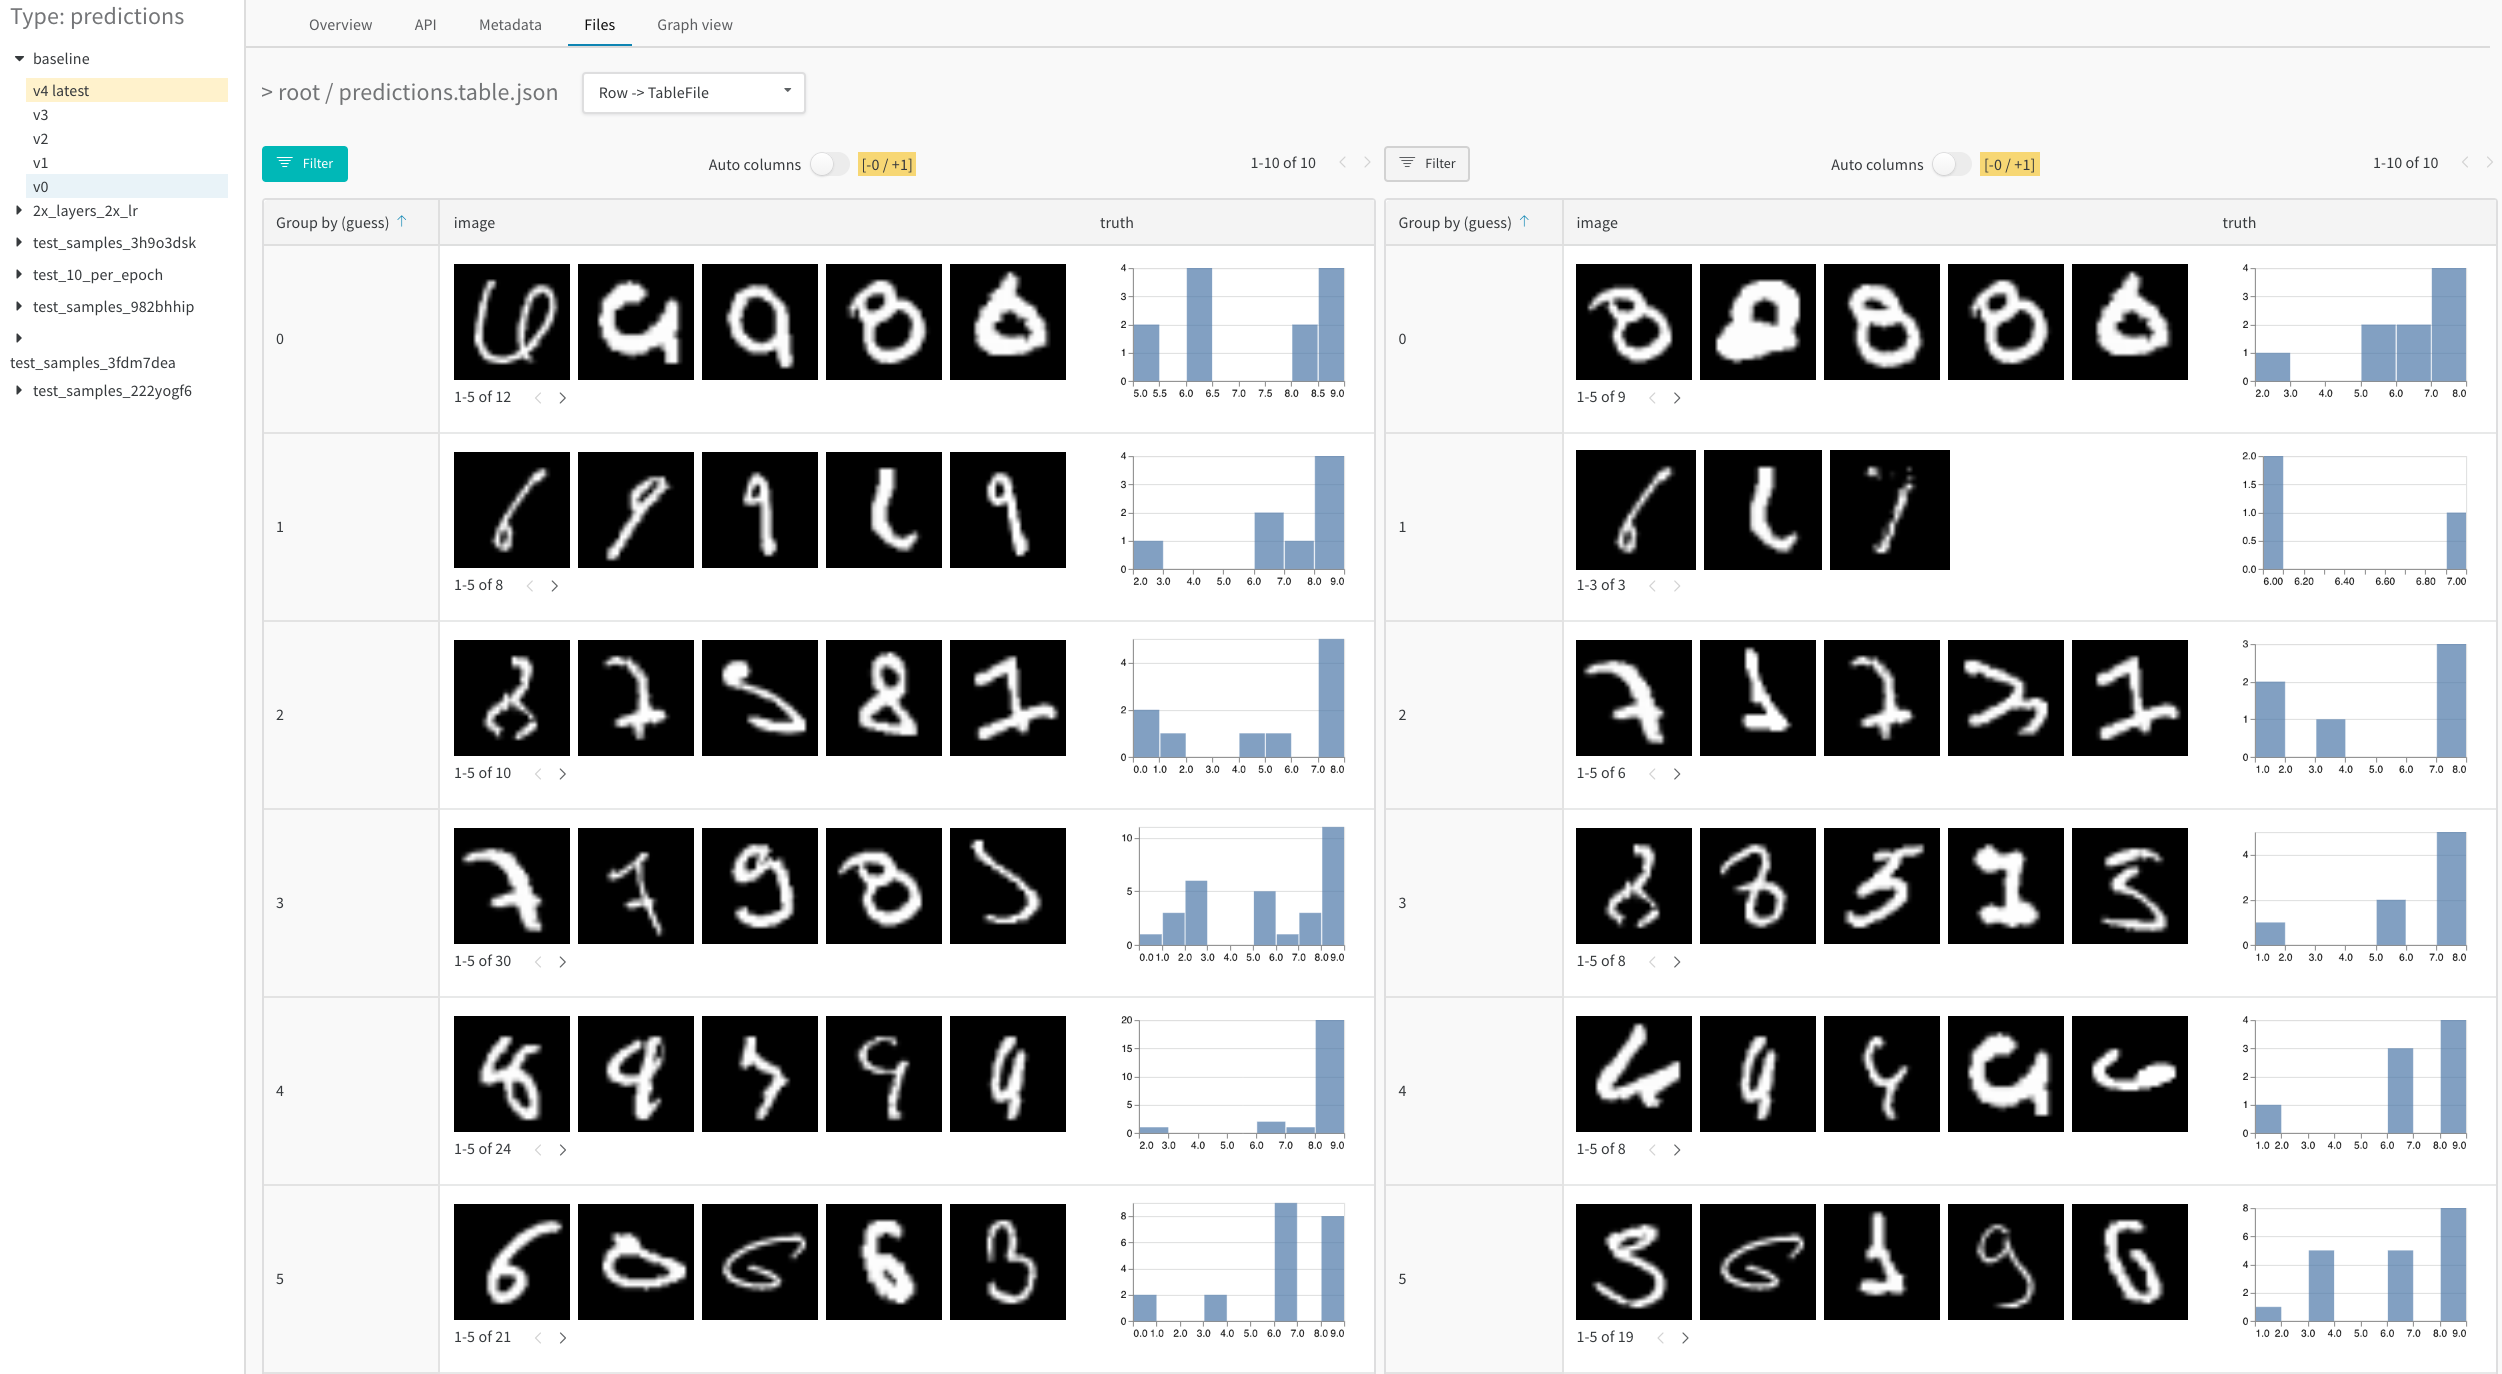 예를 들어, [MNIST 데이터셋에서 1에포크 후와 5에포크 후의 결과를 분석한 이 예제 테이블](https://wandb.ai/stacey/mnist-viz/artifacts/predictions/baseline/d888bc05719667811b23/files/predictions.table.json#7dd0cd845c0edb469dec)을 참조하세요.
## W\&B 테이블를 사용하는 예시 프로젝트
다음은 W\&B 테이블를 사용하는 실제 W\&B 프로젝트 몇 가지입니다.
### 이미지 분류
[이미지 분류를 위한 데이터 시각화](https://wandb.ai/stacey/mendeleev/reports/Visualize-Data-for-Image-Classification--VmlldzozNjE3NjA)를 읽고, [data visualization nature Colab](https://wandb.me/dsviz-nature-colab)을 따라 하거나, [artifacts context](https://wandb.ai/stacey/mendeleev/artifacts/val_epoch_preds/val_pred_gawf9z8j/2dcee8fa22863317472b/files/val_epoch_res.table.json)를 살펴보며 CNN이 [iNaturalist](https://www.inaturalist.org/pages/developers) 사진에서 10가지 생물 유형(식물, 새, 곤충 등)을 식별하는 방식을 확인해 보세요.
### 오디오
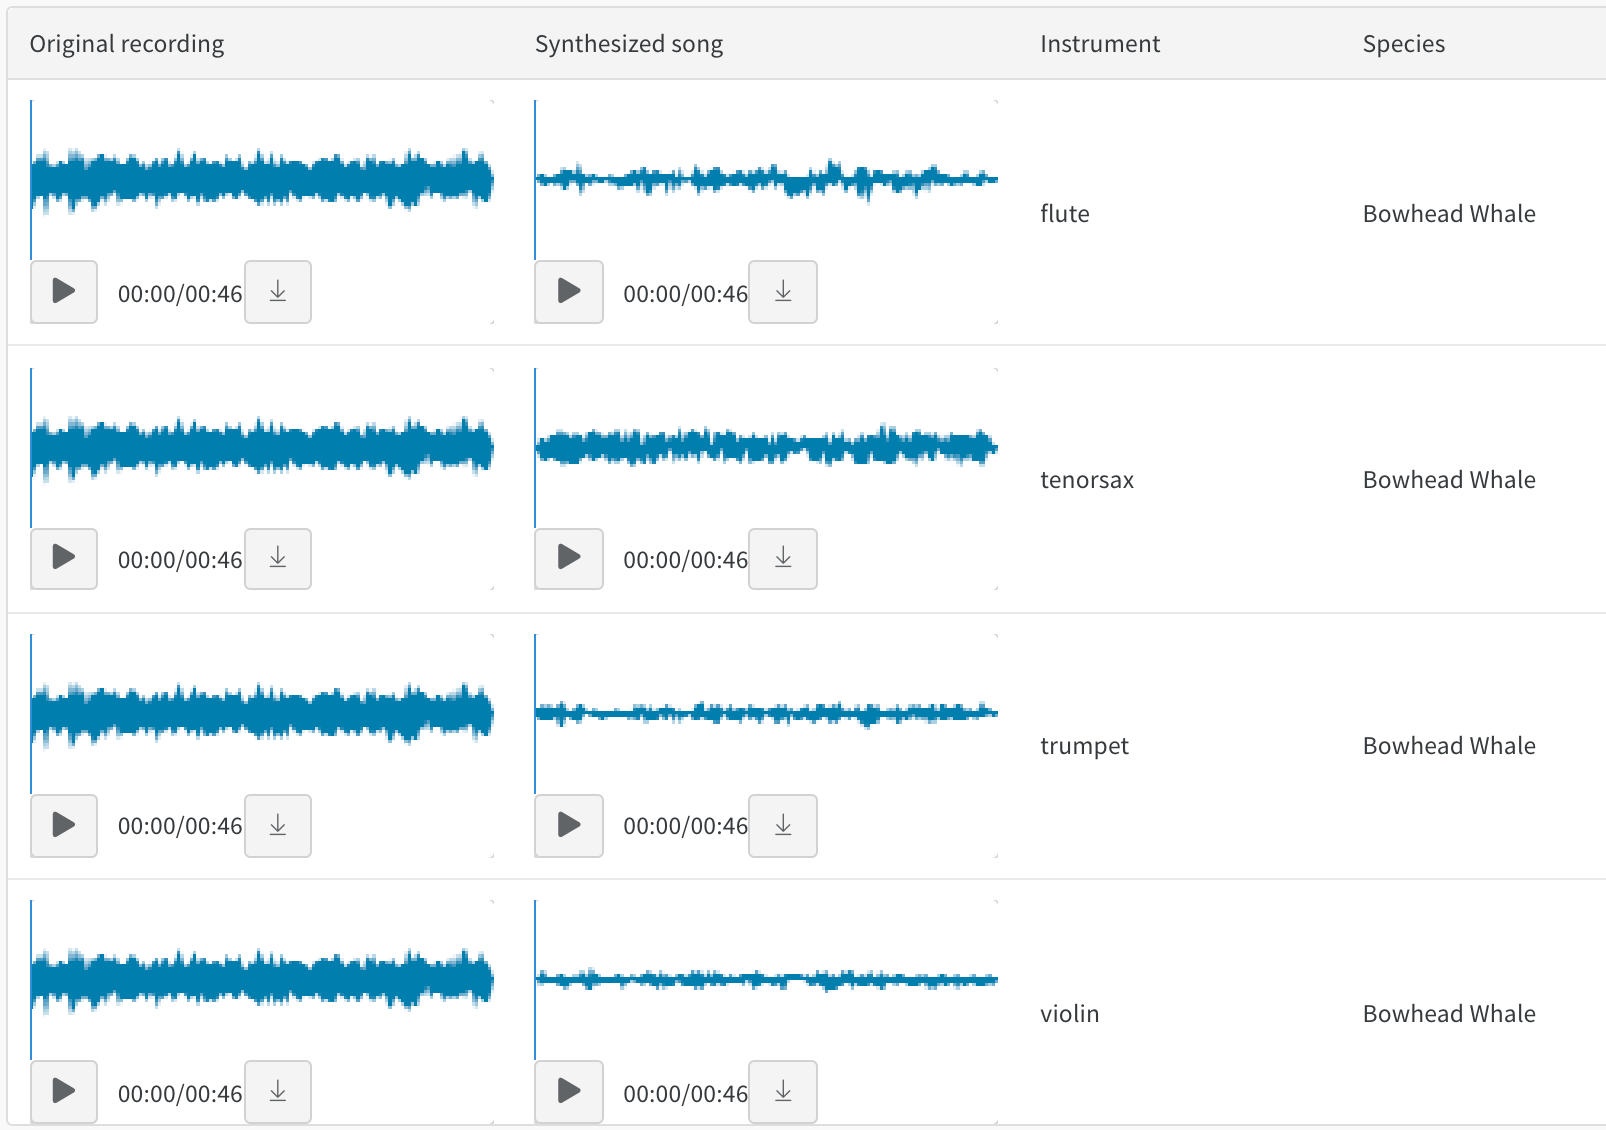
음색 전이를 다루는 [Whale2Song - 오디오용 W\&B Tables](https://wandb.ai/stacey/cshanty/reports/Whale2Song-W-B-Tables-for-Audio--Vmlldzo4NDI3NzM)에서 오디오 테이블을 살펴보세요. 녹음된 고래 노래와, 같은 멜로디를 바이올린이나 트럼펫 같은 악기로 합성한 버전을 비교할 수 있습니다. [audio transfer Colab](http://wandb.me/audio-transfer)을 사용하면 직접 노래를 녹음하고 W\&B에서 그 합성 버전도 탐색할 수 있습니다.
### 텍스트
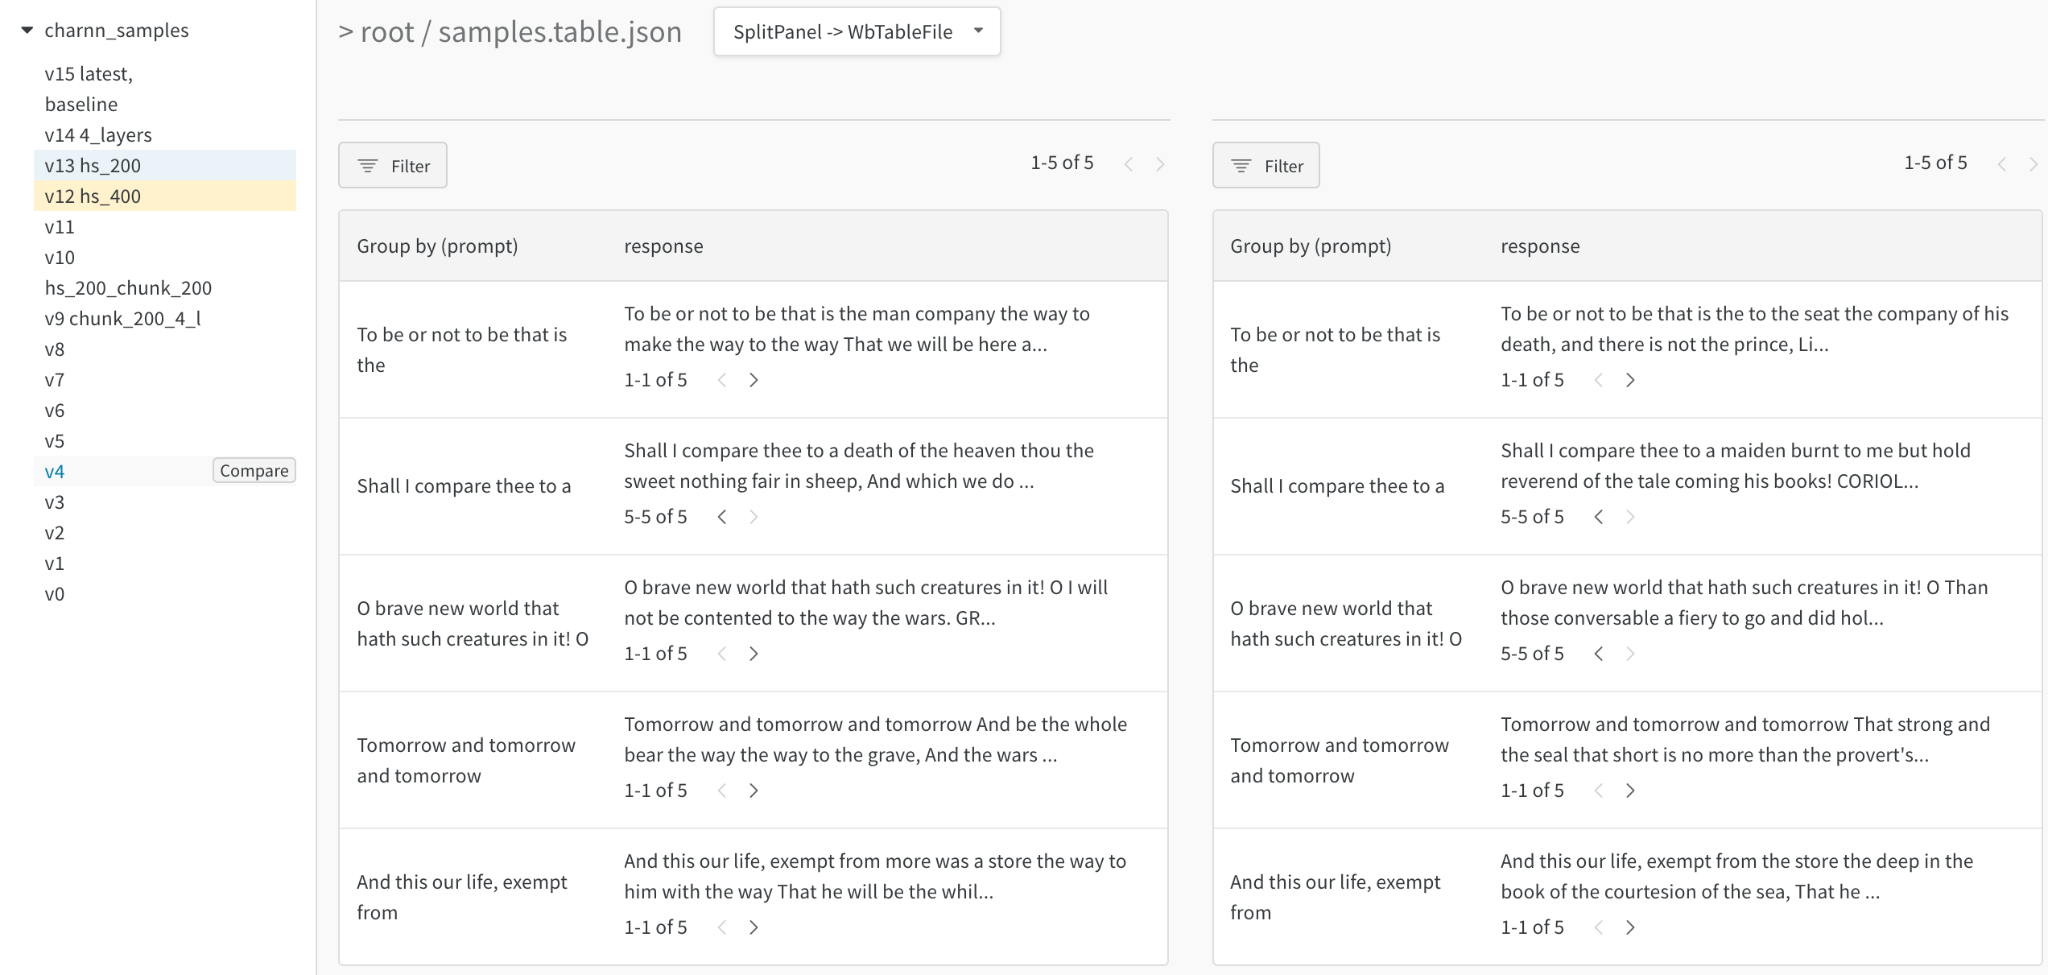
트레이닝 데이터나 생성된 출력에서 텍스트 샘플을 살펴보고, 관련 필드별로 동적으로 그룹화하며, 모델 변형이나 실험 설정 전반에 걸쳐 평가를 맞춰 비교하세요. 텍스트를 Markdown으로 렌더링하거나 시각적 diff 모드를 사용해 텍스트를 비교할 수 있습니다. 문자 기반 RNN의 예시는 [Shakespeare 텍스트 생성 리포트](https://wandb.ai/stacey/nlg/reports/Visualize-Text-Data-Predictions--Vmlldzo1NzcwNzY)를 참조하세요.
### 비디오
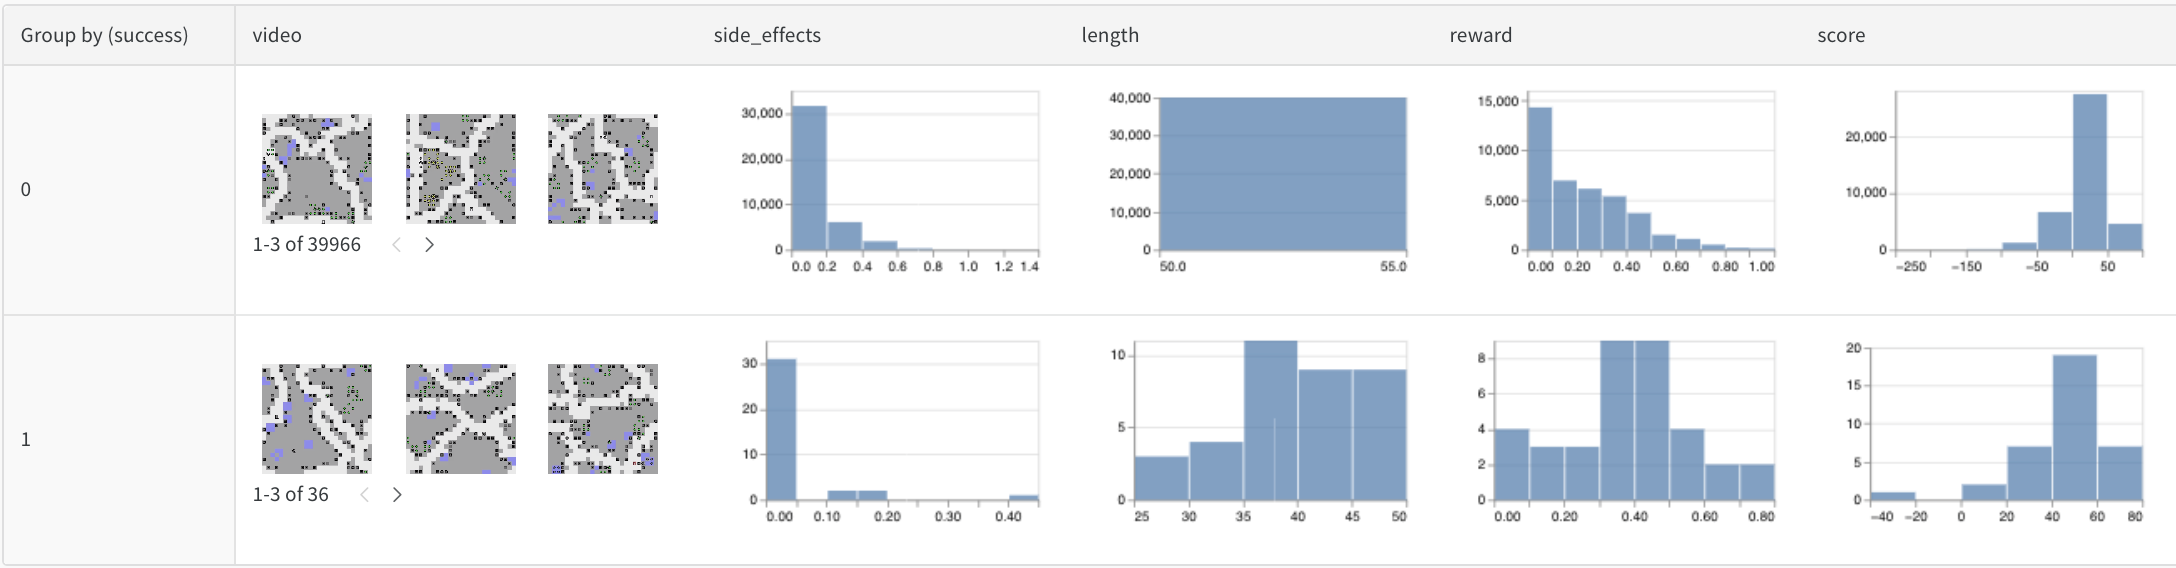
트레이닝 중에 로깅된 비디오를 탐색하고 모아 보면서 모델을 더 잘 이해할 수 있습니다. 다음은 [SafeLife benchmark](https://wandb.ai/safelife/v1dot2/benchmark)를 사용해 부작용을 [최소화하려는 에이전트](https://wandb.ai/stacey/saferlife/artifacts/video/videos_append-spawn/c1f92c6e27fa0725c154/files/video_examples.table.json)를 보여 주는 초기 예시입니다.
### 표 형식 데이터
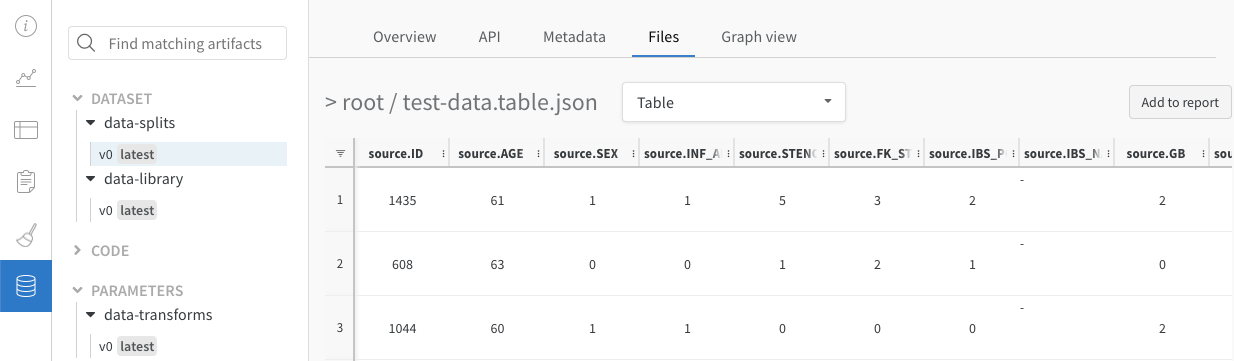
버전 관리와 중복 제거를 활용해 [표 형식 데이터를 분할하고 전처리하는 방법](https://wandb.ai/dpaiton/splitting-tabular-data/reports/Tabular-Data-Versioning-and-Deduplication-with-Weights-Biases--VmlldzoxNDIzOTA1)을 다룬 리포트를 확인하세요.
### 모델 변형 비교(시맨틱 세그멘테이션)
시맨틱 세그멘테이션에서 테이블를 로깅하고 여러 모델을 비교하는 [대화형 노트북](https://wandb.me/dsviz-cars-demo)과 [실시간 예시](https://wandb.ai/stacey/evalserver_answers_2/artifacts/results/eval_Daenerys/c2290abd3d7274f00ad8/files/eval_results.table.json#a57f8e412329727038c2\$eval_Ada)입니다. [이 테이블](https://wandb.ai/stacey/evalserver_answers_2/artifacts/results/eval_Daenerys/c2290abd3d7274f00ad8/files/eval_results.table.json)에서 직접 쿼리해 보세요.
### 트레이닝 시간 경과에 따른 개선 분석
시간 경과에 따른 [예측 시각화](https://wandb.ai/stacey/mnist-viz/reports/Visualize-Predictions-over-Time--Vmlldzo1OTQxMTk) 방법과 관련 [대화형 노트북](https://wandb.me/dsviz-mnist-colab)을 자세히 설명한 리포트입니다.