> ## Documentation Index
> Fetch the complete documentation index at: https://docs.wandb.ai/llms.txt
> Use this file to discover all available pages before exploring further.
# 멀티 에이전트 구조화된 출력
> W&B Weave에서 멀티 에이전트 구조화된 출력을 사용하는 방법을 알아보세요
이 문서는 대화형 노트북입니다. 로컬에서 실행하거나 다음 링크를 사용할 수 있습니다.
* [Google Colab에서 열기](https://colab.research.google.com/github/wandb/docs/blob/main/weave/cookbooks/source/multi-agent-structured-output.ipynb)
* [GitHub에서 소스 보기](https://github.com/wandb/docs/blob/main/weave/cookbooks/source/multi-agent-structured-output.ipynb)
이 튜토리얼에서는 OpenAI의 구조화된 출력 기능을 사용하는 멀티 에이전트 시스템을 구축하는 방법과 [Weave](/ko/weave)로 에이전트 간 상호작용을 트레이스하는 방법을 설명합니다. 이 튜토리얼을 마치면 중간 입력과 출력이 Weave UI에 표시되는 4개 에이전트 데이터 분석 파이프라인을 만들 수 있습니다.
OpenAI는 강한 어조의 프롬프트 없이도 모델이 사용자가 제공한 JSON 스키마를 항상 준수하는 응답을 생성할 수 있도록 [Structured Outputs](https://openai.com/index/introducing-structured-outputs-in-the-api/)를 릴리스했습니다. Structured Outputs를 사용하면 형식이 올바르지 않은 응답에 대해 검증하거나 재시도할 필요가 없습니다.
매개변수 `strict: true`를 사용하면 응답이 제공된 스키마를 준수하도록 보장할 수 있습니다.
멀티 에이전트 시스템에서 구조화된 출력은 에이전트 간에 일관되고 예측 가능하게 처리할 수 있는 데이터를 생성합니다. 또한 명시적인 거부를 지원하며, 재시도나 응답 검증이 필요하지 않습니다.
**Source**: 이 쿡북은 [OpenAI의 구조화된 출력 예시 코드](https://cookbook.openai.com/examples/structured_outputs_multi_agent)를 바탕으로 하며, Weave를 사용해 시각화를 개선할 수 있도록 일부 수정했습니다.
## 의존성 설치
먼저, 이 튜토리얼에 필요한 라이브러리를 설치합니다. 이 튜토리얼에는 다음 라이브러리가 필요합니다:
* 멀티 에이전트 시스템을 구축하기 위한 [OpenAI](https://openai.com/index/openai-api/)
* LLM 워크플로를 추적하고 프롬프프팅 전략을 평가하기 위한 [Weave](/ko/weave)
```python lines theme={null}
!pip install -qU openai weave wandb
python
%%capture
# openai의 버그를 수정하기 위한 임시 해결 방법:
# TypeError: Client.__init__() got an unexpected keyword argument 'proxies'
# 참고: https://community.openai.com/t/error-with-openai-1-56-0-client-init-got-an-unexpected-keyword-argument-proxies/1040332/15
!pip install "httpx<0.28"
```
다음으로, 자격 증명을 설정하고 Weave를 초기화하여 트레이스가 W\&B 프로젝트에 로깅되도록 합니다.
`wandb.login()`으로 로그인할 수 있도록 환경 변수에 `WANDB_API_KEY`를 설정합니다. 이 값은 Colab에 secret으로도 제공하세요.
로그를 기록할 W\&B 프로젝트를 `name_of_wandb_project`에 설정합니다.
`name_of_wandb_project`는 트레이스를 기록할 팀을 지정하기 위해 `[YOUR-TEAM]/[YOUR-PROJECT]` 형식으로도 지정할 수 있습니다.
그런 다음 `weave.init()`을 호출해 Weave 클라이언트를 가져옵니다.
이 튜토리얼에서는 [OpenAI API](https://openai.com/index/openai-api/)를 사용하므로 OpenAI API 키도 필요합니다. OpenAI 플랫폼에서 [가입](https://platform.openai.com/signup)하여 자신의 API 키를 받으세요. 이 값도 Colab에 secret으로도 제공하세요.
```python lines theme={null}
import base64
import json
import os
from io import BytesIO, StringIO
import matplotlib.pyplot as plt
import numpy as np
import pandas as pd
import wandb
from google.colab import userdata
from openai import OpenAI
import weave
python
os.environ["WANDB_API_KEY"] = userdata.get("WANDB_API_KEY")
os.environ["OPENAI_API_KEY"] = userdata.get("OPENAI_API_KEY")
wandb.login()
name_of_wandb_project = "multi-agent-structured-output"
weave.init(name_of_wandb_project)
client = OpenAI()
MODEL = "gpt-4o-2024-08-06"
```
## 에이전트 설정
Weave를 초기화했으면 시스템을 구성하는 에이전트를 정의합니다. 이 튜토리얼의 사용 사례는 데이터 분석 작업입니다.
먼저 4개의 에이전트로 구성된 시스템을 설정하세요:
* 트리아지 에이전트: 어떤 에이전트를 호출할지 결정합니다.
* 데이터 전처리 에이전트: 예를 들어 데이터를 정리해 분석용으로 준비합니다.
* 데이터 분석 에이전트: 데이터를 분석합니다.
* 데이터 시각화 에이전트: 분석의 출력을 시각화해 인사이트를 도출합니다.
먼저 각 에이전트의 system 프롬프트를 정의하세요. 이 프롬프트는 각 에이전트의 역할과 호출할 수 있는 도구를 지정합니다.
```python lines theme={null}
triaging_system_prompt = """You are a Triaging Agent. Your role is to assess the user's query and route it to the relevant agents. The agents available are:
- Data Processing Agent: Cleans, transforms, and aggregates data.
- Analysis Agent: Performs statistical, correlation, and regression analysis.
- Visualization Agent: Creates bar charts, line charts, and pie charts.
Use the send_query_to_agents tool to forward the user's query to the relevant agents. Also, use the speak_to_user tool to get more information from the user if needed."""
processing_system_prompt = """You are a Data Processing Agent. Your role is to clean, transform, and aggregate data using the following tools:
- clean_data
- transform_data
- aggregate_data"""
analysis_system_prompt = """You are an Analysis Agent. Your role is to perform statistical, correlation, and regression analysis using the following tools:
- stat_analysis
- correlation_analysis
- regression_analysis"""
visualization_system_prompt = """You are a Visualization Agent. Your role is to create bar charts, line charts, and pie charts using the following tools:
- create_bar_chart
- create_line_chart
- create_pie_chart"""
```
다음으로, 각 에이전트에 사용할 도구를 정의하세요.
트리아지 에이전트를 제외한 각 에이전트에는 역할에 맞는 전용 도구가 있습니다:
**데이터 전처리 에이전트**: 데이터 정리, 데이터 변환, 데이터 집계.
**데이터 분석 에이전트**: 통계 분석, 상관관계 분석, 회귀 분석.
**데이터 시각화 에이전트**: 막대 차트 생성, 선 차트 생성, 원형 차트 생성.
```python lines theme={null}
triage_tools = [
{
"type": "function",
"function": {
"name": "send_query_to_agents",
"description": "Sends the user query to relevant agents based on their capabilities.",
"parameters": {
"type": "object",
"properties": {
"agents": {
"type": "array",
"items": {"type": "string"},
"description": "An array of agent names to send the query to.",
},
"query": {
"type": "string",
"description": "The user query to send.",
},
},
"required": ["agents", "query"],
},
},
"strict": True,
}
]
preprocess_tools = [
{
"type": "function",
"function": {
"name": "clean_data",
"description": "Cleans the provided data by removing duplicates and handling missing values.",
"parameters": {
"type": "object",
"properties": {
"data": {
"type": "string",
"description": "The dataset to clean. Should be in a suitable format such as JSON or CSV.",
}
},
"required": ["data"],
"additionalProperties": False,
},
},
"strict": True,
},
{
"type": "function",
"function": {
"name": "transform_data",
"description": "Transforms data based on specified rules.",
"parameters": {
"type": "object",
"properties": {
"data": {
"type": "string",
"description": "The data to transform. Should be in a suitable format such as JSON or CSV.",
},
"rules": {
"type": "string",
"description": "Transformation rules to apply, specified in a structured format.",
},
},
"required": ["data", "rules"],
"additionalProperties": False,
},
},
"strict": True,
},
{
"type": "function",
"function": {
"name": "aggregate_data",
"description": "Aggregates data by specified columns and operations.",
"parameters": {
"type": "object",
"properties": {
"data": {
"type": "string",
"description": "The data to aggregate. Should be in a suitable format such as JSON or CSV.",
},
"group_by": {
"type": "array",
"items": {"type": "string"},
"description": "Columns to group by.",
},
"operations": {
"type": "string",
"description": "Aggregation operations to perform, specified in a structured format.",
},
},
"required": ["data", "group_by", "operations"],
"additionalProperties": False,
},
},
"strict": True,
},
]
analysis_tools = [
{
"type": "function",
"function": {
"name": "stat_analysis",
"description": "Performs statistical analysis on the given dataset.",
"parameters": {
"type": "object",
"properties": {
"data": {
"type": "string",
"description": "The dataset to analyze. Should be in a suitable format such as JSON or CSV.",
}
},
"required": ["data"],
"additionalProperties": False,
},
},
"strict": True,
},
{
"type": "function",
"function": {
"name": "correlation_analysis",
"description": "Calculates correlation coefficients between variables in the dataset.",
"parameters": {
"type": "object",
"properties": {
"data": {
"type": "string",
"description": "The dataset to analyze. Should be in a suitable format such as JSON or CSV.",
},
"variables": {
"type": "array",
"items": {"type": "string"},
"description": "List of variables to calculate correlations for.",
},
},
"required": ["data", "variables"],
"additionalProperties": False,
},
},
"strict": True,
},
{
"type": "function",
"function": {
"name": "regression_analysis",
"description": "Performs regression analysis on the dataset.",
"parameters": {
"type": "object",
"properties": {
"data": {
"type": "string",
"description": "The dataset to analyze. Should be in a suitable format such as JSON or CSV.",
},
"dependent_var": {
"type": "string",
"description": "The dependent variable for regression.",
},
"independent_vars": {
"type": "array",
"items": {"type": "string"},
"description": "List of independent variables.",
},
},
"required": ["data", "dependent_var", "independent_vars"],
"additionalProperties": False,
},
},
"strict": True,
},
]
visualization_tools = [
{
"type": "function",
"function": {
"name": "create_bar_chart",
"description": "Creates a bar chart from the provided data.",
"parameters": {
"type": "object",
"properties": {
"data": {
"type": "string",
"description": "The data for the bar chart. Should be in a suitable format such as JSON or CSV.",
},
"x": {"type": "string", "description": "Column for the x-axis."},
"y": {"type": "string", "description": "Column for the y-axis."},
},
"required": ["data", "x", "y"],
"additionalProperties": False,
},
},
"strict": True,
},
{
"type": "function",
"function": {
"name": "create_line_chart",
"description": "Creates a line chart from the provided data.",
"parameters": {
"type": "object",
"properties": {
"data": {
"type": "string",
"description": "The data for the line chart. Should be in a suitable format such as JSON or CSV.",
},
"x": {"type": "string", "description": "Column for the x-axis."},
"y": {"type": "string", "description": "Column for the y-axis."},
},
"required": ["data", "x", "y"],
"additionalProperties": False,
},
},
"strict": True,
},
{
"type": "function",
"function": {
"name": "create_pie_chart",
"description": "Creates a pie chart from the provided data.",
"parameters": {
"type": "object",
"properties": {
"data": {
"type": "string",
"description": "The data for the pie chart. Should be in a suitable format such as JSON or CSV.",
},
"labels": {
"type": "string",
"description": "Column for the labels.",
},
"values": {
"type": "string",
"description": "Column for the values.",
},
},
"required": ["data", "labels", "values"],
"additionalProperties": False,
},
},
"strict": True,
},
]
```
## Weave로 멀티 에이전트 추적 활성화
에이전트와 해당 도구를 정의했으면, 다음 단계는 이를 서로 연결하고 Weave 트레이싱을 활성화하는 것입니다. 다음을 수행하는 코드 로직을 작성하세요:
* 사용자 쿼리를 멀티 에이전트 시스템에 전달합니다.
* 멀티 에이전트 시스템의 내부 동작을 처리합니다.
* 도구 Call을 실행합니다.
```python lines theme={null}
# 예시 쿼리
user_query = """
Below is some data. I want you to first remove the duplicates then analyze the statistics of the data as well as plot a line chart.
house_size (m3), house_price ($)
90, 100
80, 90
100, 120
90, 100
"""
```
사용자 쿼리를 보면 호출해야 할 도구가 `clean_data`, `start_analysis`, `use_line_chart`라는 것을 추론할 수 있습니다.
먼저 도구 Call을 실행하는 실행 함수를 정의하세요.
Python 함수에 `@weave.op()`를 데코레이터로 적용하면 언어 모델의 입력, 출력, 트레이스를 로깅하고 디버그할 수 있습니다.
멀티 에이전트 시스템에는 많은 함수가 포함되지만, 각 함수 위에 `@weave.op()`를 추가하는 것만으로 충분합니다.
```python lines theme={null}
@weave.op()
def clean_data(data):
data_io = StringIO(data)
df = pd.read_csv(data_io, sep=",")
df_deduplicated = df.drop_duplicates()
return df_deduplicated
@weave.op()
def stat_analysis(data):
data_io = StringIO(data)
df = pd.read_csv(data_io, sep=",")
return df.describe()
@weave.op()
def plot_line_chart(data):
data_io = StringIO(data)
df = pd.read_csv(data_io, sep=",")
x = df.iloc[:, 0]
y = df.iloc[:, 1]
coefficients = np.polyfit(x, y, 1)
polynomial = np.poly1d(coefficients)
y_fit = polynomial(x)
plt.figure(figsize=(10, 6))
plt.plot(x, y, "o", label="Data Points")
plt.plot(x, y_fit, "-", label="Best Fit Line")
plt.title("Line Chart with Best Fit Line")
plt.xlabel(df.columns[0])
plt.ylabel(df.columns[1])
plt.legend()
plt.grid(True)
# 표시하기 전에 플롯을 BytesIO 버퍼에 저장
buf = BytesIO()
plt.savefig(buf, format="png")
buf.seek(0)
# 플롯 표시
plt.show()
# 데이터 URL을 위해 이미지를 base64로 인코딩
image_data = buf.getvalue()
base64_encoded_data = base64.b64encode(image_data)
base64_string = base64_encoded_data.decode("utf-8")
data_url = f"data:image/png;base64,{base64_string}"
return data_url
# 도구를 실행하는 함수 정의
@weave.op()
def execute_tool(tool_calls, messages):
for tool_call in tool_calls:
tool_name = tool_call.function.name
tool_arguments = json.loads(tool_call.function.arguments)
if tool_name == "clean_data":
# 데이터 정제 시뮬레이션
cleaned_df = clean_data(tool_arguments["data"])
cleaned_data = {"cleaned_data": cleaned_df.to_dict()}
messages.append(
{"role": "tool", "name": tool_name, "content": json.dumps(cleaned_data)}
)
print("Cleaned data: ", cleaned_df)
elif tool_name == "transform_data":
# 데이터 변환 시뮬레이션
transformed_data = {"transformed_data": "sample_transformed_data"}
messages.append(
{
"role": "tool",
"name": tool_name,
"content": json.dumps(transformed_data),
}
)
elif tool_name == "aggregate_data":
# 데이터 집계 시뮬레이션
aggregated_data = {"aggregated_data": "sample_aggregated_data"}
messages.append(
{
"role": "tool",
"name": tool_name,
"content": json.dumps(aggregated_data),
}
)
elif tool_name == "stat_analysis":
# 통계 분석 시뮬레이션
stats_df = stat_analysis(tool_arguments["data"])
stats = {"stats": stats_df.to_dict()}
messages.append(
{"role": "tool", "name": tool_name, "content": json.dumps(stats)}
)
print("Statistical Analysis: ", stats_df)
elif tool_name == "correlation_analysis":
# 상관 분석 시뮬레이션
correlations = {"correlations": "sample_correlations"}
messages.append(
{"role": "tool", "name": tool_name, "content": json.dumps(correlations)}
)
elif tool_name == "regression_analysis":
# 회귀 분석 시뮬레이션
regression_results = {"regression_results": "sample_regression_results"}
messages.append(
{
"role": "tool",
"name": tool_name,
"content": json.dumps(regression_results),
}
)
elif tool_name == "create_bar_chart":
# 막대 차트 생성 시뮬레이션
bar_chart = {"bar_chart": "sample_bar_chart"}
messages.append(
{"role": "tool", "name": tool_name, "content": json.dumps(bar_chart)}
)
elif tool_name == "create_line_chart":
# 선 차트 생성 시뮬레이션
line_chart = {"line_chart": plot_line_chart(tool_arguments["data"])}
messages.append(
{"role": "tool", "name": tool_name, "content": json.dumps(line_chart)}
)
elif tool_name == "create_pie_chart":
# 파이 차트 생성 시뮬레이션
pie_chart = {"pie_chart": "sample_pie_chart"}
messages.append(
{"role": "tool", "name": tool_name, "content": json.dumps(pie_chart)}
)
return messages
```
다음으로, 각 하위 에이전트의 도구 핸들러를 만드세요. 각 핸들러에는 모델에 전달할 고유한 프롬프트와 도구 세트가 있습니다. 그런 다음 출력은 도구 Call을 실행하는 실행 함수로 전달됩니다.
```python lines theme={null}
# 각 에이전트의 처리를 수행하는 함수를 정의합니다
@weave.op()
def handle_data_processing_agent(query, conversation_messages):
messages = [{"role": "system", "content": processing_system_prompt}]
messages.append({"role": "user", "content": query})
response = client.chat.completions.create(
model=MODEL,
messages=messages,
temperature=0,
tools=preprocess_tools,
)
conversation_messages.append(
[tool_call.function for tool_call in response.choices[0].message.tool_calls]
)
execute_tool(response.choices[0].message.tool_calls, conversation_messages)
@weave.op()
def handle_analysis_agent(query, conversation_messages):
messages = [{"role": "system", "content": analysis_system_prompt}]
messages.append({"role": "user", "content": query})
response = client.chat.completions.create(
model=MODEL,
messages=messages,
temperature=0,
tools=analysis_tools,
)
conversation_messages.append(
[tool_call.function for tool_call in response.choices[0].message.tool_calls]
)
execute_tool(response.choices[0].message.tool_calls, conversation_messages)
@weave.op()
def handle_visualization_agent(query, conversation_messages):
messages = [{"role": "system", "content": visualization_system_prompt}]
messages.append({"role": "user", "content": query})
response = client.chat.completions.create(
model=MODEL,
messages=messages,
temperature=0,
tools=visualization_tools,
)
conversation_messages.append(
[tool_call.function for tool_call in response.choices[0].message.tool_calls]
)
execute_tool(response.choices[0].message.tool_calls, conversation_messages)
```
마지막으로, 사용자 쿼리 처리를 총괄하는 상위 도구를 만드세요. 이 함수는 사용자 쿼리를 받아 모델에서 응답을 얻은 다음, 이를 다른 에이전트에 전달해 실행하게 합니다.
```python lines theme={null}
# 사용자 입력을 처리하고 분류하는 함수
@weave.op()
def handle_user_message(user_query, conversation_messages=None):
if conversation_messages is None:
conversation_messages = []
user_message = {"role": "user", "content": user_query}
conversation_messages.append(user_message)
messages = [{"role": "system", "content": triaging_system_prompt}]
messages.extend(conversation_messages)
response = client.chat.completions.create(
model=MODEL,
messages=messages,
temperature=0,
tools=triage_tools,
)
conversation_messages.append(
[tool_call.function for tool_call in response.choices[0].message.tool_calls]
)
for tool_call in response.choices[0].message.tool_calls:
if tool_call.function.name == "send_query_to_agents":
agents = json.loads(tool_call.function.arguments)["agents"]
query = json.loads(tool_call.function.arguments)["query"]
for agent in agents:
if agent == "Data Processing Agent":
handle_data_processing_agent(query, conversation_messages)
elif agent == "Analysis Agent":
handle_analysis_agent(query, conversation_messages)
elif agent == "Visualization Agent":
handle_visualization_agent(query, conversation_messages)
outputs = extract_tool_contents(conversation_messages)
return outputs
functions = [
"clean_data",
"transform_data",
"stat_analysis",
"aggregate_data",
"correlation_analysis",
"regression_analysis",
"create_bar_chart",
"create_line_chart",
"create_pie_chart",
]
@weave.op()
def extract_tool_contents(data):
contents = {}
contents["all"] = data
for element in data:
if (
isinstance(element, dict)
and element.get("role") == "tool"
and element.get("name") in functions
):
name = element["name"]
content_str = element["content"]
try:
content_json = json.loads(content_str)
if "chart" not in element.get("name"):
contents[name] = [content_json]
else:
first_key = next(iter(content_json))
second_level = content_json[first_key]
if isinstance(second_level, dict):
second_key = next(iter(second_level))
contents[name] = second_level[second_key]
else:
contents[name] = second_level
except json.JSONDecodeError:
print(f"Error decoding JSON for {name}")
contents[name] = None
return contents
```
## 멀티 에이전트 시스템을 실행하고 Weave에서 시각화하기
이제 모든 에이전트, 도구, 핸들러가 준비되었으므로 시스템을 실행할 수 있습니다. 마지막으로 사용자 입력을 사용해 기본 `handle_user_message` 함수를 실행하고 결과를 확인하세요.
```python lines theme={null}
handle_user_message(user_query)
```
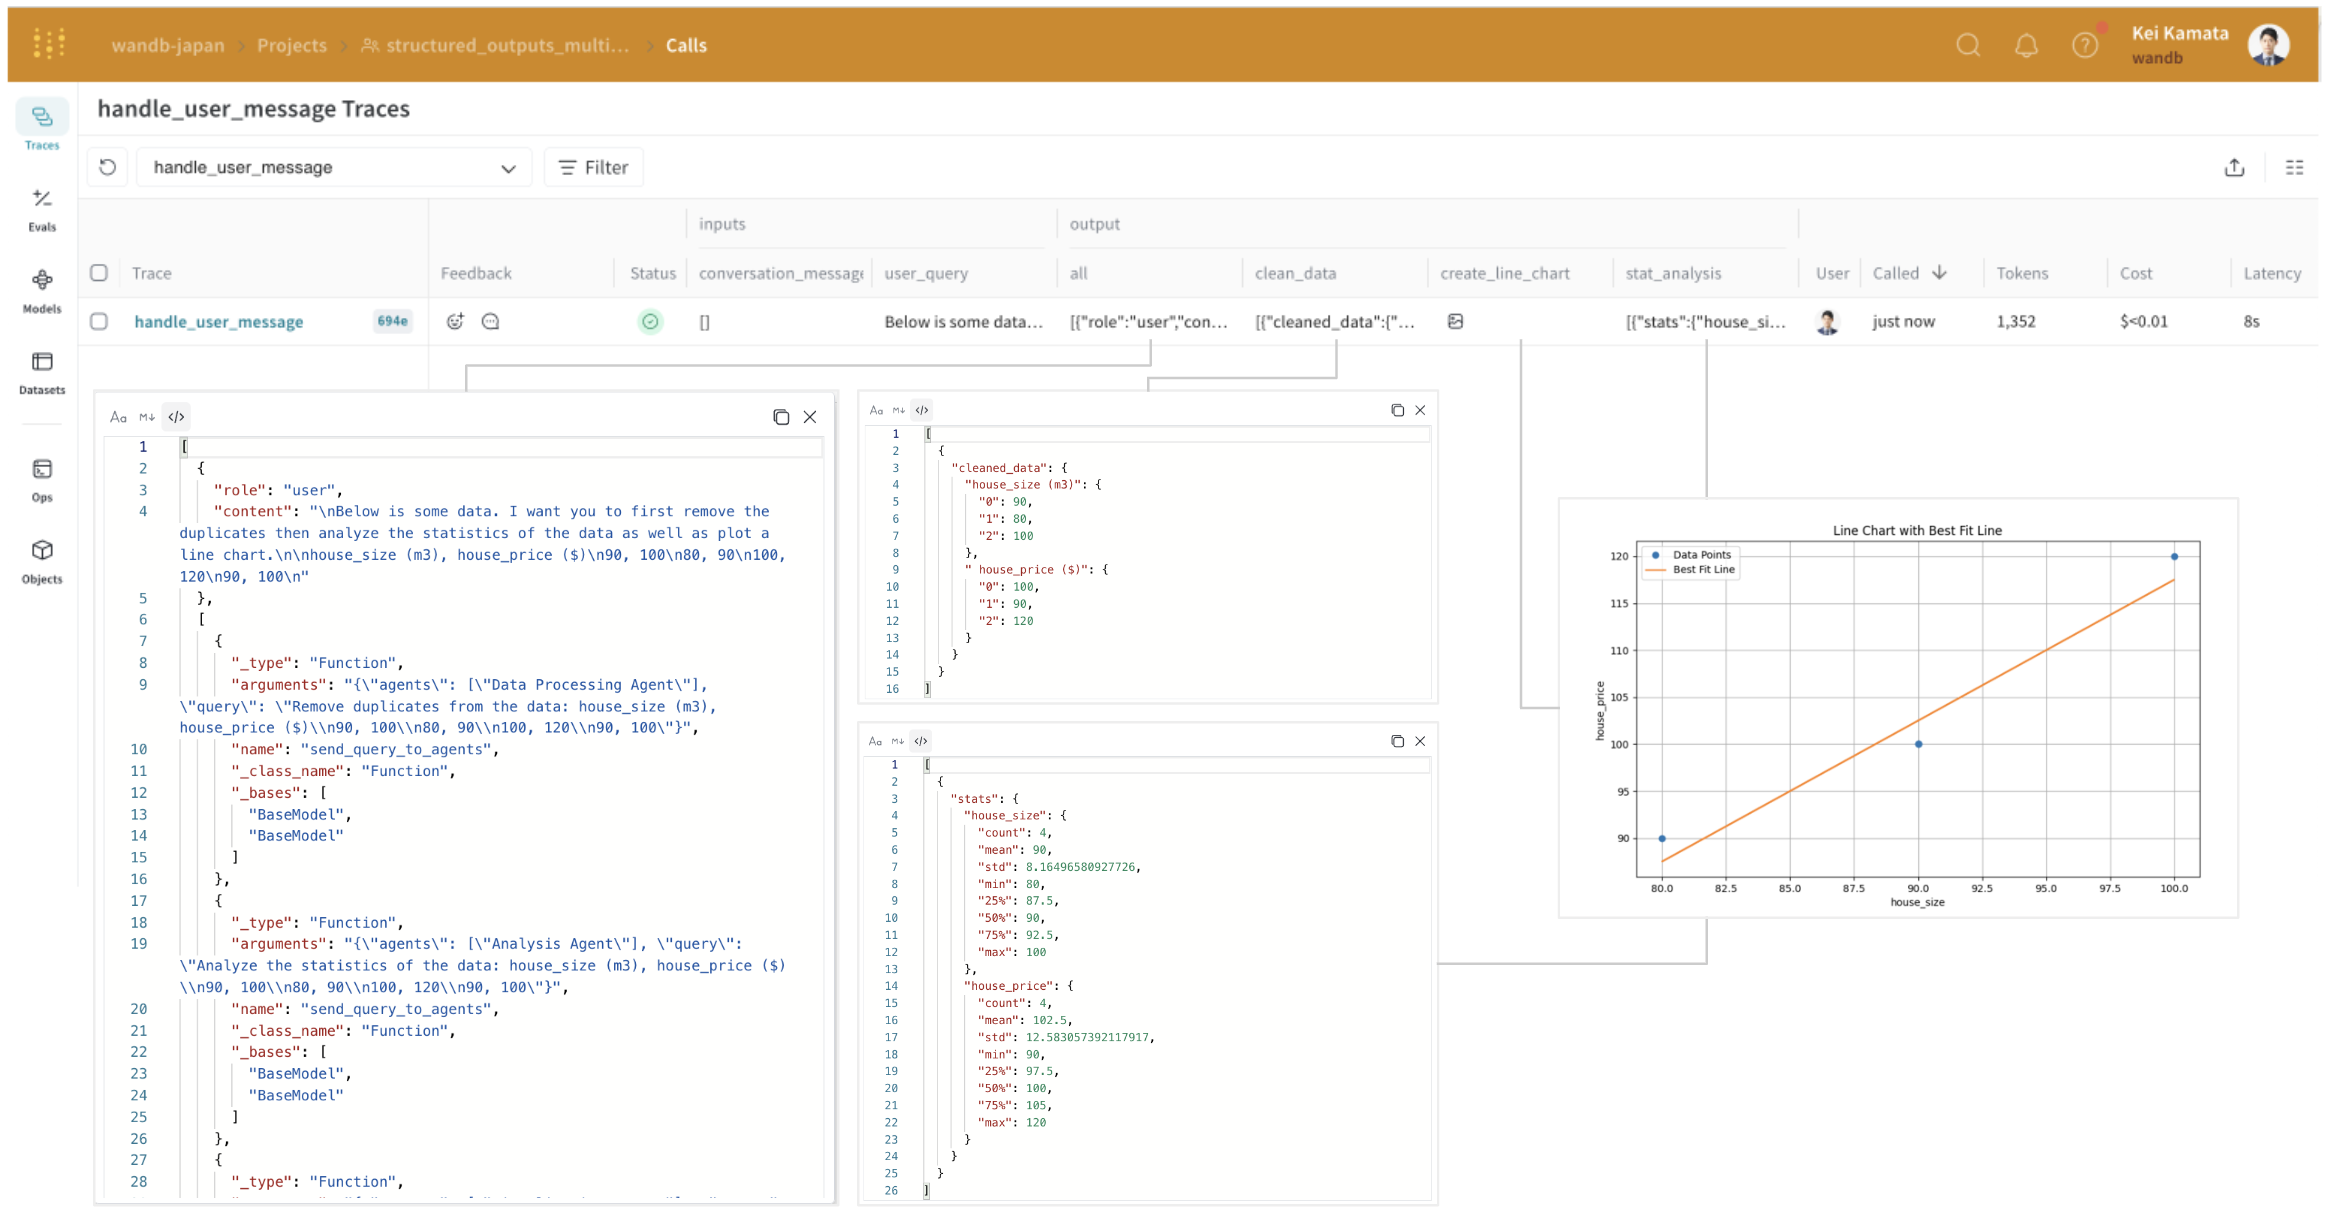
Weave URL을 클릭하면 실행 트레이스를 볼 수 있습니다. **Traces** 페이지에서 입력과 출력을 확인할 수 있습니다. 이해를 돕기 위해 이 그림에는 각 출력을 클릭했을 때 표시되는 결과의 스크린샷이 포함되어 있습니다. Weave는 OpenAI API와 통합되며 비용도 자동으로 계산합니다. 각 트레이스 옆에는 비용과 지연 시간도 함께 표시됩니다.
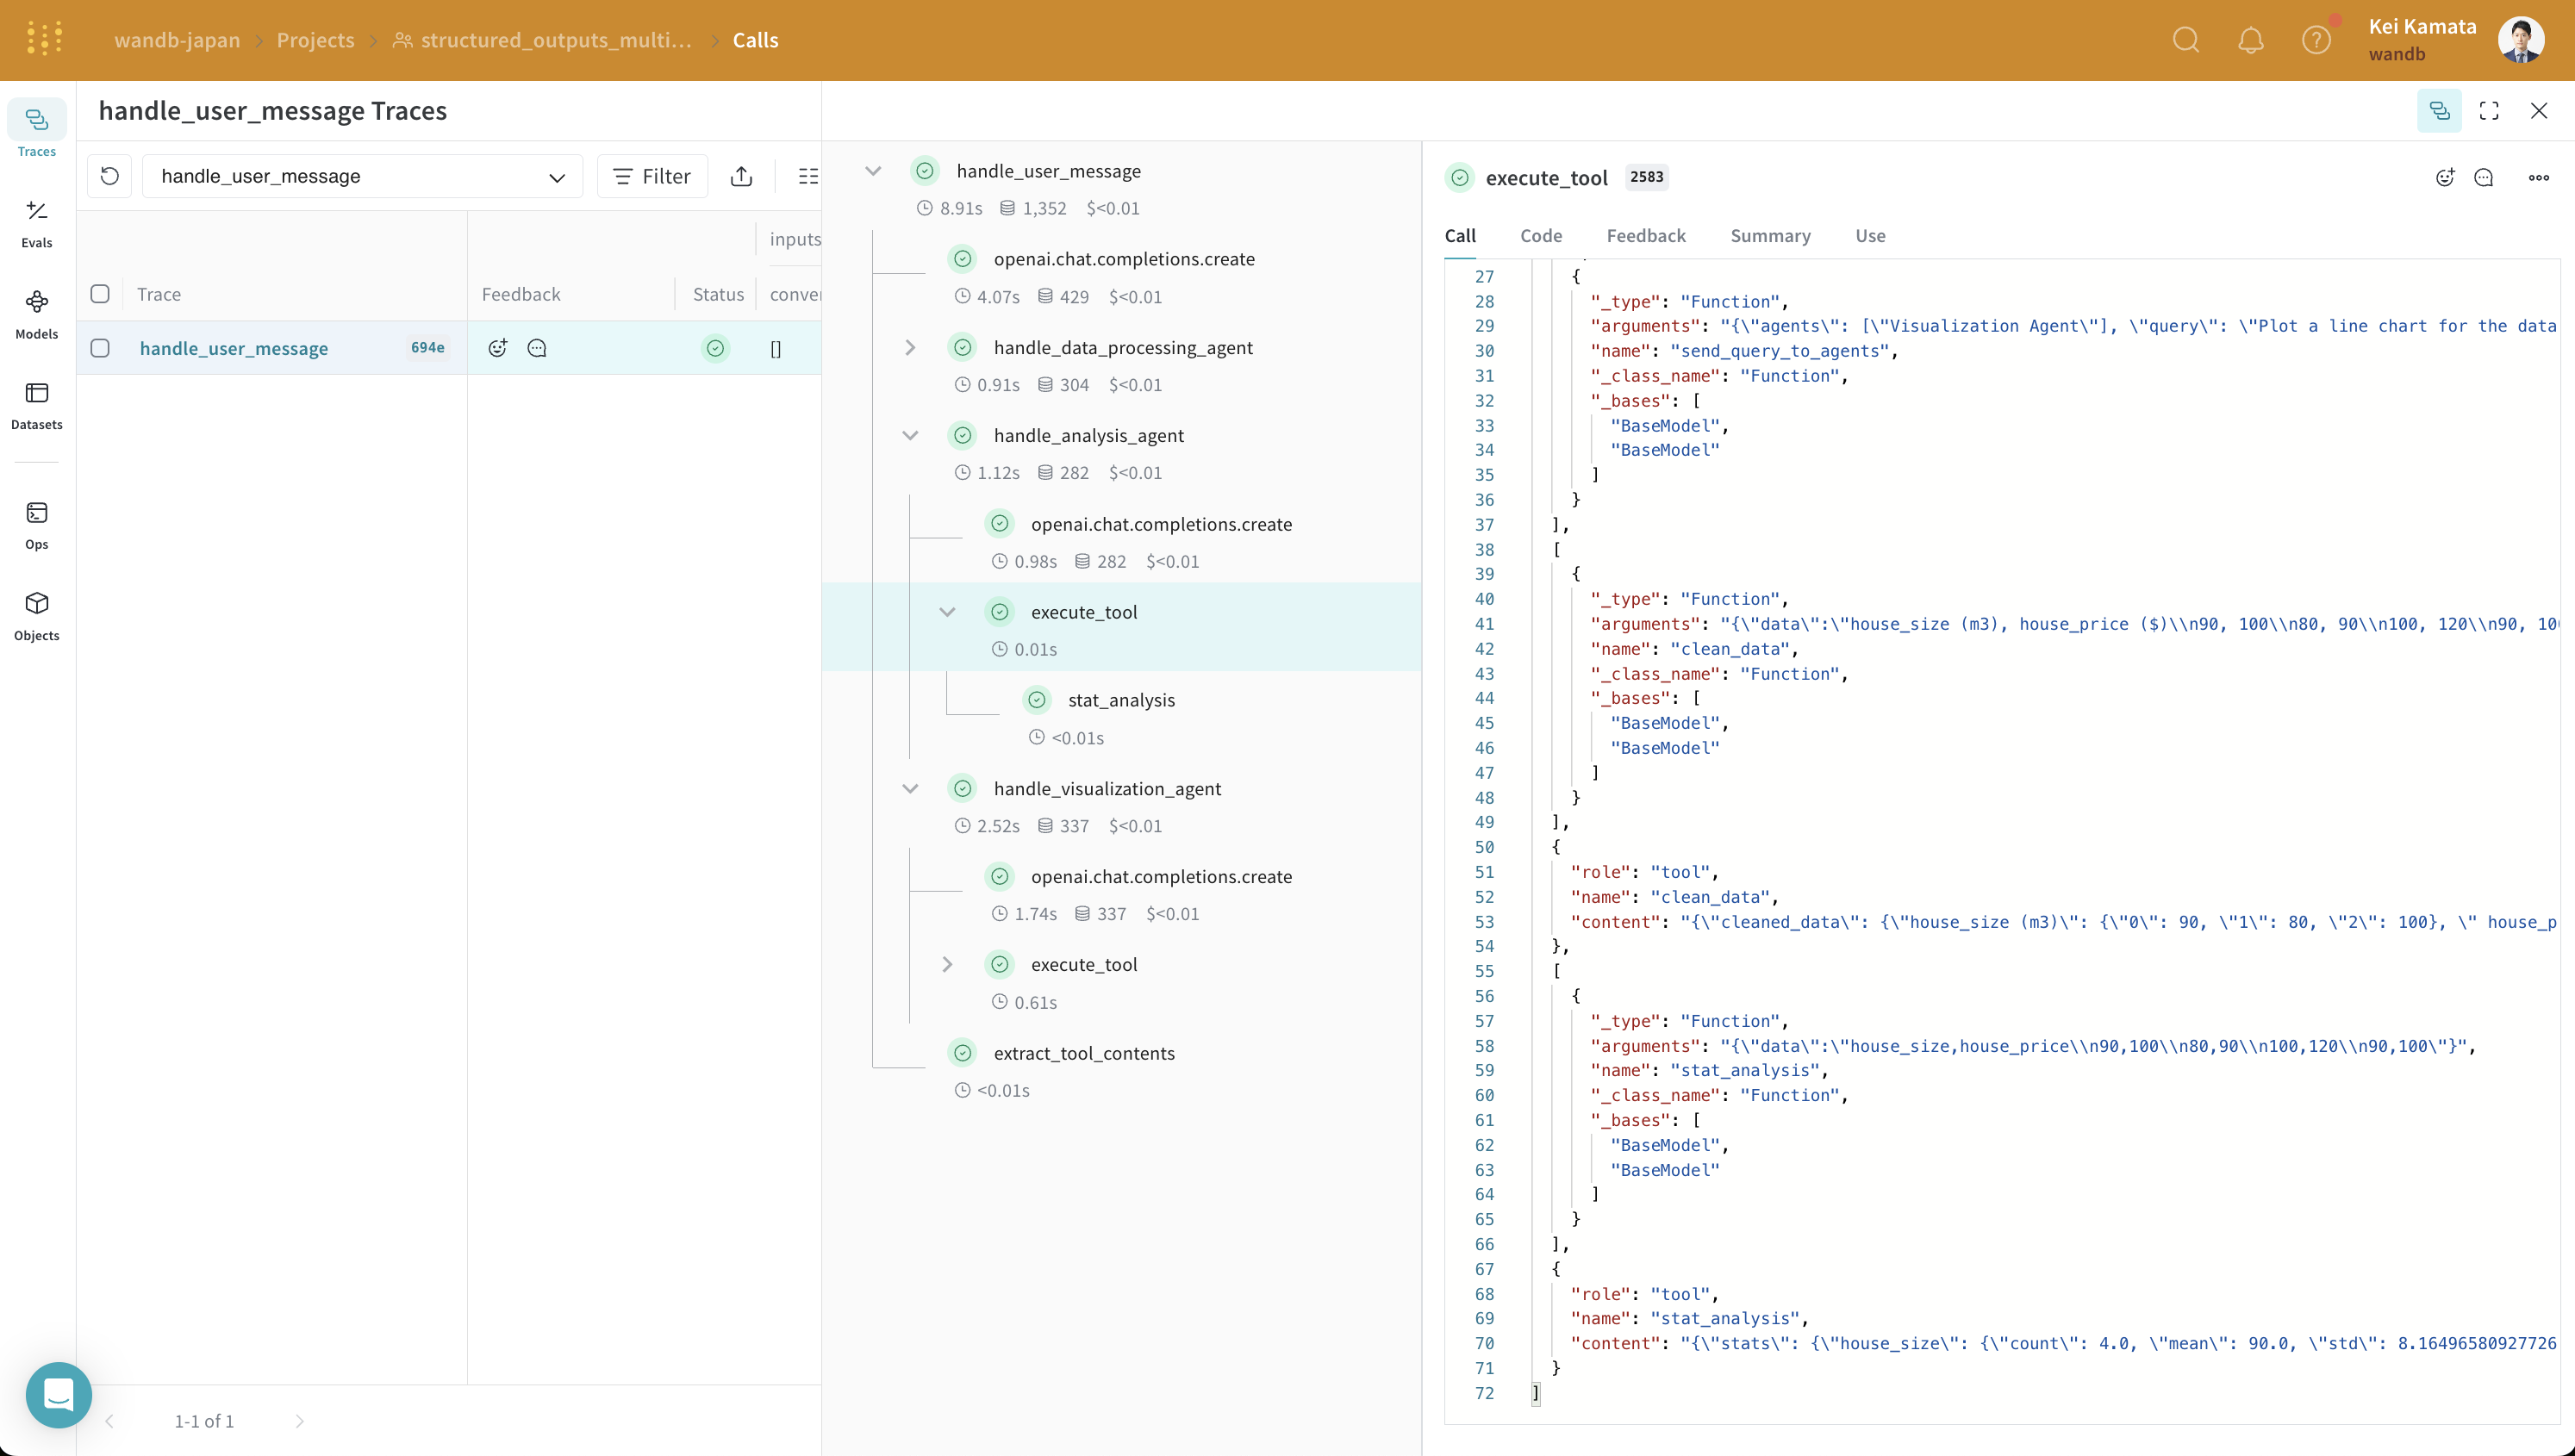
 행을 클릭하면 멀티 에이전트 시스템 내에서 실행된 중간 프로세스를 볼 수 있습니다. 예를 들어 `analysis_agent`의 입력과 출력은 구조화된 출력 형식으로 표시됩니다. OpenAI의 구조화된 출력은 에이전트 간 협업에 도움이 되지만, 시스템이 더 복잡해질수록 이런 상호작용 형식을 따라가기가 점점 어려워집니다. Weave를 사용하면 이러한 중간 프로세스와 해당 입력 및 출력을 자세히 살펴볼 수 있습니다.
 이제 Weave에서 트레이싱이 어떻게 처리되는지 좀 더 자세히 살펴보겠습니다.
## 결론
이 튜토리얼에서는 OpenAI의 구조화된 출력과 Weave를 사용해 입력, 최종 출력, 중간 출력 형식을 추적하는 멀티 에이전트 시스템을 개발하는 방법을 알아보았습니다. 이제 추가 에이전트, 도구 또는 구조화된 응답 스키마로 확장할 수 있는 실제로 동작하는 예시를 갖추게 되었습니다.