> ## Documentation Index
> Fetch the complete documentation index at: https://docs.wandb.ai/llms.txt
> Use this file to discover all available pages before exploring further.
# Manage workspace, section, and panel settings
> Manage workspace, section, and panel settings in the W&B App, including layout and line plot configuration options.
A workspace page has three different setting levels: workspaces, sections, and panels. [Workspace settings](#workspace-settings) apply to the entire workspace. [Section settings](#section-settings) apply to all panels within a section. [Panel settings](#panel-settings) apply to individual panels.
This page describes how to configure each level of settings so that you can control your workspace's layout, organize panels, and customize how data is displayed. The following sections describe each setting level in turn.
## Workspace settings
Workspace settings apply to all sections and all panels within those sections. You can edit two types of workspace settings: [Workspace layout](#workspace-layout-options) and [Line plots](#line-plots-options). **Workspace layouts** determine the structure of the workspace, while **Line plots** settings control the default settings for line plots in the workspace.
To edit settings that apply to the overall structure of this workspace:
1. Navigate to your project workspace.
2. Click the gear icon next to the **New report** button to view the workspace settings.
3. Choose **Workspace layout** to change the workspace's layout, or choose **Line plots** to configure default settings for line plots in the workspace.
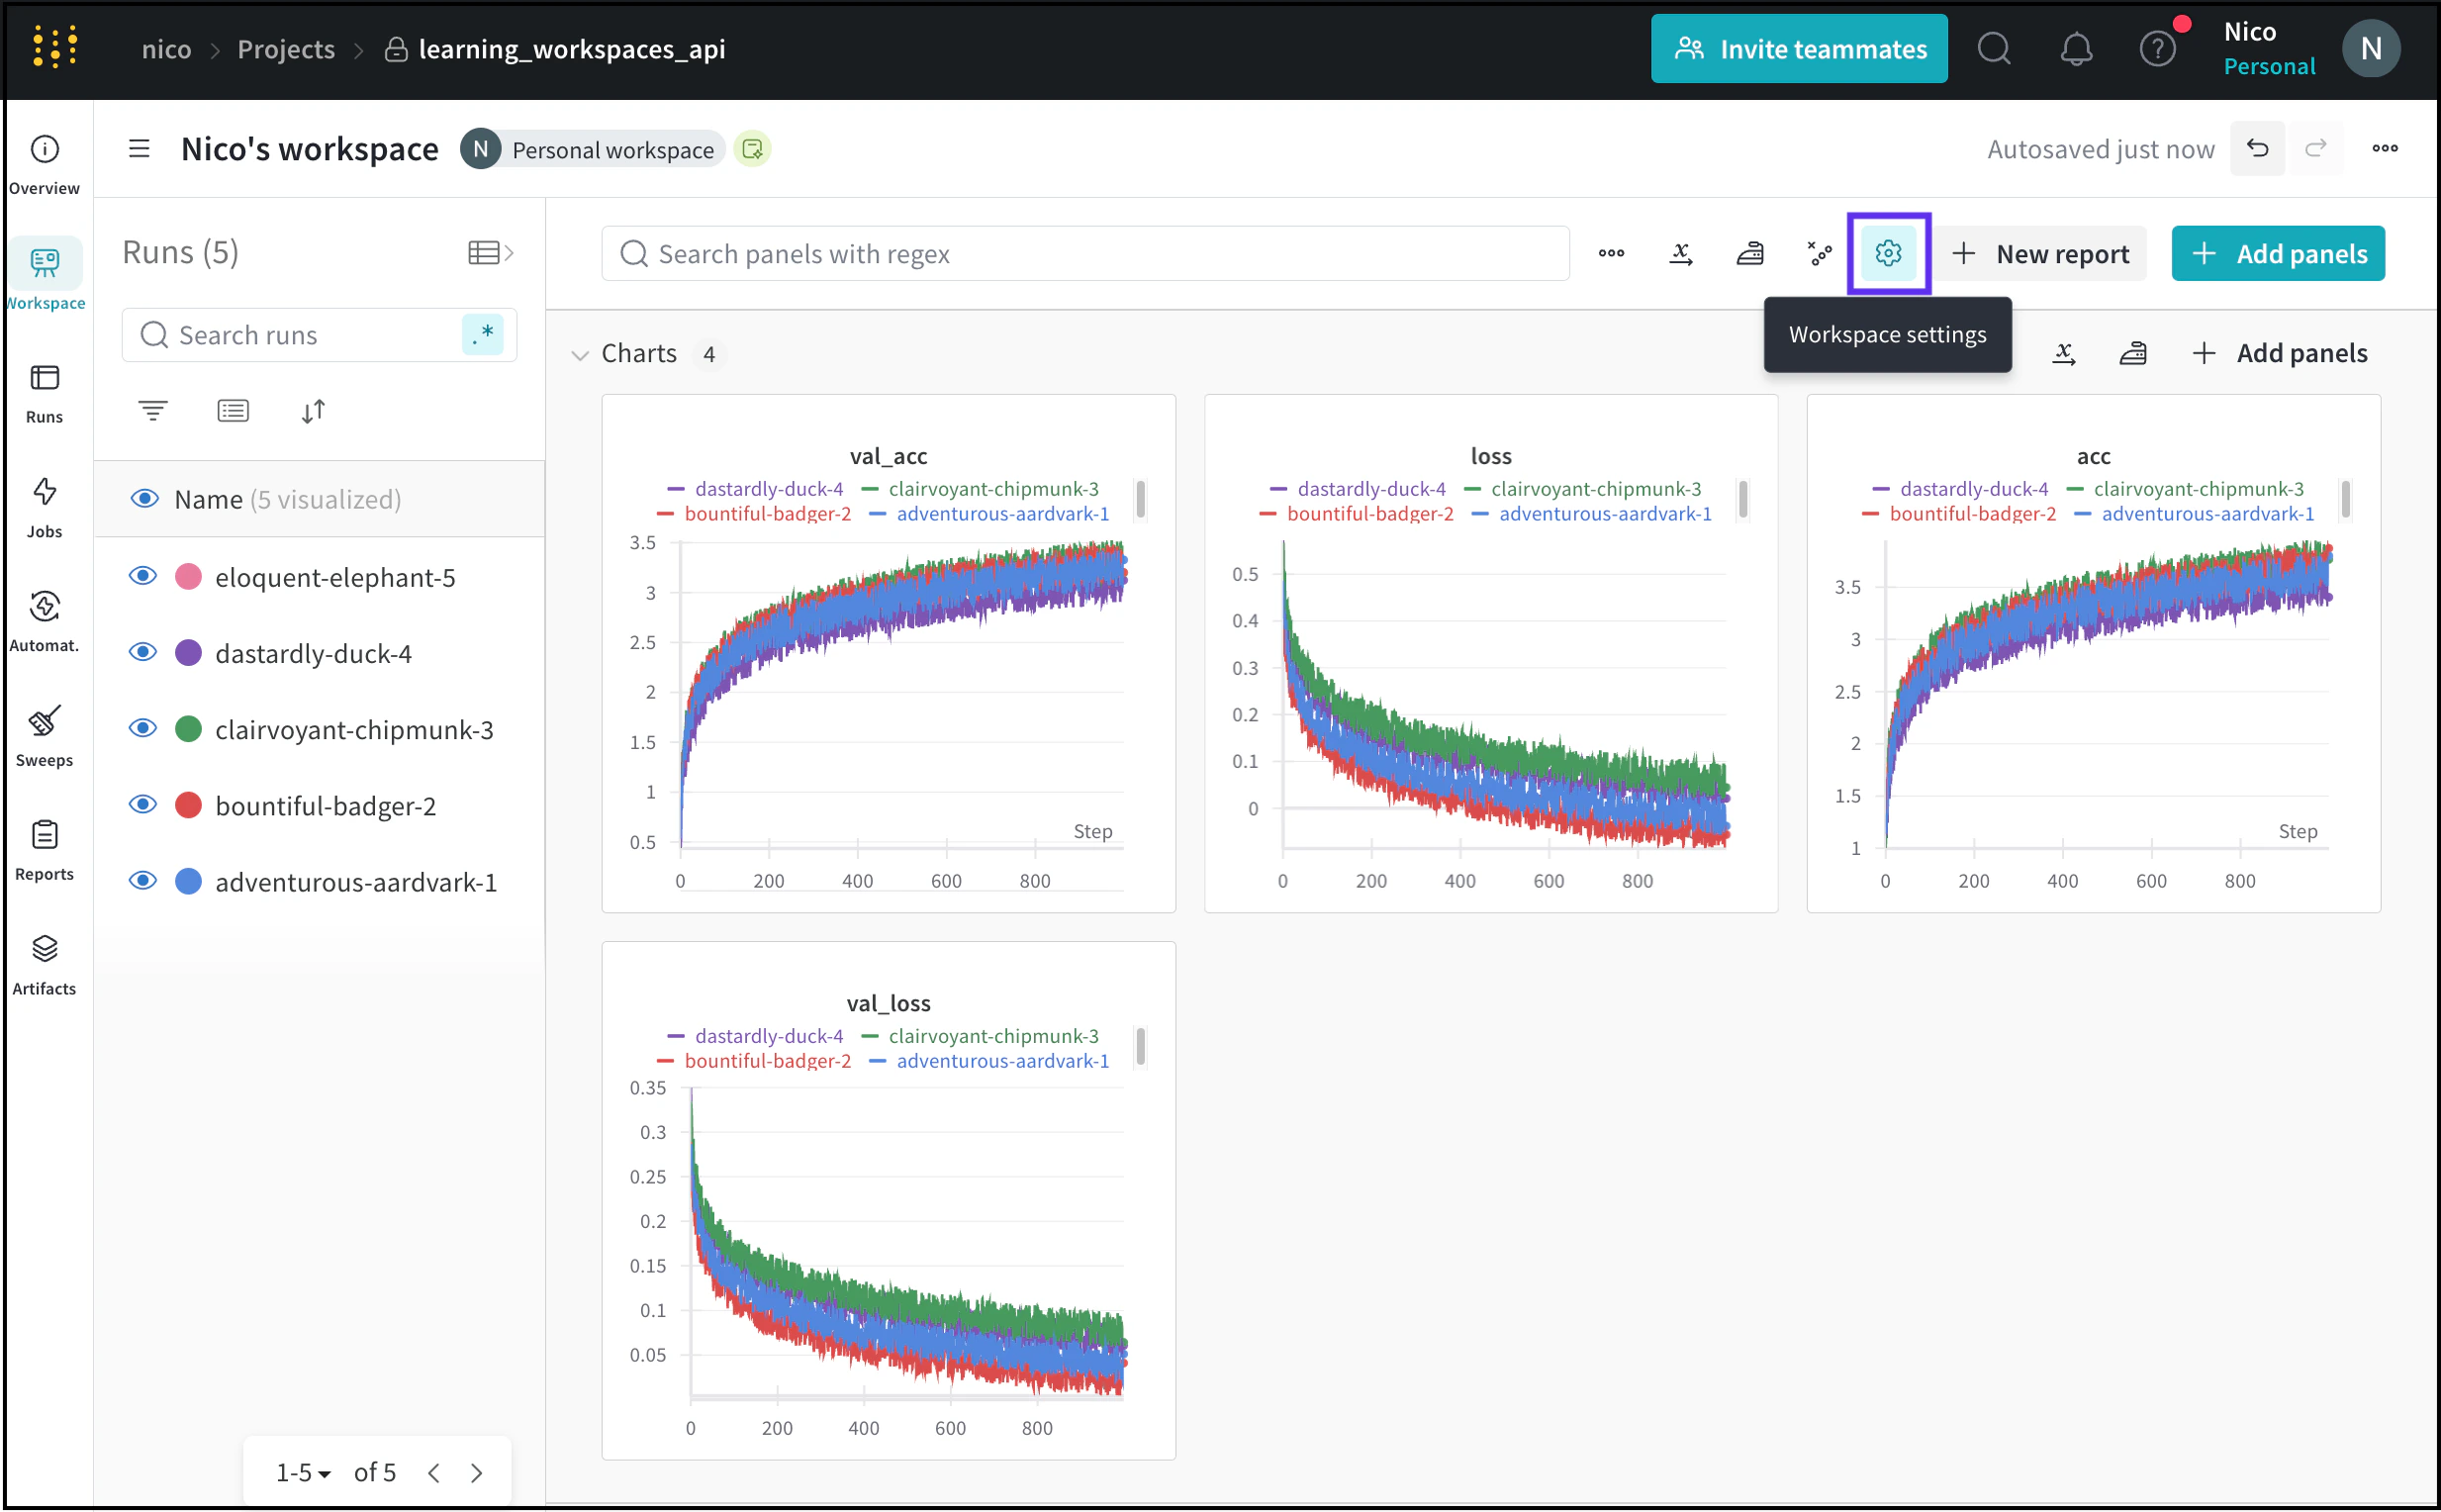 The workspace settings panel opens, where you can apply the changes described in the following sections.
After customizing your workspace, you can use *workspace templates* to create new workspaces with the same settings. Refer to [Workspace templates](/models/track/workspaces/#workspace-templates).
### Workspace layout options
Configure a workspace's layout to define the overall structure of the workspace. This includes sectioning logic and panel organization.
The workspace settings panel opens, where you can apply the changes described in the following sections.
After customizing your workspace, you can use *workspace templates* to create new workspaces with the same settings. Refer to [Workspace templates](/models/track/workspaces/#workspace-templates).
### Workspace layout options
Configure a workspace's layout to define the overall structure of the workspace. This includes sectioning logic and panel organization.
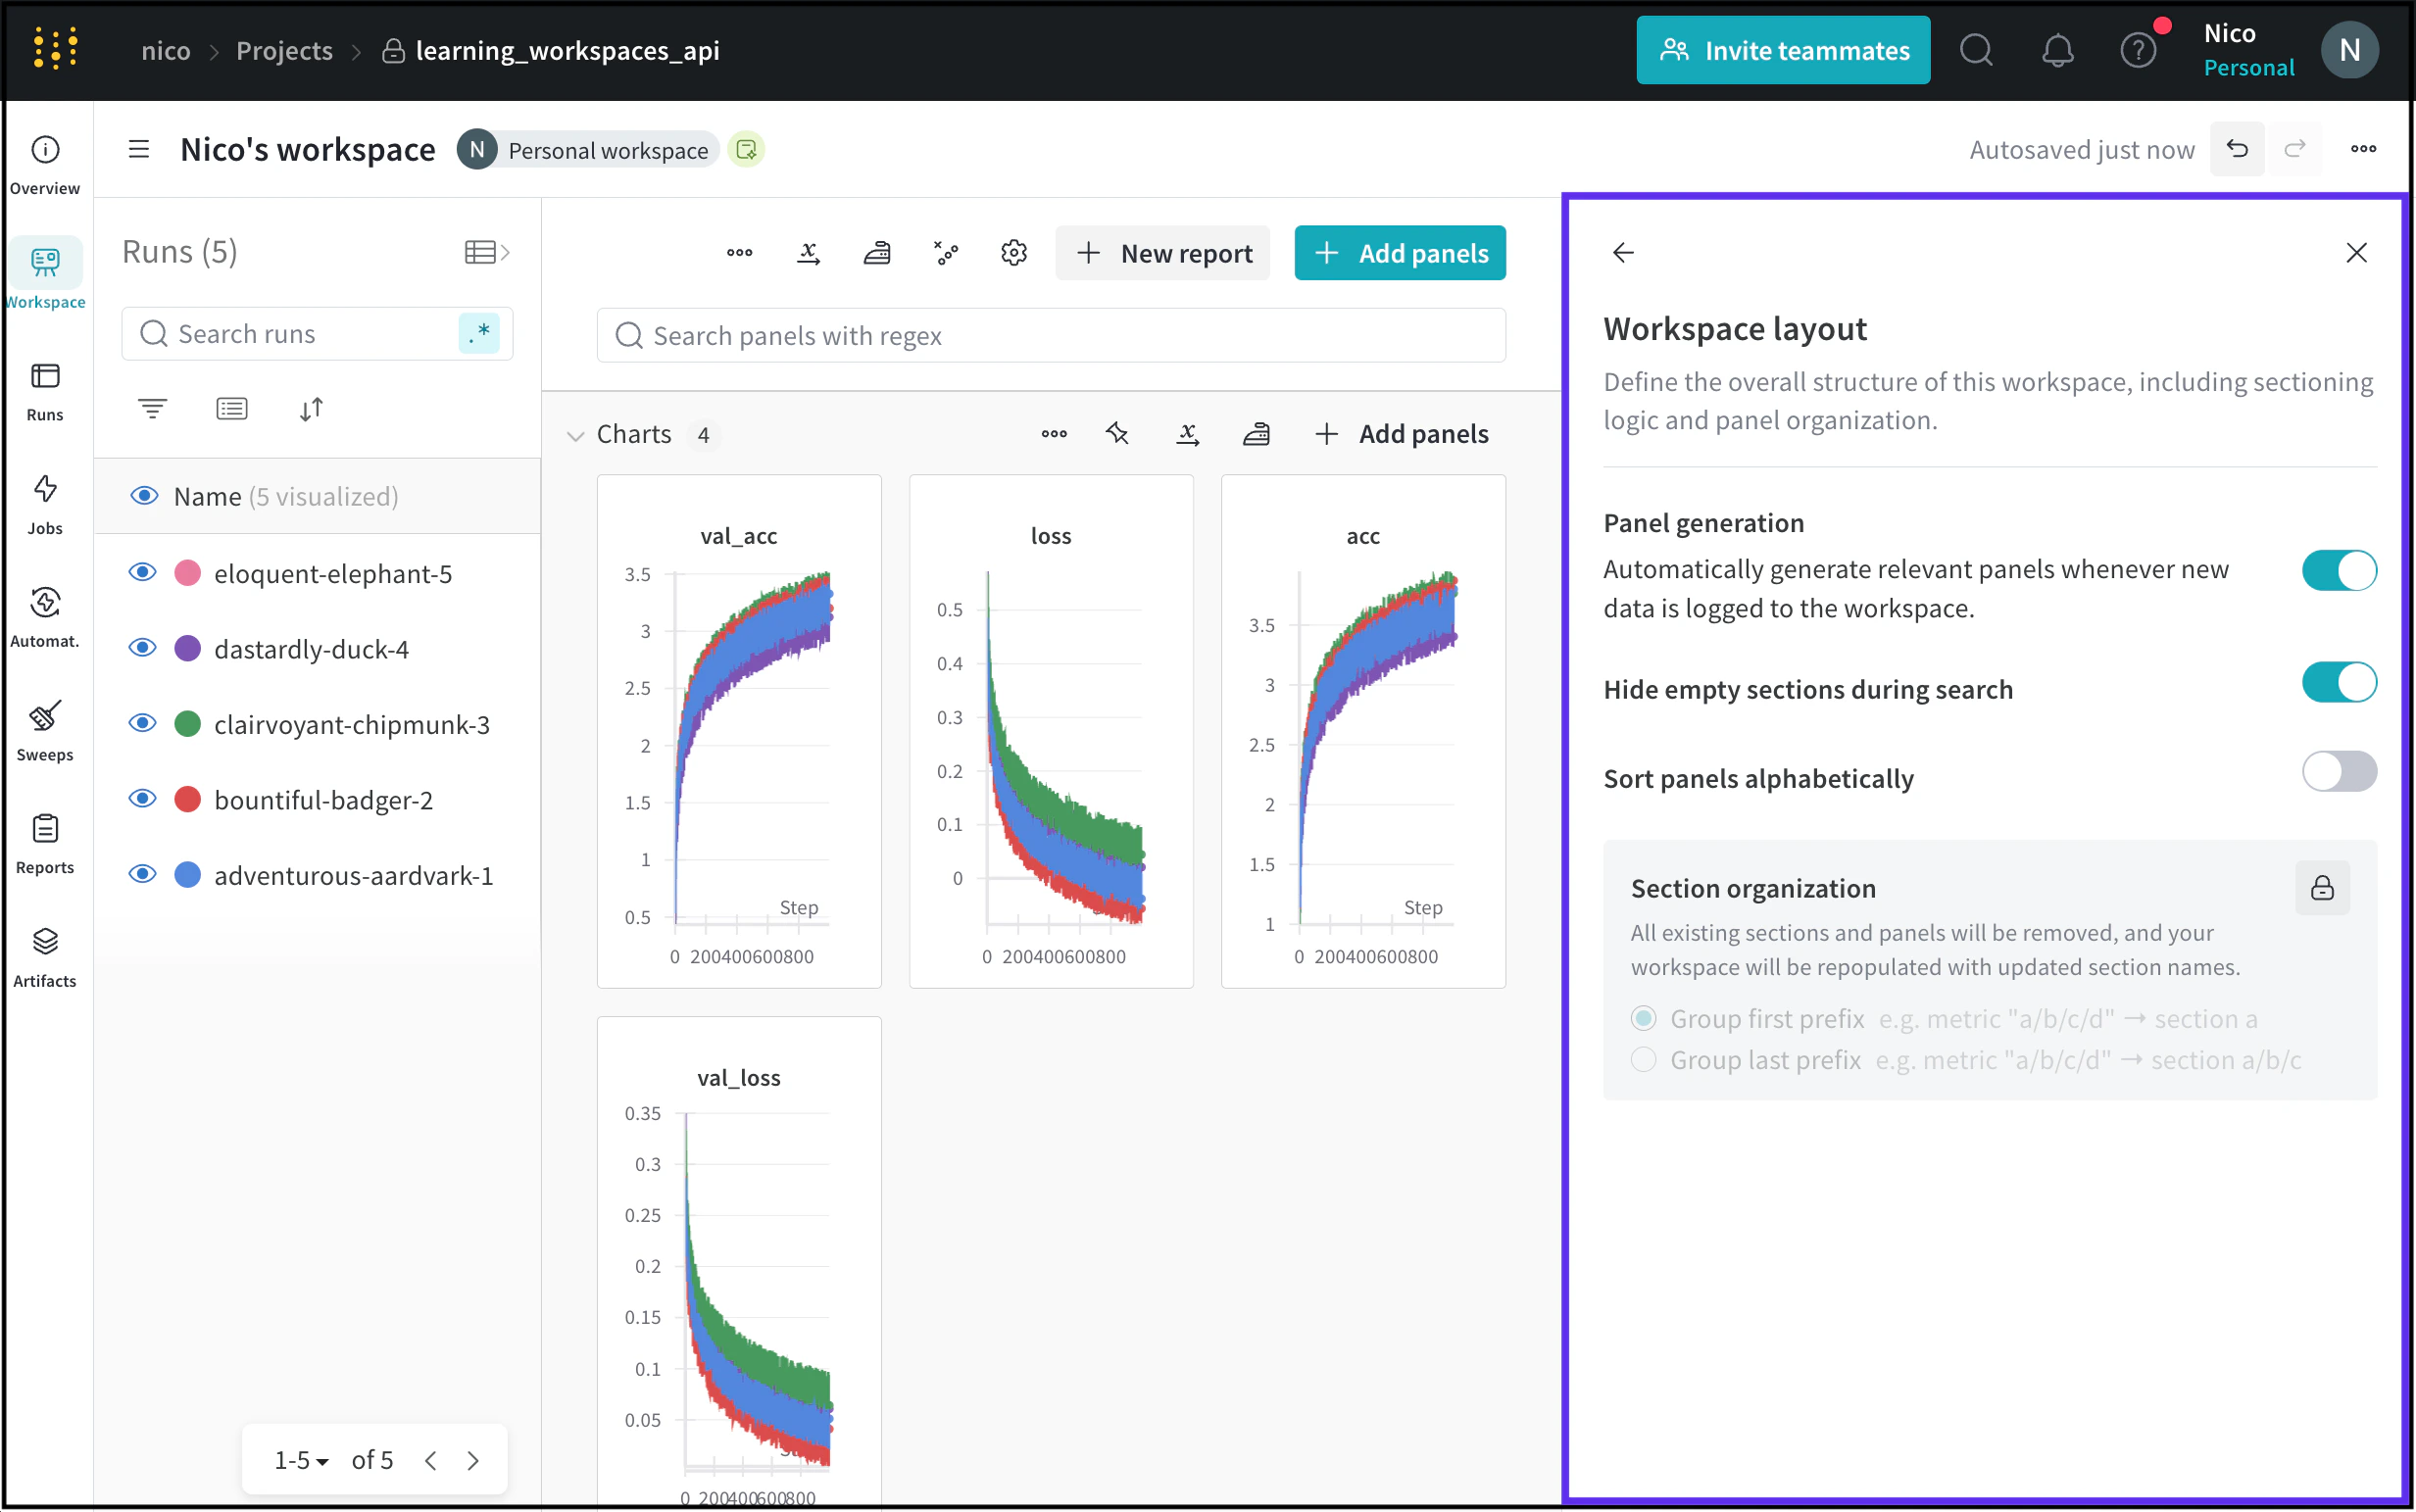 The workspace layout options page shows whether the workspace generates panels automatically or manually. To adjust a workspace's panel generation mode, refer to [Panels](/models/app/features/panels/).
This table describes each workspace layout option.
| Workspace setting | Description |
| ------------------------------------- | ------------------------------------------------------------------------------------------------------------------------------------------------------- |
| **Hide empty sections during search** | Hide sections that don't contain any panels when searching for a panel. |
| **Sort panels alphabetically** | Sort panels in your workspaces alphabetically. |
| **Section organization** | Remove all existing sections and panels and repopulate them with new section names. Groups the newly populated sections either by first or last prefix. |
W\&B suggests that you organize sections by grouping the first prefix rather than grouping by the last prefix. Grouping by the first prefix can result in fewer sections and better performance.
### Line plots options
Set global defaults and custom rules for line plots in a workspace by modifying the **Line plots** workspace settings.
The workspace layout options page shows whether the workspace generates panels automatically or manually. To adjust a workspace's panel generation mode, refer to [Panels](/models/app/features/panels/).
This table describes each workspace layout option.
| Workspace setting | Description |
| ------------------------------------- | ------------------------------------------------------------------------------------------------------------------------------------------------------- |
| **Hide empty sections during search** | Hide sections that don't contain any panels when searching for a panel. |
| **Sort panels alphabetically** | Sort panels in your workspaces alphabetically. |
| **Section organization** | Remove all existing sections and panels and repopulate them with new section names. Groups the newly populated sections either by first or last prefix. |
W\&B suggests that you organize sections by grouping the first prefix rather than grouping by the last prefix. Grouping by the first prefix can result in fewer sections and better performance.
### Line plots options
Set global defaults and custom rules for line plots in a workspace by modifying the **Line plots** workspace settings.
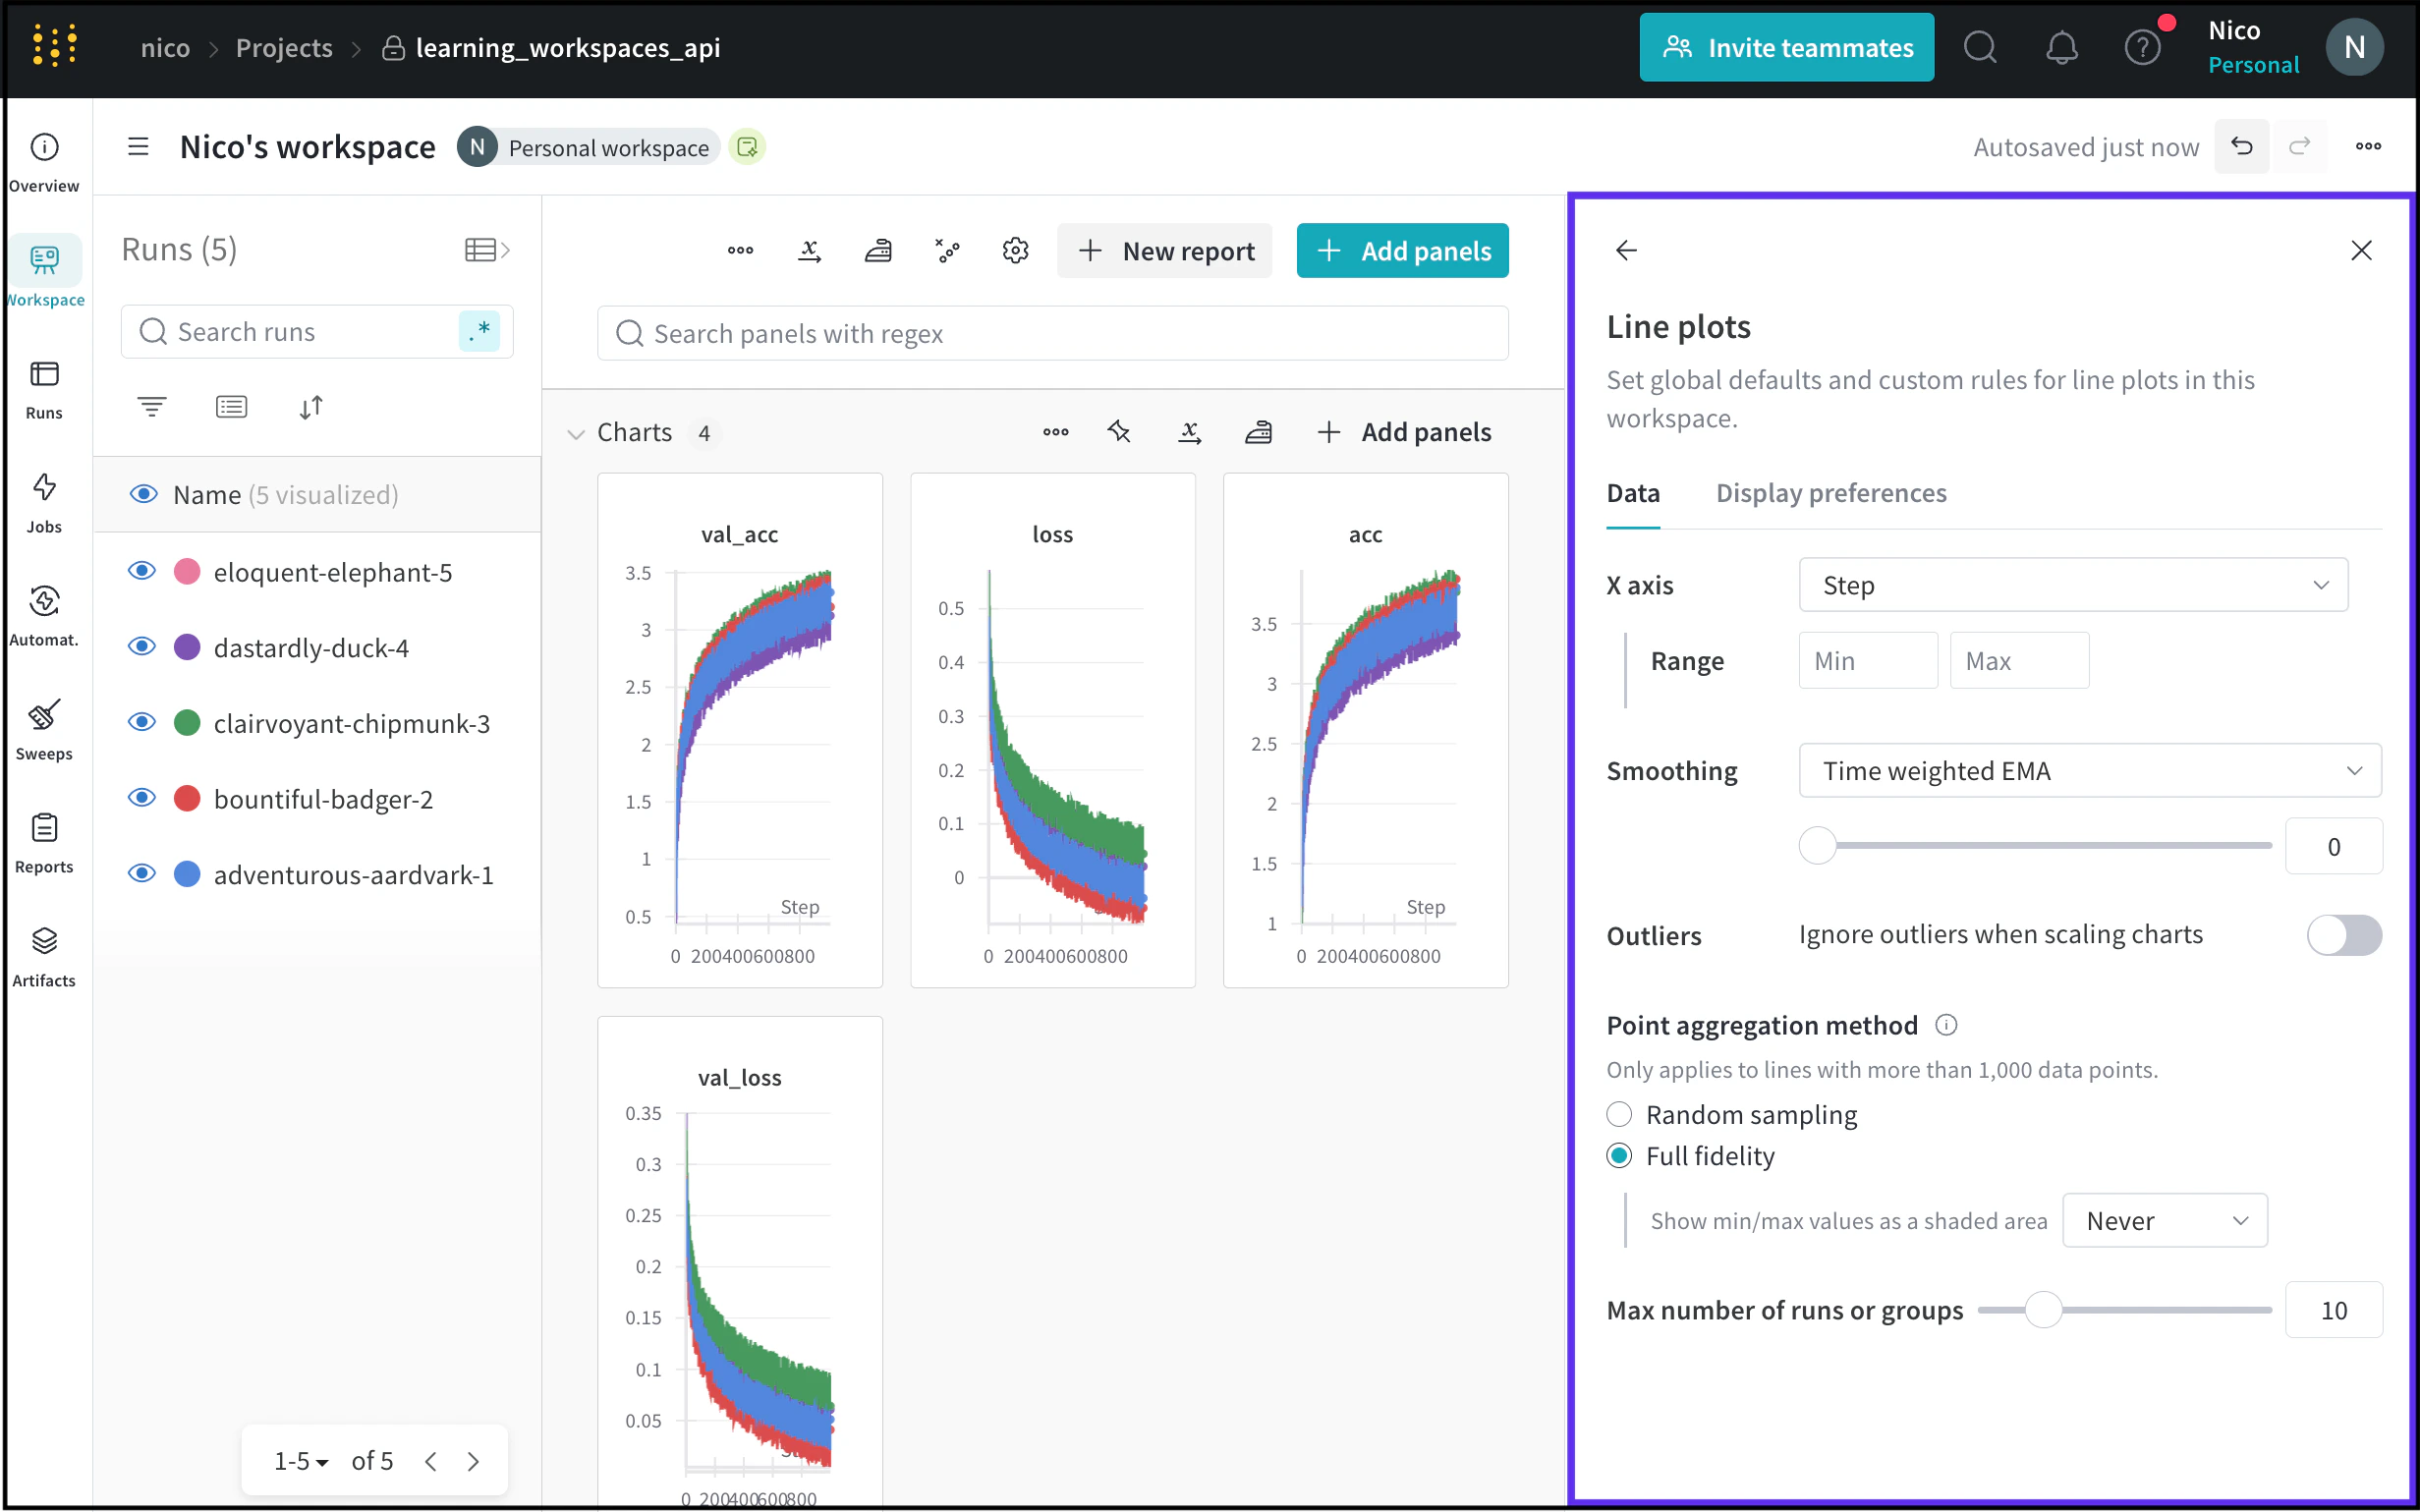 You can edit two main settings within **Line plots** settings: **Data** and **Display preferences**. The **Data** tab contains the following settings:
| Line plot setting | Description |
| -------------------------------- | ------------------------------------------------------------------------------------------------------------------------------------------------------- |
| **X axis** | The scale of the x-axis in line plots. The x-axis is set to **Step** by default. See the following table for the list of x-axis options. |
| **Range** | Minimum and maximum settings to display for the x-axis. |
| **Smoothing** | Change the smoothing on the line plot. For more information about smoothing, see [Smooth line plots](/models/app/features/panels/line-plot/smoothing/). |
| **Outliers** | Rescale to exclude outliers from the default plot min and max scale. |
| **Point aggregation method** | Improve data visualization accuracy and performance. For more information, see [Point aggregation](/models/app/features/panels/line-plot/sampling/). |
| **Max number of runs or groups** | Limit the number of runs or groups displayed on the line plot. |
Besides **Step**, the x-axis supports the following options:
| X axis option | Description |
| --------------------------- | ------------------------------------------------------------------------------------------------------------------------------------------------------------------------------------- |
| **Relative Time (Wall)** | Timestamp since the process starts. For example, suppose you start a run and resume that run the next day. If you then log something, the recorded point is 24 hours. |
| **Relative Time (Process)** | Timestamp inside the running process. For example, suppose you start a run and let it continue for 10 seconds. The next day you resume that run. The point is recorded as 10 seconds. |
| **Wall Time** | Minutes elapsed since the start of the first run on the graph. |
| **Step** | Increments each time you call `wandb.Run.log()`. |
For information about how to edit an individual line plot, see [Edit line panel settings](/models/app/features/panels/line-plot/#edit-line-panel-settings) in Line plots.
Within the **Display preferences** tab, you can toggle the following settings:
| Display preference | Description |
| -------------------------------------------------------- | ------------------------------------------------------ |
| **Remove legends from all panels** | Remove the panel's legend. |
| **Display colored run names in tooltips** | Show the runs as colored text within the tooltip. |
| **Only show highlighted run in companion chart tooltip** | Display only highlighted runs in chart tooltip. |
| **Number of runs shown in tooltips** | Display the number of runs in the tooltip. |
| **Display full run names on the primary chart tooltip** | Display the full name of the run in the chart tooltip. |
## Section settings
Section settings apply to all panels within that section. Within a workspace section you can sort panels, rearrange panels, and rename the section name.
To modify section settings, select the **action ()** menu in the upper right corner of a section.
You can edit two main settings within **Line plots** settings: **Data** and **Display preferences**. The **Data** tab contains the following settings:
| Line plot setting | Description |
| -------------------------------- | ------------------------------------------------------------------------------------------------------------------------------------------------------- |
| **X axis** | The scale of the x-axis in line plots. The x-axis is set to **Step** by default. See the following table for the list of x-axis options. |
| **Range** | Minimum and maximum settings to display for the x-axis. |
| **Smoothing** | Change the smoothing on the line plot. For more information about smoothing, see [Smooth line plots](/models/app/features/panels/line-plot/smoothing/). |
| **Outliers** | Rescale to exclude outliers from the default plot min and max scale. |
| **Point aggregation method** | Improve data visualization accuracy and performance. For more information, see [Point aggregation](/models/app/features/panels/line-plot/sampling/). |
| **Max number of runs or groups** | Limit the number of runs or groups displayed on the line plot. |
Besides **Step**, the x-axis supports the following options:
| X axis option | Description |
| --------------------------- | ------------------------------------------------------------------------------------------------------------------------------------------------------------------------------------- |
| **Relative Time (Wall)** | Timestamp since the process starts. For example, suppose you start a run and resume that run the next day. If you then log something, the recorded point is 24 hours. |
| **Relative Time (Process)** | Timestamp inside the running process. For example, suppose you start a run and let it continue for 10 seconds. The next day you resume that run. The point is recorded as 10 seconds. |
| **Wall Time** | Minutes elapsed since the start of the first run on the graph. |
| **Step** | Increments each time you call `wandb.Run.log()`. |
For information about how to edit an individual line plot, see [Edit line panel settings](/models/app/features/panels/line-plot/#edit-line-panel-settings) in Line plots.
Within the **Display preferences** tab, you can toggle the following settings:
| Display preference | Description |
| -------------------------------------------------------- | ------------------------------------------------------ |
| **Remove legends from all panels** | Remove the panel's legend. |
| **Display colored run names in tooltips** | Show the runs as colored text within the tooltip. |
| **Only show highlighted run in companion chart tooltip** | Display only highlighted runs in chart tooltip. |
| **Number of runs shown in tooltips** | Display the number of runs in the tooltip. |
| **Display full run names on the primary chart tooltip** | Display the full name of the run in the chart tooltip. |
## Section settings
Section settings apply to all panels within that section. Within a workspace section you can sort panels, rearrange panels, and rename the section name.
To modify section settings, select the **action ()** menu in the upper right corner of a section.
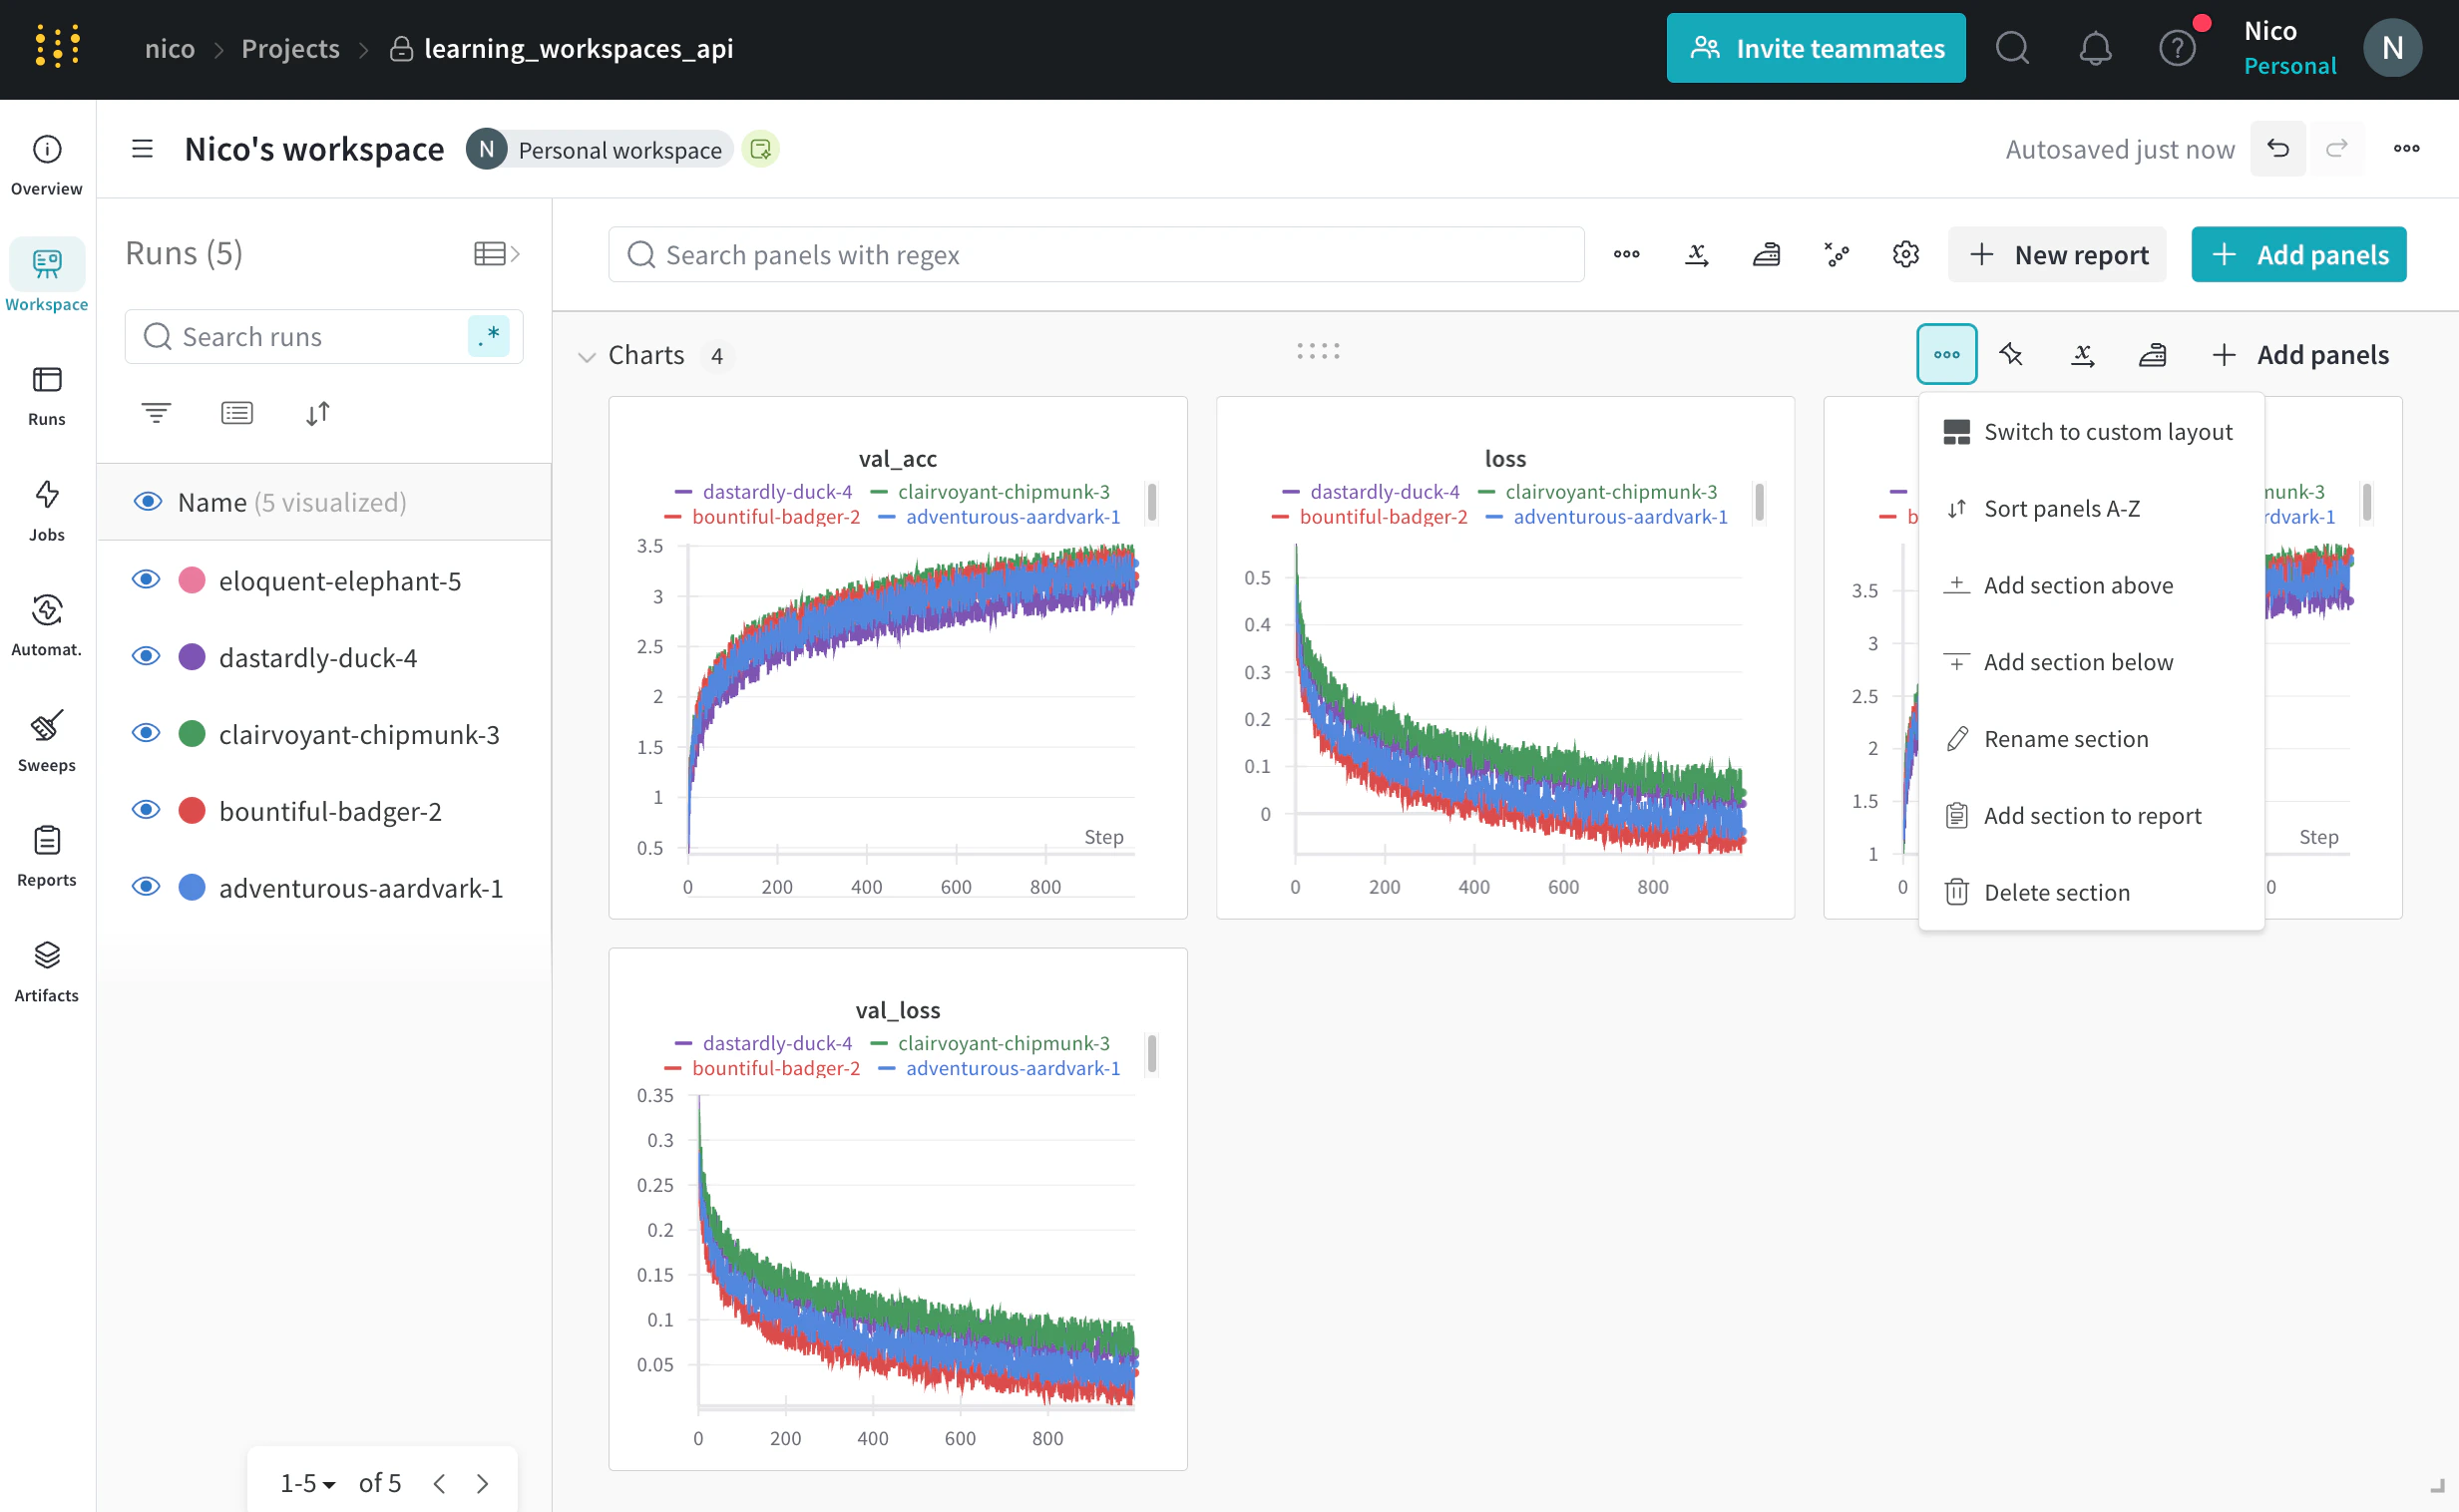 From the dropdown, you can edit the following settings that apply to the entire section:
| Section setting | Description |
| -------------------- | ----------------------------------------------------------------------- |
| **Rename a section** | Rename the name of the section. |
| **Sort panels A-Z** | Sort panels within a section alphabetically. |
| **Rearrange panels** | Select and drag a panel within a section to manually order your panels. |
The following animation demonstrates how to rearrange panels within a section:
From the dropdown, you can edit the following settings that apply to the entire section:
| Section setting | Description |
| -------------------- | ----------------------------------------------------------------------- |
| **Rename a section** | Rename the name of the section. |
| **Sort panels A-Z** | Sort panels within a section alphabetically. |
| **Rearrange panels** | Select and drag a panel within a section to manually order your panels. |
The following animation demonstrates how to rearrange panels within a section:
 Besides the settings described in the preceding table, you can also edit how sections appear in your workspaces such as **Add section below**, **Add section above**, **Delete section**, and **Add section to report**.
## Panel settings
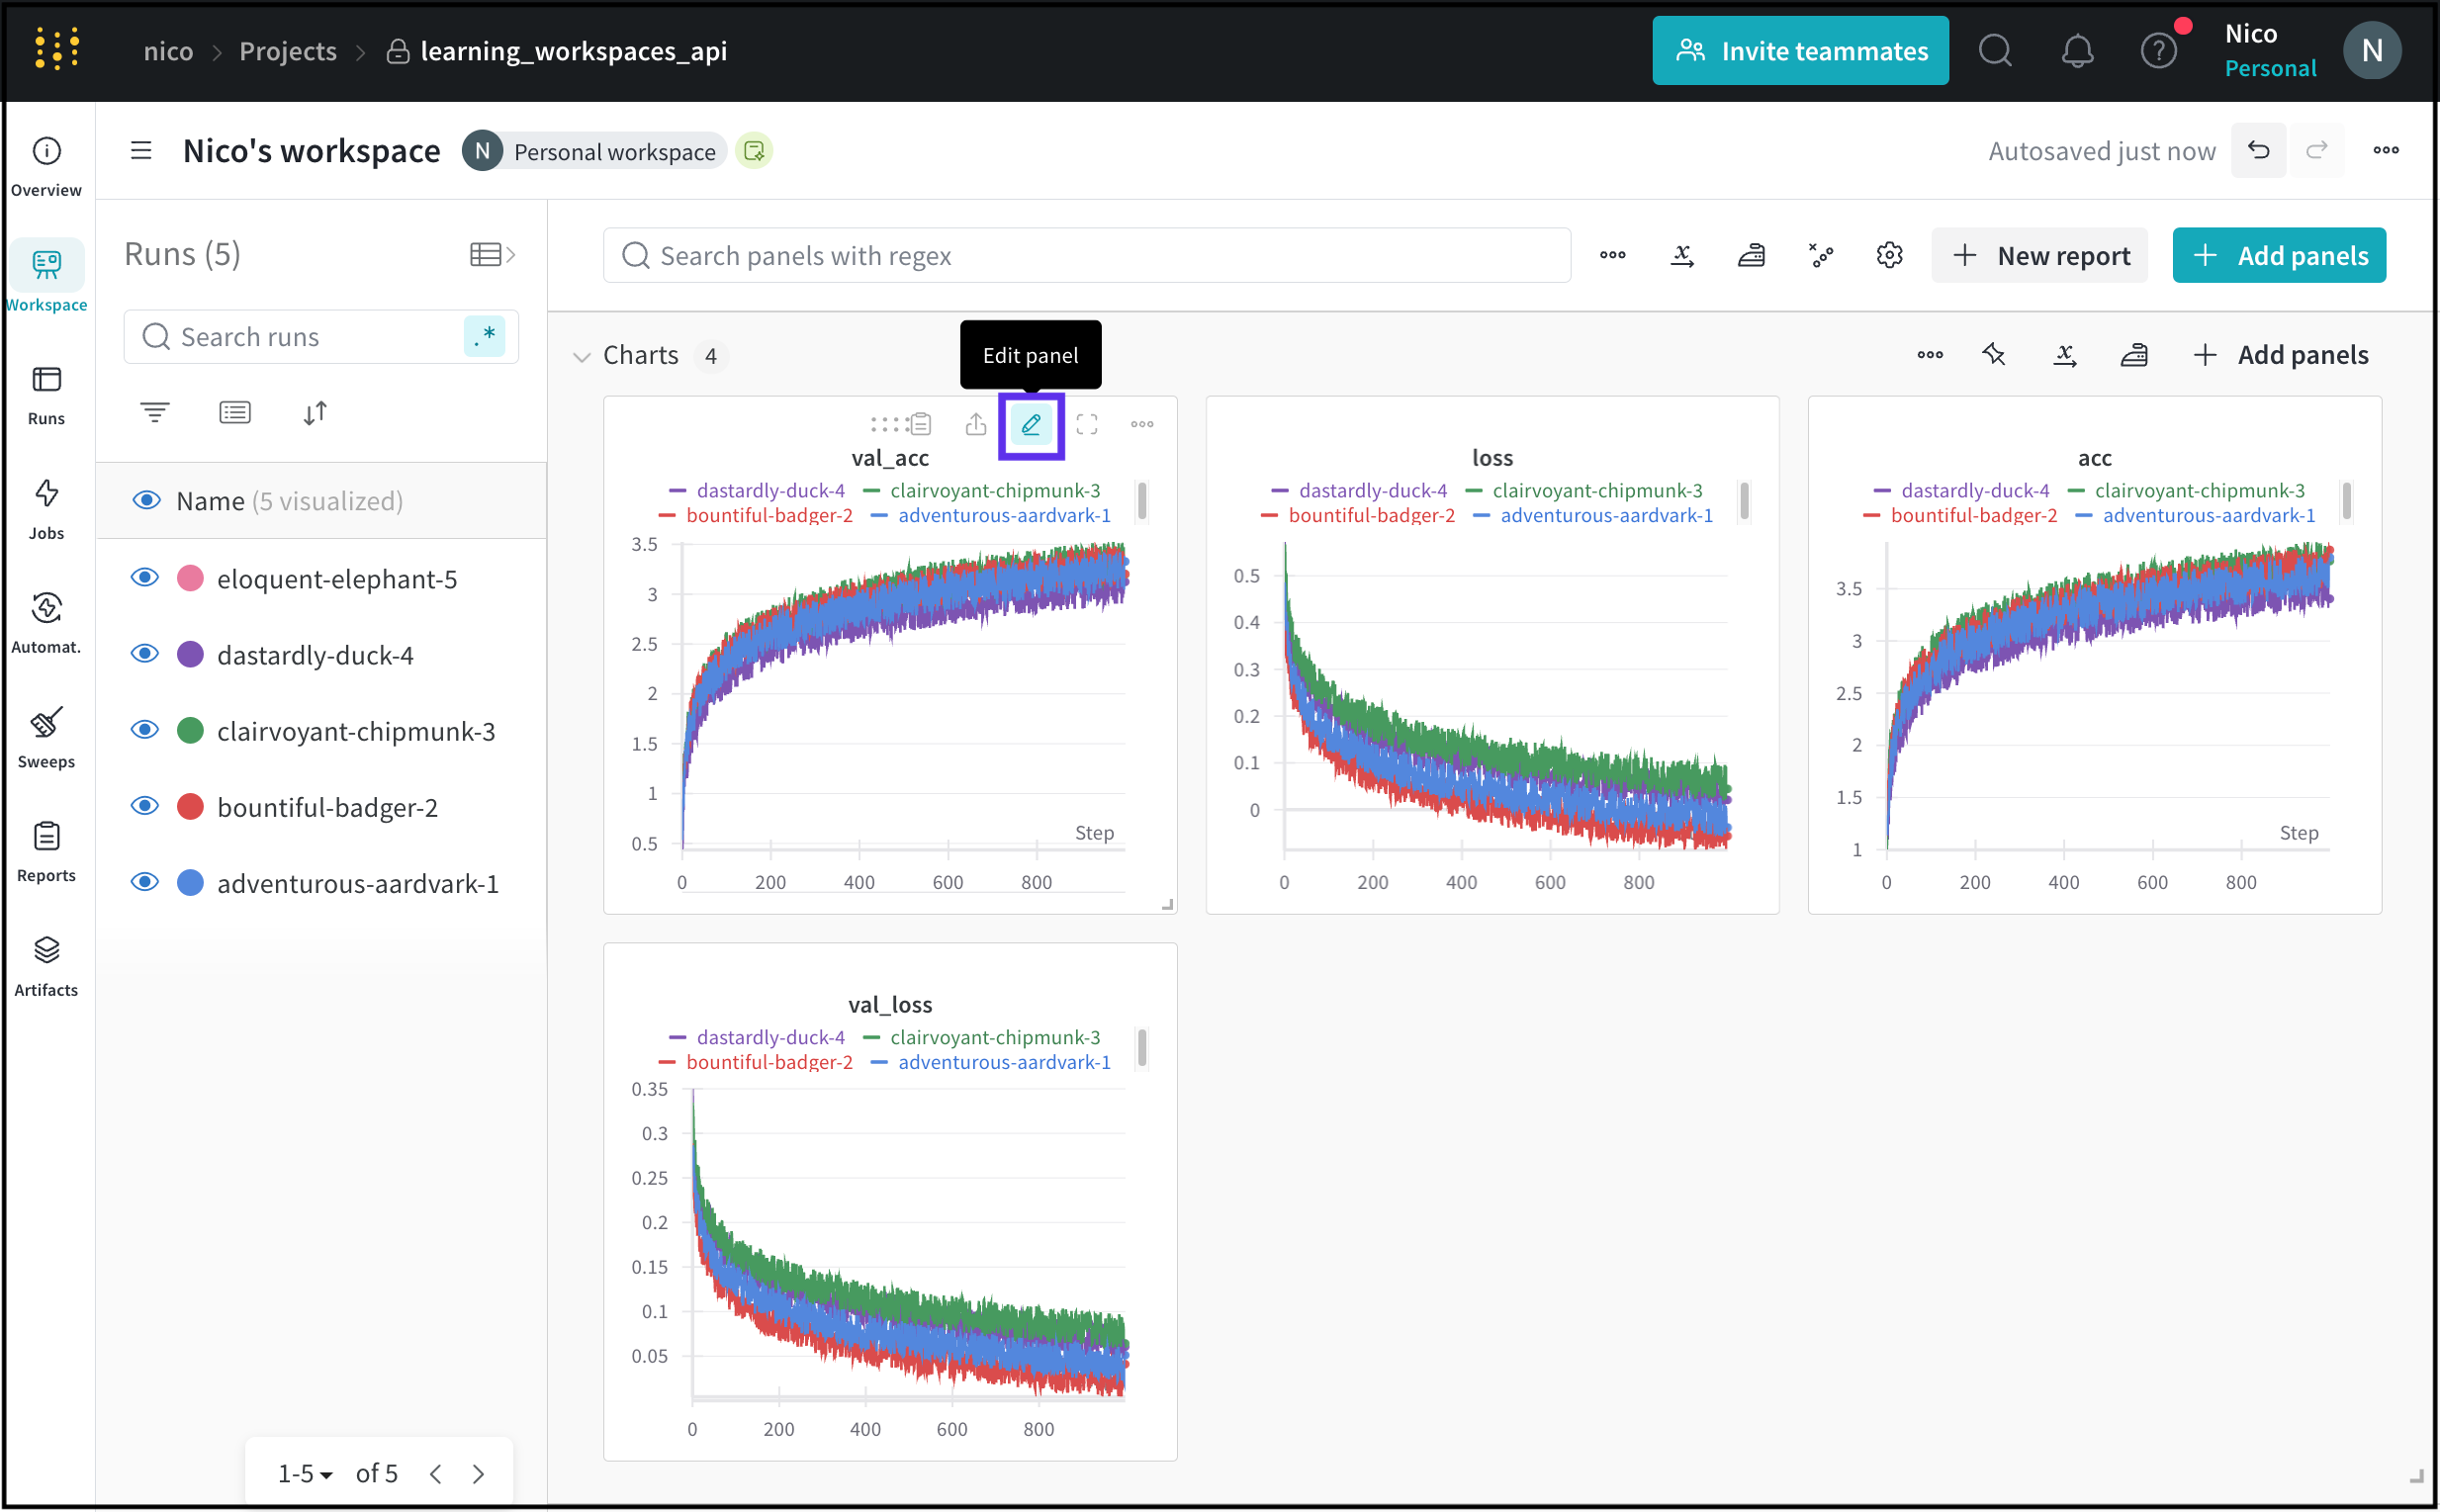
Customize an individual panel's settings to compare multiple lines on the same plot, calculate custom axes, rename labels, and more. To edit a panel's settings:
1. Hover over the panel you want to edit.
2. Select the pencil icon that appears.
Besides the settings described in the preceding table, you can also edit how sections appear in your workspaces such as **Add section below**, **Add section above**, **Delete section**, and **Add section to report**.
## Panel settings
Customize an individual panel's settings to compare multiple lines on the same plot, calculate custom axes, rename labels, and more. To edit a panel's settings:
1. Hover over the panel you want to edit.
2. Select the pencil icon that appears.
 3. Within the modal that appears, you can edit settings related to the panel's data, display preferences, and more.
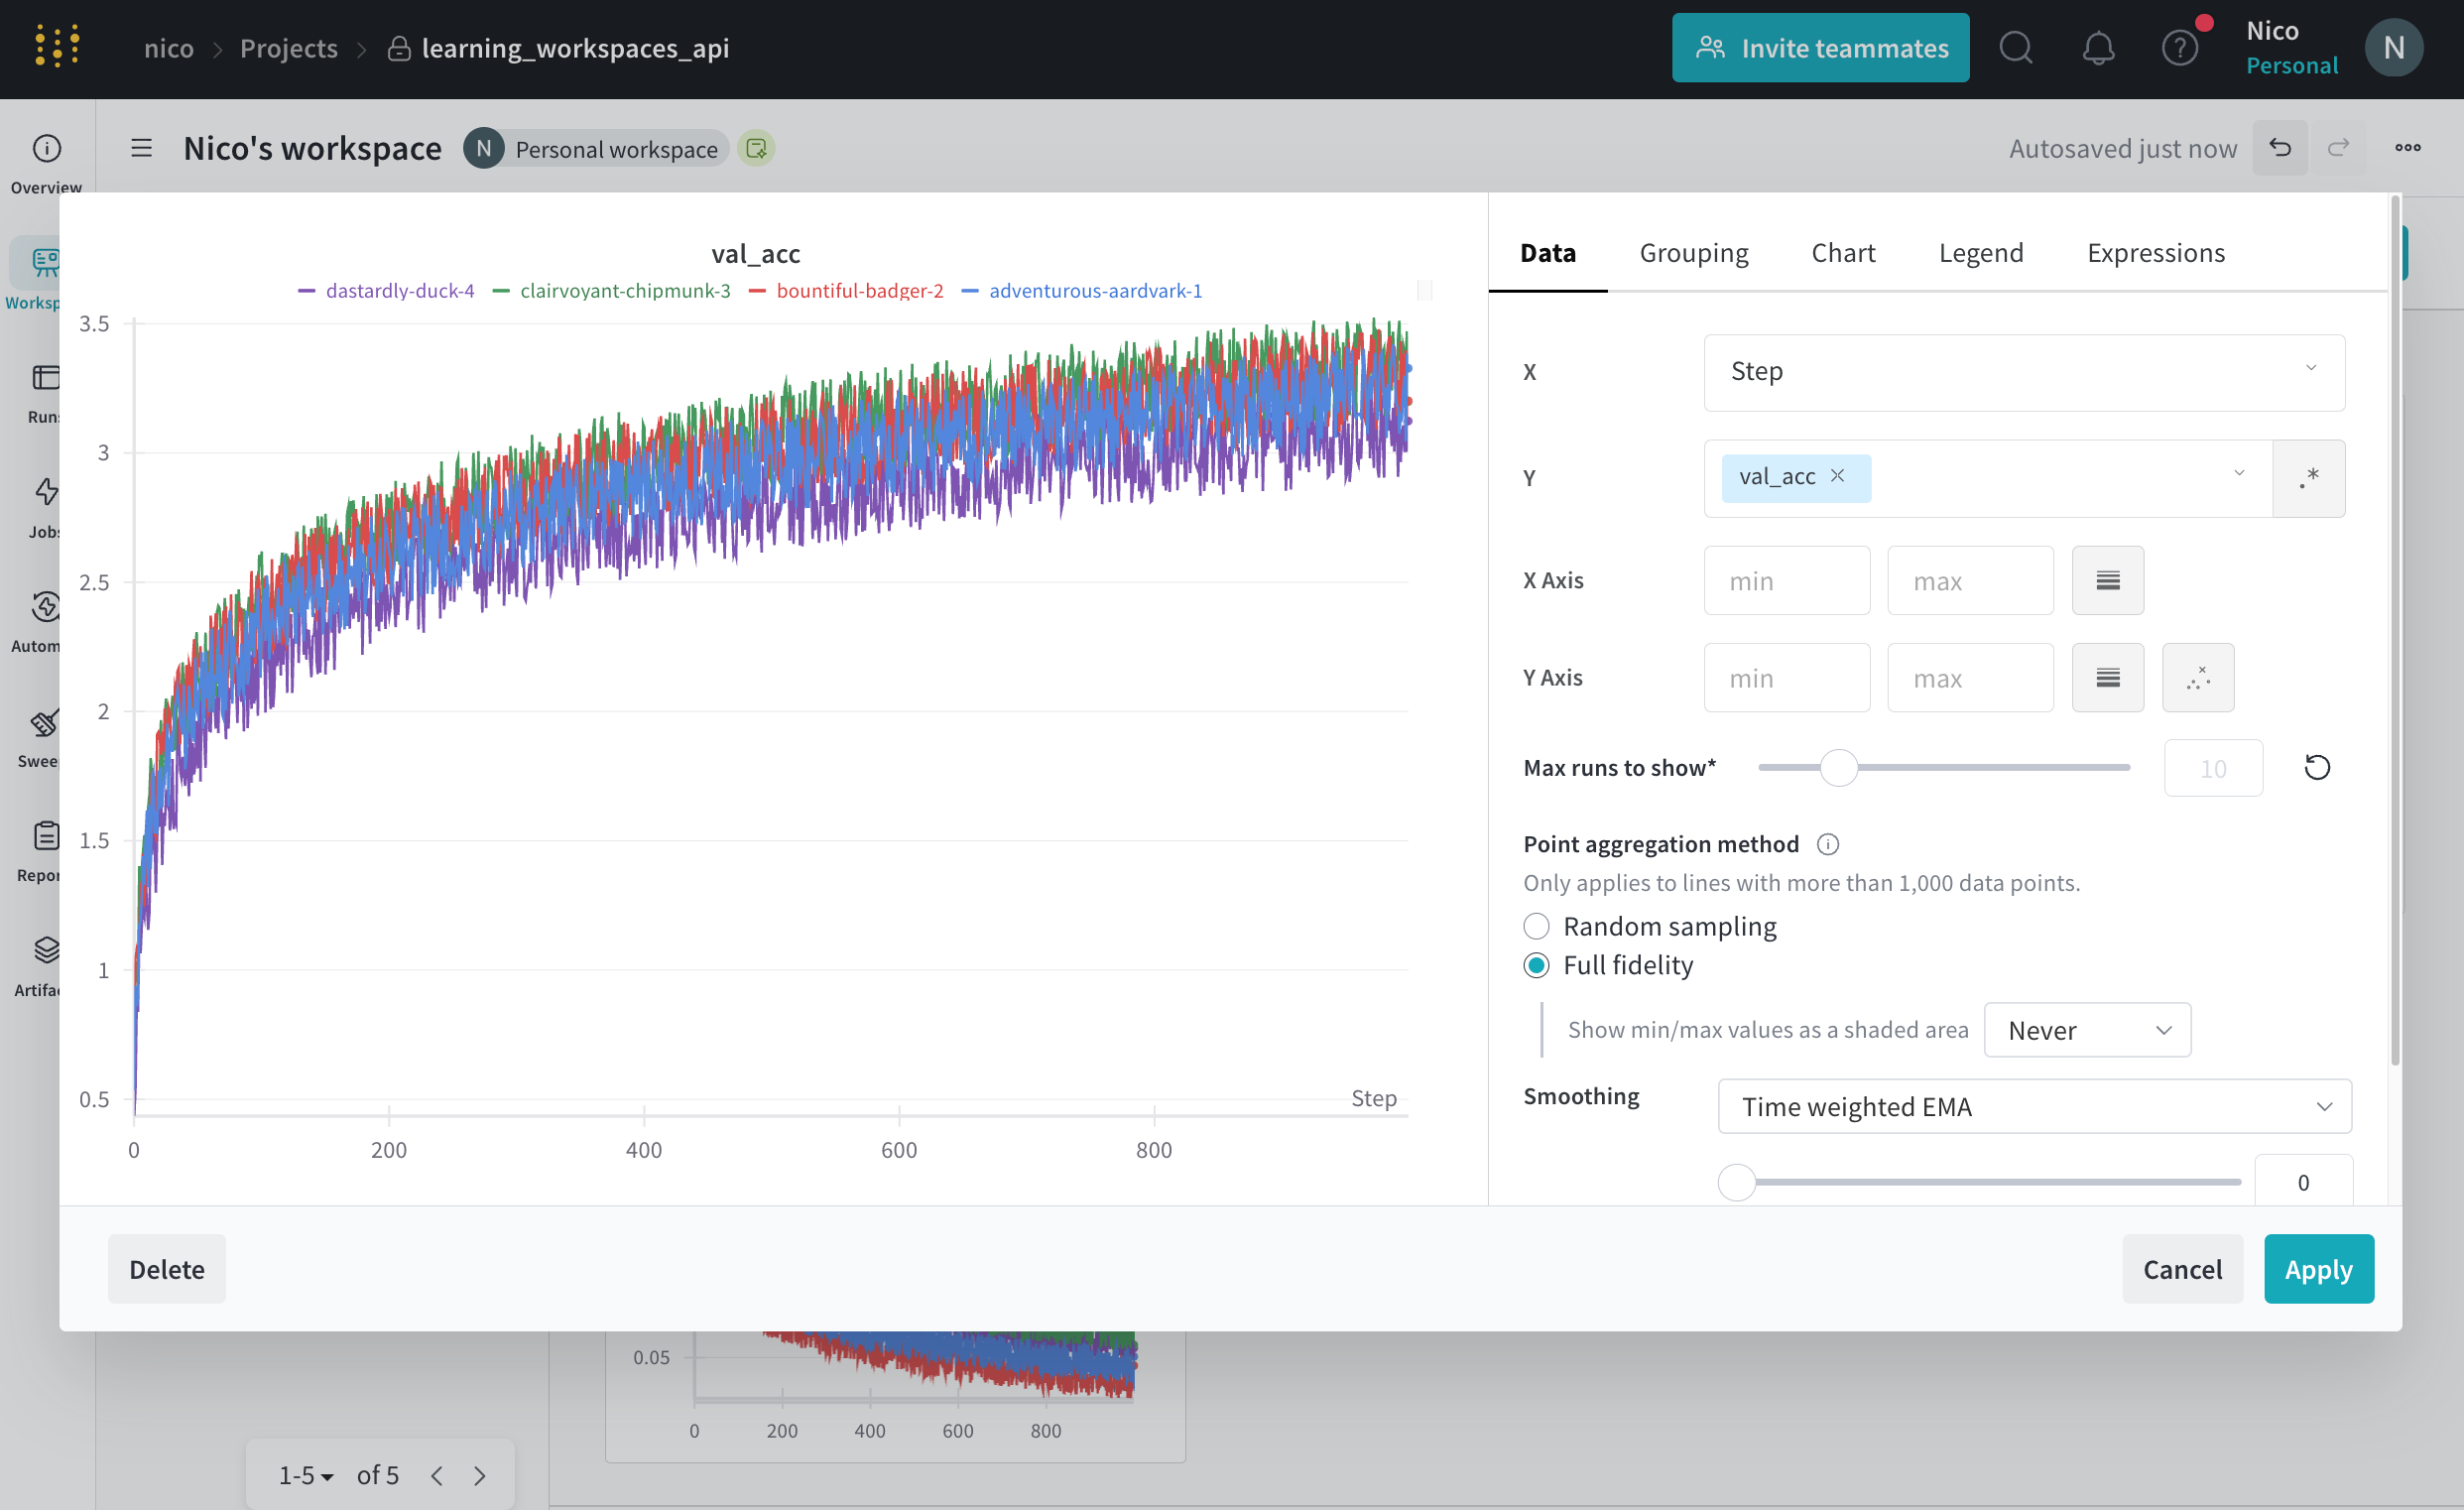 Your changes apply to that panel only and take effect when you save them. For a complete list of settings you can apply to a panel, see [Edit line panel settings](/models/app/features/panels/line-plot/#edit-line-panel-settings).