> ## Documentation Index
> Fetch the complete documentation index at: https://docs.wandb.ai/llms.txt
> Use this file to discover all available pages before exploring further.
> Integrate W&B with Kubeflow Pipelines to track experiments and visualize metrics across ML pipeline components.
# Kubeflow Pipelines (kfp)
[Kubeflow Pipelines (kfp)](https://www.kubeflow.org/docs/components/pipelines/overview/) is a platform for building and deploying portable, scalable machine learning (ML) workflows based on Docker containers.
This guide shows you how to integrate W\&B with Kubeflow Pipelines so that parameters and artifacts from your pipeline components are automatically tracked in W\&B. By the end, you can apply a decorator to kfp Python functional components to log inputs, outputs, and artifacts to W\&B without modifying the body of each component.
This feature was enabled in `wandb==0.12.11` and requires `kfp<2.0.0`.
## Sign up and create an API key
An API key authenticates your machine to W\&B. You can generate an API key from your user profile.
For a more streamlined approach, go to [User Settings](https://wandb.ai/settings) and create an API key. Copy the API key immediately and save it in a secure location such as a password manager.
1. Click your user profile icon in the upper right corner.
2. Select **User Settings**, then scroll to the **API Keys** section.
## Install the `wandb` library and log in
To install the `wandb` library locally and log in:
1. Set the `WANDB_API_KEY` [environment variable](/models/track/environment-variables/) to your API key. Replace values enclosed in `<>` with your own:
```bash theme={null}
export WANDB_API_KEY=
```
2. Install the `wandb` library and log in.
```shell theme={null}
pip install wandb
wandb login
```
```bash theme={null}
pip install wandb
```
```python theme={null}
import wandb
wandb.login()
```
```notebook theme={null}
!pip install wandb
import wandb
wandb.login()
```
## Decorate your components
With the `wandb` library installed, you can now enable W\&B tracking on individual pipeline components. Add the `@wandb_log` decorator and create your components as usual. This automatically logs the input and output parameters and artifacts to W\&B each time you run your pipeline.
```python theme={null}
from kfp import components
from wandb.integration.kfp import wandb_log
@wandb_log
def add(a: float, b: float) -> float:
return a + b
add = components.create_component_from_func(add)
```
## Pass environment variables to containers
Each pipeline component runs in its own container, so the W\&B credentials available on your local machine aren't automatically propagated to the component. You may need to explicitly pass [environment variables](/models/track/environment-variables/) to your containers so that each component can authenticate to W\&B. For two-way linking, you should also set the environment variables `WANDB_KUBEFLOW_URL` to the base URL of your Kubeflow Pipelines instance. For example, `https://kubeflow.mysite.com`.
```python theme={null}
import os
from kubernetes.client.models import V1EnvVar
def add_wandb_env_variables(op):
env = {
"WANDB_API_KEY": os.getenv("WANDB_API_KEY"),
"WANDB_BASE_URL": os.getenv("WANDB_BASE_URL"),
}
for name, value in env.items():
op = op.add_env_variable(V1EnvVar(name, value))
return op
@dsl.pipeline(name="example-pipeline")
def example_pipeline(param1: str, param2: int):
conf = dsl.get_pipeline_conf()
conf.add_op_transformer(add_wandb_env_variables)
```
## Access your data programmatically
Once your pipeline runs are logging to W\&B, you can review and retrieve the tracked data in several ways. The following sections describe how to access your runs from the Kubeflow Pipelines UI, the W\&B web app, and the W\&B Public API.
### Kubeflow Pipelines UI
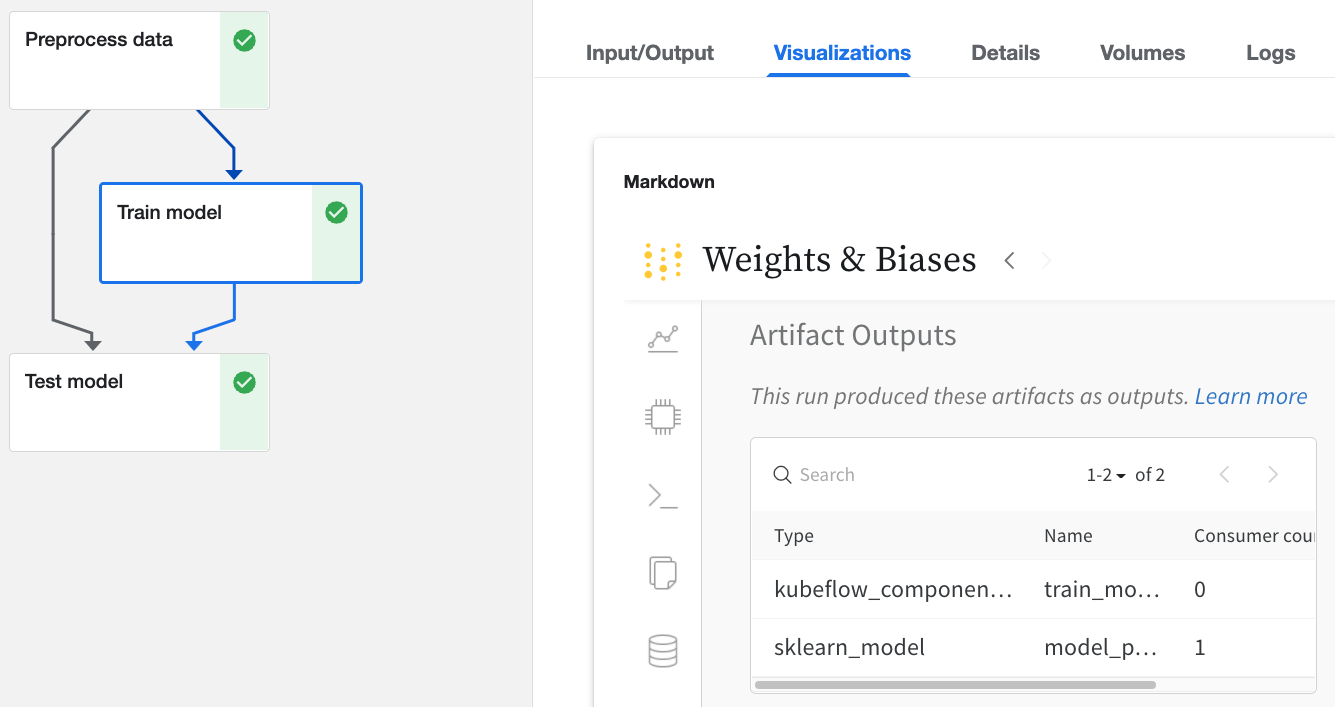
Click any run in the Kubeflow Pipelines UI that has been logged with W\&B, then:
* Find details about inputs and outputs in the **Input/Output** and **ML Metadata** tabs.
* View the W\&B web app from the **Visualizations** tab.
 ### W\&B web app UI
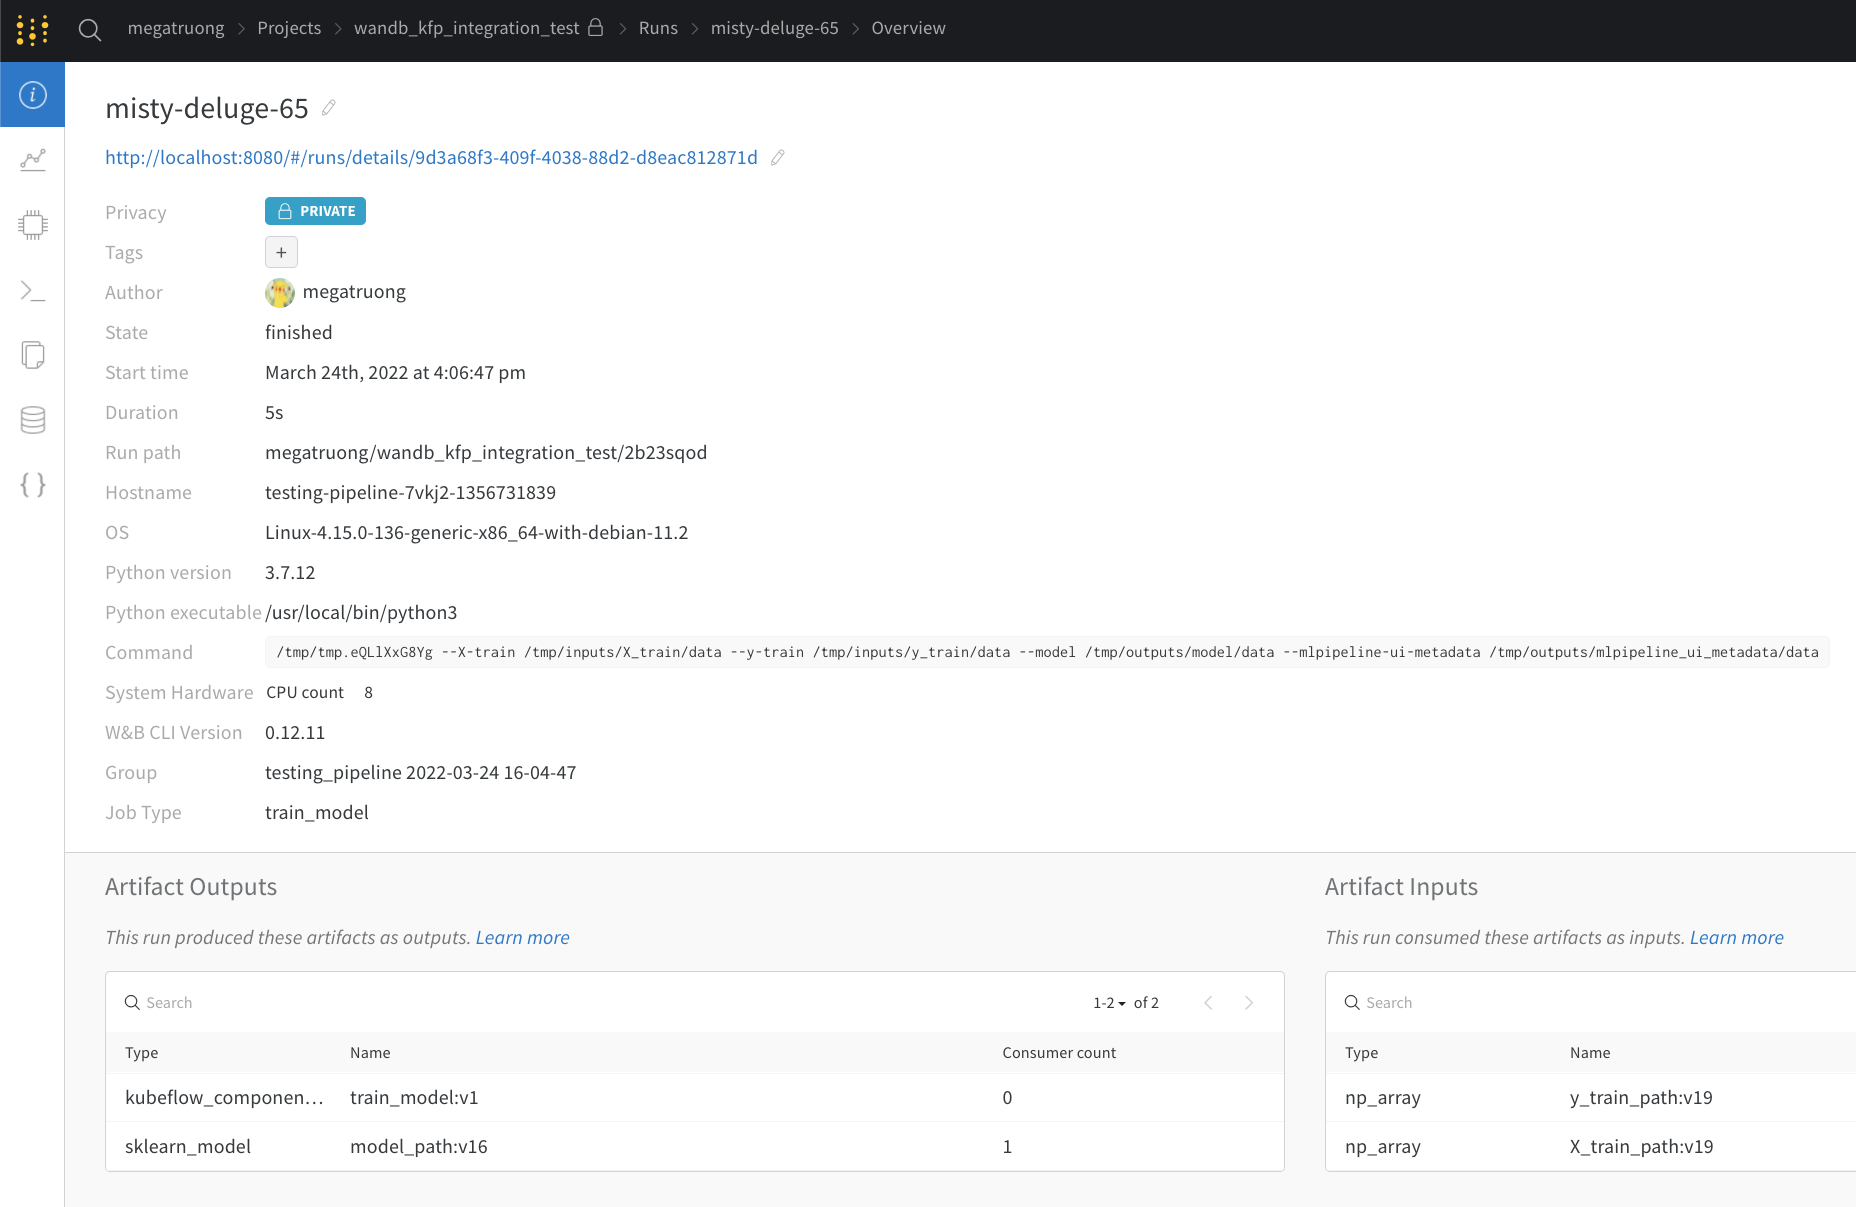
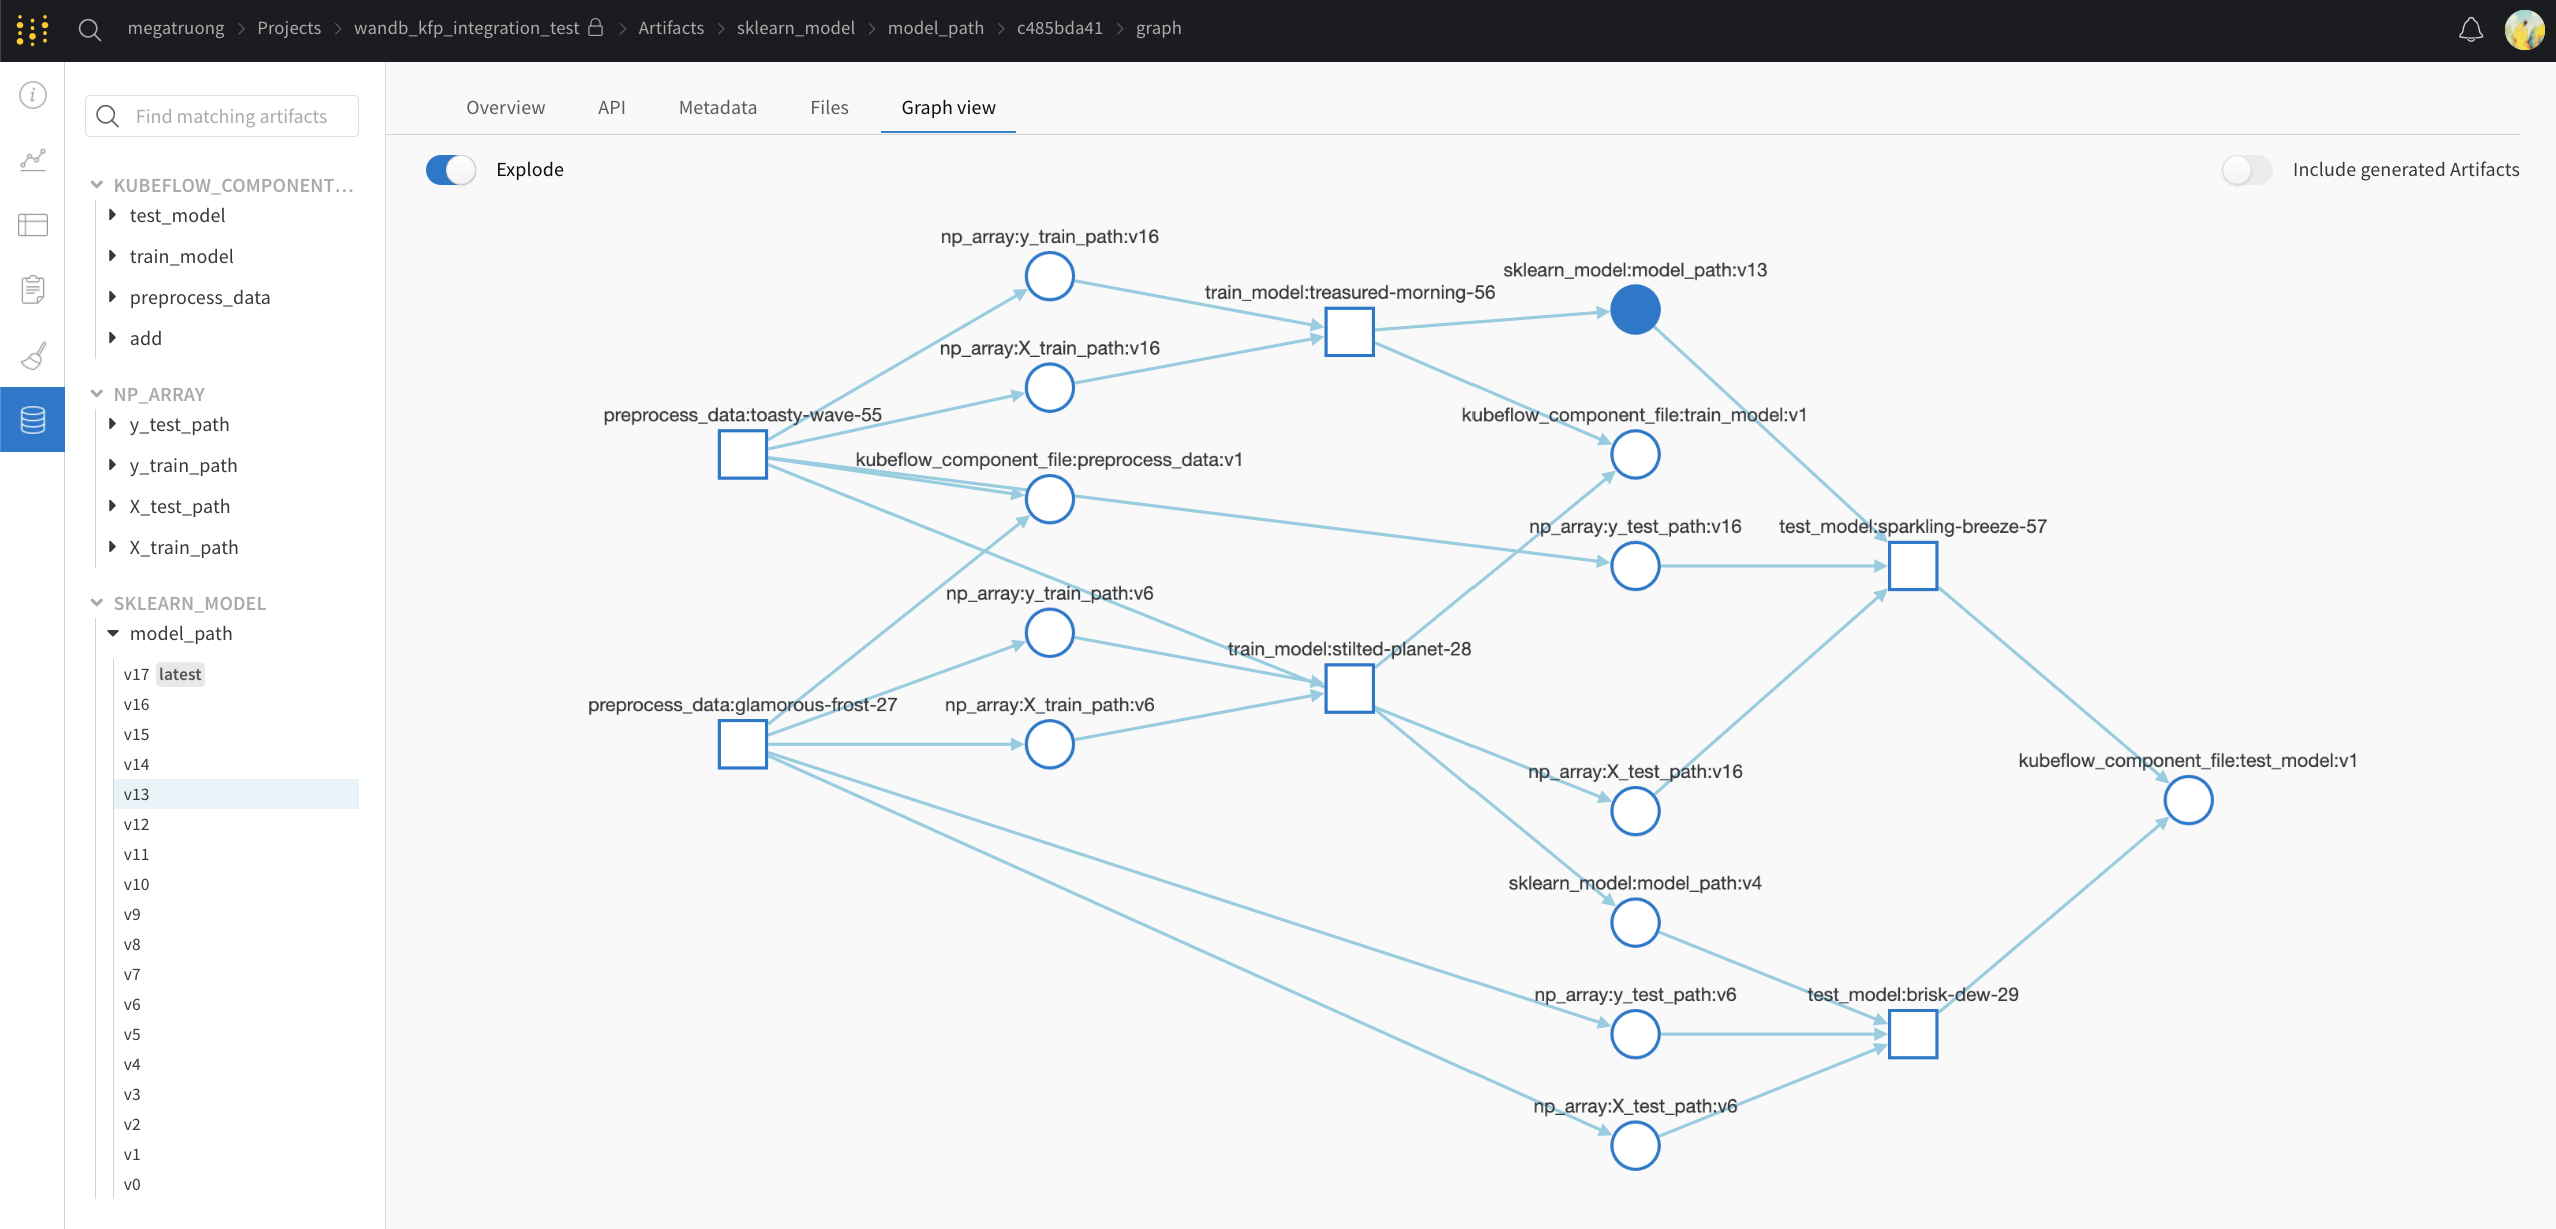
The web app UI has the same content as the **Visualizations** tab in Kubeflow Pipelines, but with more space. For details, see the [W\&B web app documentation](/models/app).
### W\&B web app UI
The web app UI has the same content as the **Visualizations** tab in Kubeflow Pipelines, but with more space. For details, see the [W\&B web app documentation](/models/app).
 ### Public API
For programmatic access, [see the Public API](/models/ref/python/public-api/).
## Concept mapping from Kubeflow Pipelines to W\&B
The following table maps Kubeflow Pipelines concepts to W\&B.
| Kubeflow Pipelines | W\&B | Location in W\&B |
| ------------------ | --------------------- | -------------------------------------------- |
| Input Scalar | [`config`](/models/) | [Overview tab](/models/runs/#overview-tab) |
| Output Scalar | [`summary`](/models/) | [Overview tab](/models/runs/#overview-tab) |
| Input Artifact | Input Artifact | [Artifacts tab](/models/runs/#artifacts-tab) |
| Output Artifact | Output Artifact | [Artifacts tab](/models/runs/#artifacts-tab) |
## Fine-grain logging
The `@wandb_log` decorator handles inputs and outputs automatically, but it doesn't capture intermediate values such as training metrics across epochs. If you want finer control of logging, you can add `wandb.log()` and `wandb.log_artifact()` calls in the component.
### With explicit `wandb.log_artifact()` calls
In the following example, you train a model. The `@wandb_log` decorator automatically tracks the relevant inputs and outputs. If you want to log the training process, you can explicitly add that logging like so:
```python theme={null}
@wandb_log
def train_model(
train_dataloader_path: components.InputPath("dataloader"),
test_dataloader_path: components.InputPath("dataloader"),
model_path: components.OutputPath("pytorch_model"),
):
with wandb.init() as run:
...
for epoch in epochs:
for batch_idx, (data, target) in enumerate(train_dataloader):
...
if batch_idx % log_interval == 0:
run.log(
{"epoch": epoch, "step": batch_idx * len(data), "loss": loss.item()}
)
...
run.log_artifact(model_artifact)
```
### With implicit `wandb` integrations
If you're using a [supported framework integration](/models/integrations), you can also pass in the callback directly:
```python theme={null}
@wandb_log
def train_model(
train_dataloader_path: components.InputPath("dataloader"),
test_dataloader_path: components.InputPath("dataloader"),
model_path: components.OutputPath("pytorch_model"),
):
from pytorch_lightning.loggers import WandbLogger
from pytorch_lightning import Trainer
trainer = Trainer(logger=WandbLogger())
... # do training
```
### Public API
For programmatic access, [see the Public API](/models/ref/python/public-api/).
## Concept mapping from Kubeflow Pipelines to W\&B
The following table maps Kubeflow Pipelines concepts to W\&B.
| Kubeflow Pipelines | W\&B | Location in W\&B |
| ------------------ | --------------------- | -------------------------------------------- |
| Input Scalar | [`config`](/models/) | [Overview tab](/models/runs/#overview-tab) |
| Output Scalar | [`summary`](/models/) | [Overview tab](/models/runs/#overview-tab) |
| Input Artifact | Input Artifact | [Artifacts tab](/models/runs/#artifacts-tab) |
| Output Artifact | Output Artifact | [Artifacts tab](/models/runs/#artifacts-tab) |
## Fine-grain logging
The `@wandb_log` decorator handles inputs and outputs automatically, but it doesn't capture intermediate values such as training metrics across epochs. If you want finer control of logging, you can add `wandb.log()` and `wandb.log_artifact()` calls in the component.
### With explicit `wandb.log_artifact()` calls
In the following example, you train a model. The `@wandb_log` decorator automatically tracks the relevant inputs and outputs. If you want to log the training process, you can explicitly add that logging like so:
```python theme={null}
@wandb_log
def train_model(
train_dataloader_path: components.InputPath("dataloader"),
test_dataloader_path: components.InputPath("dataloader"),
model_path: components.OutputPath("pytorch_model"),
):
with wandb.init() as run:
...
for epoch in epochs:
for batch_idx, (data, target) in enumerate(train_dataloader):
...
if batch_idx % log_interval == 0:
run.log(
{"epoch": epoch, "step": batch_idx * len(data), "loss": loss.item()}
)
...
run.log_artifact(model_artifact)
```
### With implicit `wandb` integrations
If you're using a [supported framework integration](/models/integrations), you can also pass in the callback directly:
```python theme={null}
@wandb_log
def train_model(
train_dataloader_path: components.InputPath("dataloader"),
test_dataloader_path: components.InputPath("dataloader"),
model_path: components.OutputPath("pytorch_model"),
):
from pytorch_lightning.loggers import WandbLogger
from pytorch_lightning import Trainer
trainer = Trainer(logger=WandbLogger())
... # do training
```