> ## Documentation Index
> Fetch the complete documentation index at: https://docs.wandb.ai/llms.txt
> Use this file to discover all available pages before exploring further.
> Integrate W&B with Prodigy to track annotation workflows, log training metrics, and manage labeled datasets.
# Prodigy
[Prodigy](https://prodi.gy/) is an annotation tool for creating training and evaluation data for machine learning models, error analysis, and data inspection and cleaning. [W\&B Tables](/models/tables/tables-walkthrough/) let you log, visualize, analyze, and share datasets (and more) inside W\&B.
This guide shows you how to use the [W\&B integration with Prodigy](https://github.com/wandb/wandb/blob/master/wandb/integration/prodigy/prodigy.py) to upload your Prodigy-annotated dataset directly to W\&B so you can explore and share it as an interactive Table. Use this when you want to inspect annotation quality, compare versions of a labeled dataset, or share results with collaborators.
With a few lines of code, like these:
```python theme={null}
import wandb
from wandb.integration.prodigy import upload_dataset
with wandb.init(project="prodigy"):
upload_dataset("news_headlines_ner")
```
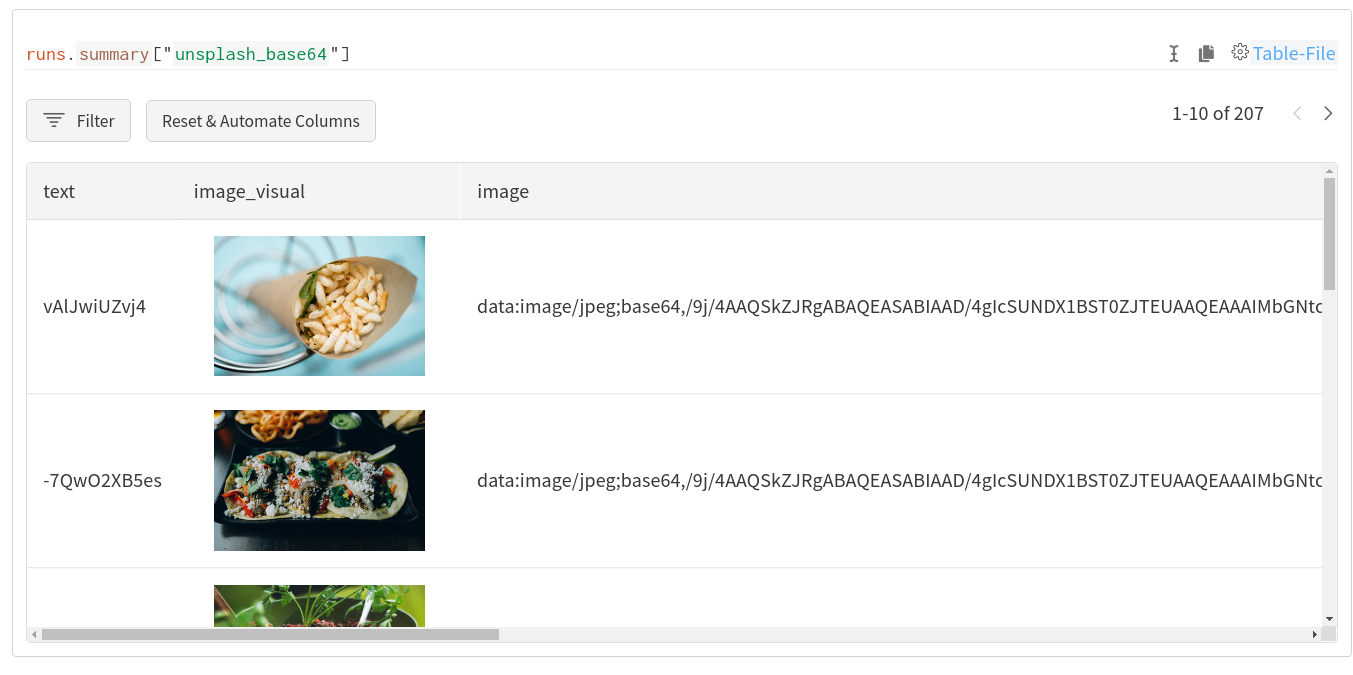
you can produce visual, interactive, shareable tables like this one:
 ## Quickstart
Use `wandb.integration.prodigy.upload_dataset` to upload your annotated Prodigy dataset directly from the local Prodigy database to W\&B in the [Table](/models/ref/python/data-types/table) format. For more information about Prodigy, including installation and setup, see the [Prodigy documentation](https://prodi.gy/docs/).
When you upload a dataset, W\&B automatically converts images and named entity fields to [`wandb.Image`](/models/ref/python/data-types/image) and [`wandb.Html`](/models/ref/python/data-types/html) respectively, so they render as interactive visualizations in your Table. W\&B may add extra columns to the resulting table to include these visualizations.
## Read through a detailed example
To see what's possible with the integration, explore the [Visualizing Prodigy Datasets Using W\&B Tables](https://wandb.ai/kshen/prodigy/reports/Visualizing-Prodigy-Datasets-Using-W-B-Tables--Vmlldzo5NDE2MTc) report for example visualizations generated with the W\&B Prodigy integration.
## Quickstart
Use `wandb.integration.prodigy.upload_dataset` to upload your annotated Prodigy dataset directly from the local Prodigy database to W\&B in the [Table](/models/ref/python/data-types/table) format. For more information about Prodigy, including installation and setup, see the [Prodigy documentation](https://prodi.gy/docs/).
When you upload a dataset, W\&B automatically converts images and named entity fields to [`wandb.Image`](/models/ref/python/data-types/image) and [`wandb.Html`](/models/ref/python/data-types/html) respectively, so they render as interactive visualizations in your Table. W\&B may add extra columns to the resulting table to include these visualizations.
## Read through a detailed example
To see what's possible with the integration, explore the [Visualizing Prodigy Datasets Using W\&B Tables](https://wandb.ai/kshen/prodigy/reports/Visualizing-Prodigy-Datasets-Using-W-B-Tables--Vmlldzo5NDE2MTc) report for example visualizations generated with the W\&B Prodigy integration.