> ## Documentation Index
> Fetch the complete documentation index at: https://docs.wandb.ai/llms.txt
> Use this file to discover all available pages before exploring further.
# PyTorch Geometric
> Integrate W&B with PyTorch Geometric for graph visualization and experiment tracking in geometric deep learning.
[PyTorch Geometric](https://github.com/pyg-team/pytorch_geometric) or PyG is one of the most popular libraries for geometric deep learning and W\&B works extremely well with it for visualizing graphs and tracking experiments.
After you have installed PyTorch Geometric, follow these steps to get started.
## Sign up and create an API key
An API key authenticates your machine to W\&B. You can generate an API key from your user profile.
For a more streamlined approach, create an API key by going directly to [User Settings](https://wandb.ai/settings). Copy the newly created API key immediately and save it in a secure location such as a password manager.
1. Click your user profile icon in the upper right corner.
2. Select **User Settings**, then scroll to the **API Keys** section.
## Install the `wandb` library and log in
To install the `wandb` library locally and log in:
1. Set the `WANDB_API_KEY` [environment variable](/models/track/environment-variables/) to your API key.
```bash theme={null}
export WANDB_API_KEY=
```
2. Install the `wandb` library and log in.
```shell theme={null}
pip install wandb
wandb login
```
```bash theme={null}
pip install wandb
```
```python theme={null}
import wandb
wandb.login()
```
```notebook theme={null}
!pip install wandb
import wandb
wandb.login()
```
## Visualize the graphs
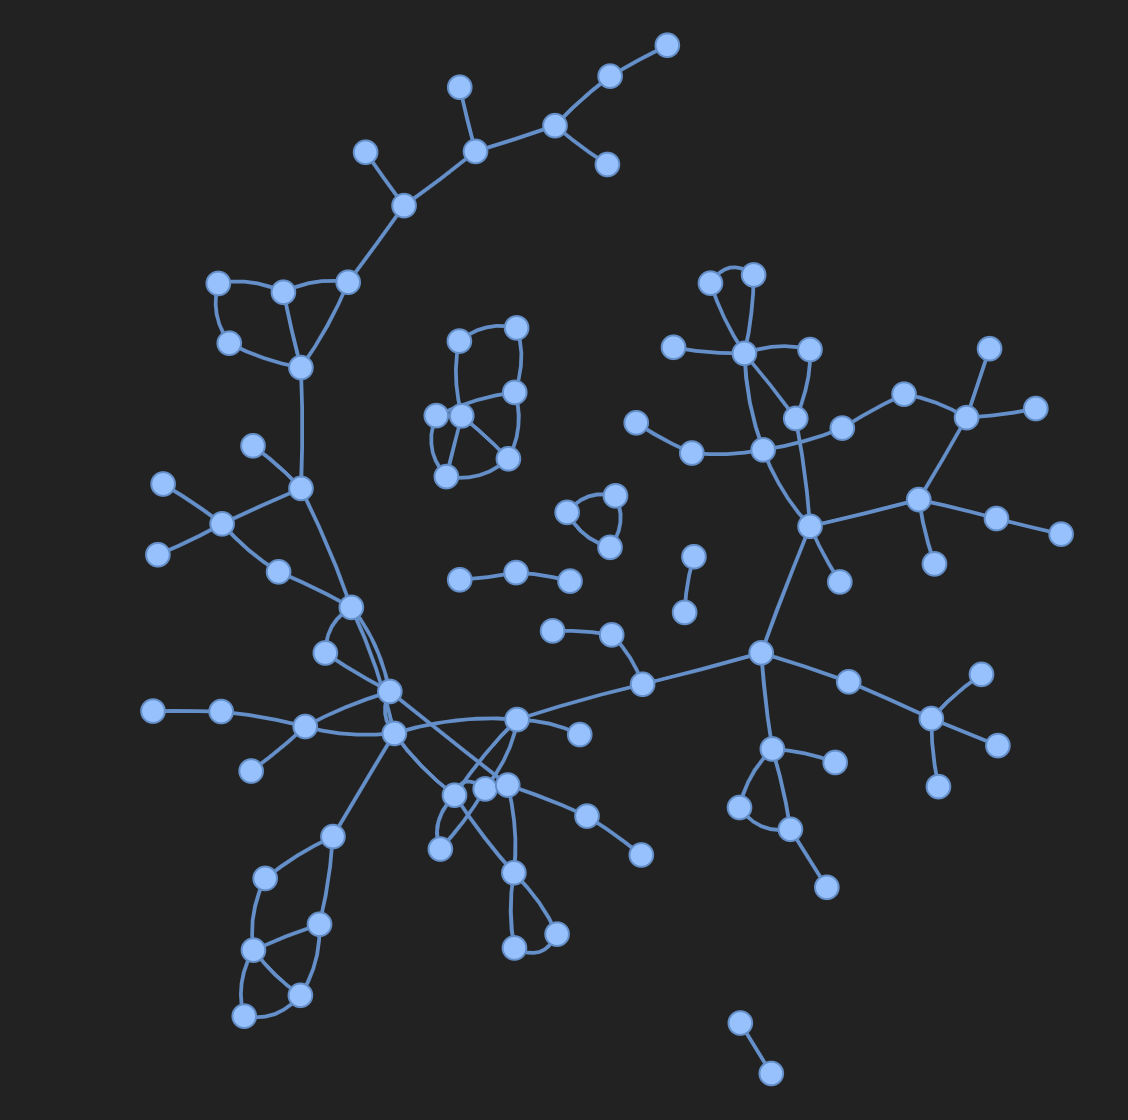
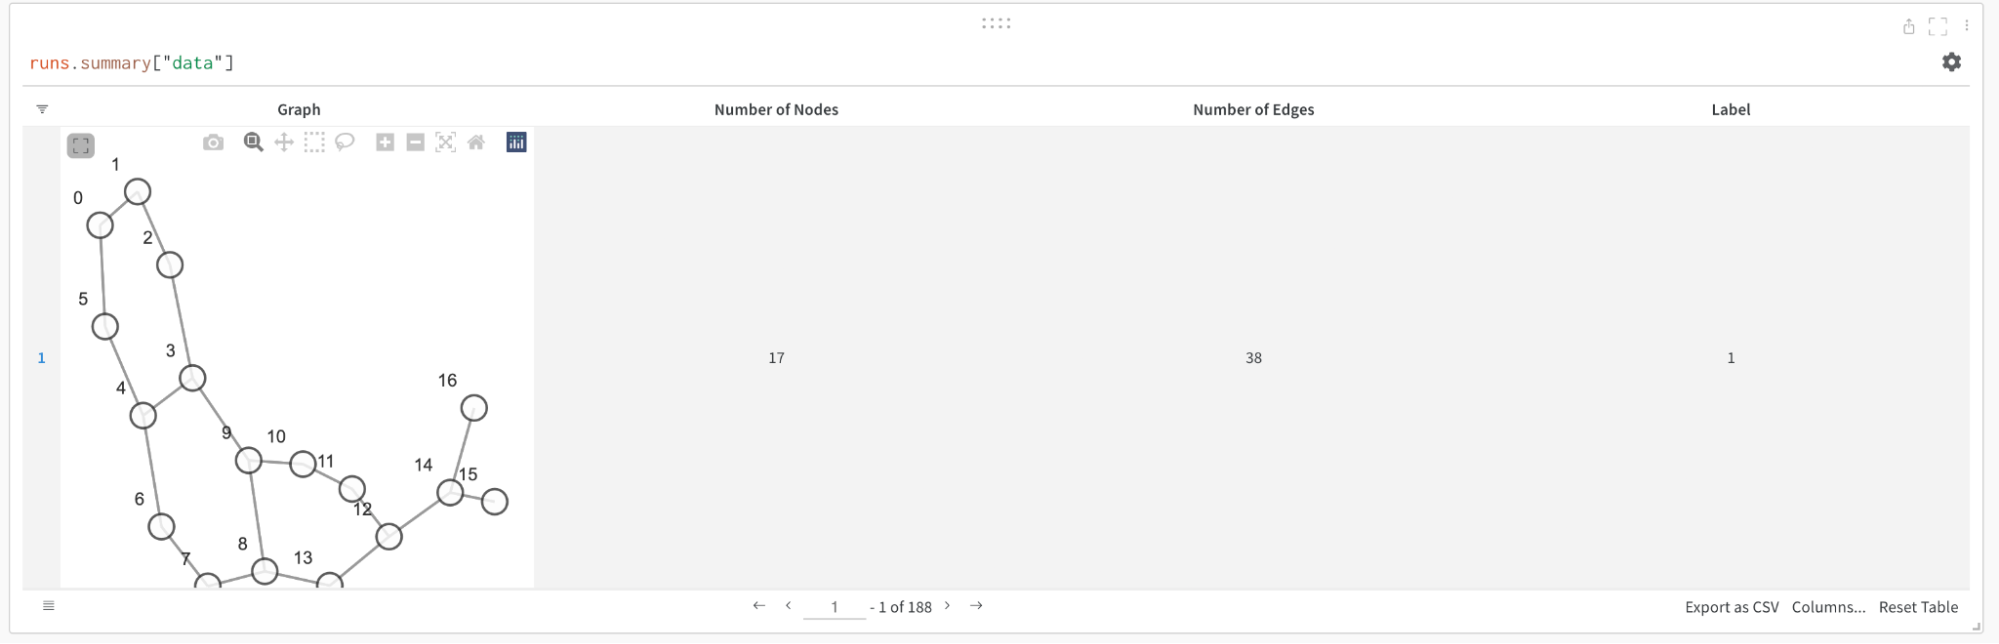
You can save details about the input graphs including number of edges, number of nodes and more. W\&B supports logging plotly charts and HTML panels so any visualizations you create for your graph can then also be logged to W\&B.
### Use PyVis
The following snippet shows how you could do that with PyVis and HTML.
```python theme={null}
from pyvis.network import Network
import wandb
with wandb.init(project=’graph_vis’) as run:
net = Network(height="750px", width="100%", bgcolor="#222222", font_color="white")
# Add the edges from the PyG graph to the PyVis network
for e in tqdm(g.edge_index.T):
src = e[0].item()
dst = e[1].item()
net.add_node(dst)
net.add_node(src)
net.add_edge(src, dst, value=0.1)
# Save the PyVis visualisation to a HTML file
net.show("graph.html")
run.log({"eda/graph": wandb.Html("graph.html")})
```
 ### Use Plotly
To use plotly to create a graph visualization, first you need to convert the PyG graph to a networkx object. Following this you will need to create Plotly scatter plots for both nodes and edges. The snippet below can be used for this task.
```python theme={null}
def create_vis(graph):
G = to_networkx(graph)
pos = nx.spring_layout(G)
edge_x = []
edge_y = []
for edge in G.edges():
x0, y0 = pos[edge[0]]
x1, y1 = pos[edge[1]]
edge_x.append(x0)
edge_x.append(x1)
edge_x.append(None)
edge_y.append(y0)
edge_y.append(y1)
edge_y.append(None)
edge_trace = go.Scatter(
x=edge_x, y=edge_y,
line=dict(width=0.5, color='#888'),
hoverinfo='none',
mode='lines'
)
node_x = []
node_y = []
for node in G.nodes():
x, y = pos[node]
node_x.append(x)
node_y.append(y)
node_trace = go.Scatter(
x=node_x, y=node_y,
mode='markers',
hoverinfo='text',
line_width=2
)
fig = go.Figure(data=[edge_trace, node_trace], layout=go.Layout())
return fig
with wandb.init(project=’visualize_graph’) as run:
run.log({‘graph’: wandb.Plotly(create_vis(graph))})
```
### Use Plotly
To use plotly to create a graph visualization, first you need to convert the PyG graph to a networkx object. Following this you will need to create Plotly scatter plots for both nodes and edges. The snippet below can be used for this task.
```python theme={null}
def create_vis(graph):
G = to_networkx(graph)
pos = nx.spring_layout(G)
edge_x = []
edge_y = []
for edge in G.edges():
x0, y0 = pos[edge[0]]
x1, y1 = pos[edge[1]]
edge_x.append(x0)
edge_x.append(x1)
edge_x.append(None)
edge_y.append(y0)
edge_y.append(y1)
edge_y.append(None)
edge_trace = go.Scatter(
x=edge_x, y=edge_y,
line=dict(width=0.5, color='#888'),
hoverinfo='none',
mode='lines'
)
node_x = []
node_y = []
for node in G.nodes():
x, y = pos[node]
node_x.append(x)
node_y.append(y)
node_trace = go.Scatter(
x=node_x, y=node_y,
mode='markers',
hoverinfo='text',
line_width=2
)
fig = go.Figure(data=[edge_trace, node_trace], layout=go.Layout())
return fig
with wandb.init(project=’visualize_graph’) as run:
run.log({‘graph’: wandb.Plotly(create_vis(graph))})
```
 ## Log metrics
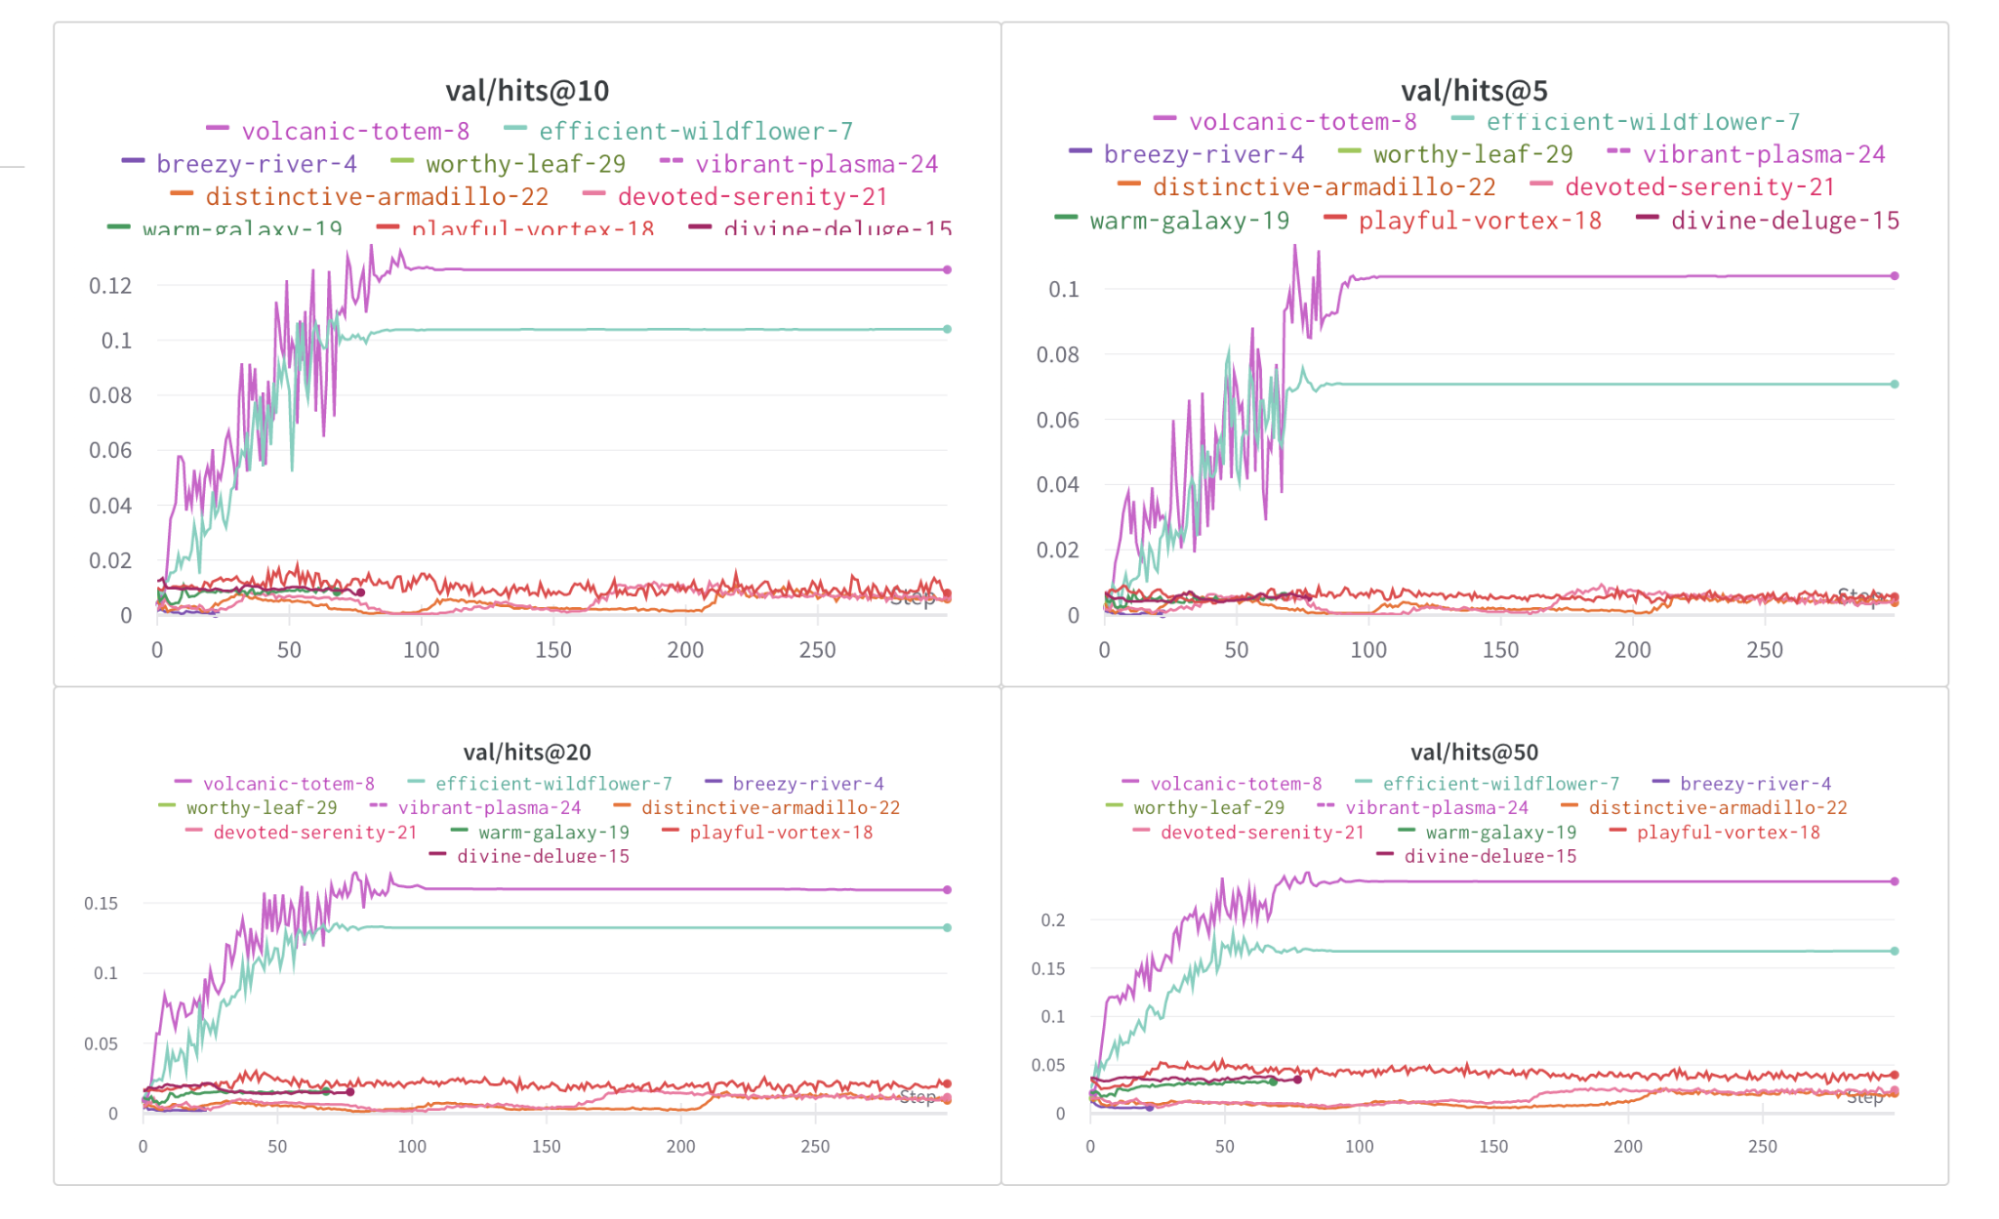
You can use W\&B to track your experiments and related metrics, such as loss functions, accuracy, and more. Add the following line to your training loop:
```python theme={null}
with wandb.init(project="my_project", entity="my_entity") as run:
run.log({
'train/loss': training_loss,
'train/acc': training_acc,
'val/loss': validation_loss,
'val/acc': validation_acc
})
```
## Log metrics
You can use W\&B to track your experiments and related metrics, such as loss functions, accuracy, and more. Add the following line to your training loop:
```python theme={null}
with wandb.init(project="my_project", entity="my_entity") as run:
run.log({
'train/loss': training_loss,
'train/acc': training_acc,
'val/loss': validation_loss,
'val/acc': validation_acc
})
```
 ## More resources
* [Recommending Amazon Products using Graph Neural Networks in PyTorch Geometric](https://wandb.ai/manan-goel/gnn-recommender/reports/Recommending-Amazon-Products-using-Graph-Neural-Networks-in-PyTorch-Geometric--VmlldzozMTA3MzYw#what-does-the-data-look-like?)
* [Point Cloud Classification using PyTorch Geometric](https://wandb.ai/geekyrakshit/pyg-point-cloud/reports/Point-Cloud-Classification-using-PyTorch-Geometric--VmlldzozMTExMTE3)
* [Point Cloud Segmentation using PyTorch Geometric](https://wandb.ai/wandb/point-cloud-segmentation/reports/Point-Cloud-Segmentation-using-Dynamic-Graph-CNN--VmlldzozMTk5MDcy)
## More resources
* [Recommending Amazon Products using Graph Neural Networks in PyTorch Geometric](https://wandb.ai/manan-goel/gnn-recommender/reports/Recommending-Amazon-Products-using-Graph-Neural-Networks-in-PyTorch-Geometric--VmlldzozMTA3MzYw#what-does-the-data-look-like?)
* [Point Cloud Classification using PyTorch Geometric](https://wandb.ai/geekyrakshit/pyg-point-cloud/reports/Point-Cloud-Classification-using-PyTorch-Geometric--VmlldzozMTExMTE3)
* [Point Cloud Segmentation using PyTorch Geometric](https://wandb.ai/wandb/point-cloud-segmentation/reports/Point-Cloud-Segmentation-using-Dynamic-Graph-CNN--VmlldzozMTk5MDcy)