> ## Documentation Index
> Fetch the complete documentation index at: https://docs.wandb.ai/llms.txt
> Use this file to discover all available pages before exploring further.
> Explore example W&B Reports showcasing use cases like experiment summaries, team collaboration, and sharing findings.
# Example reports
This page showcases example W\&B Reports that demonstrate common use cases, including capturing experiment notes, collaborating with colleagues, and tracking project work logs. Use these examples as inspiration for structuring your own reports.
The following sections describe common report patterns and link to example reports for each.
## Notes: Add a visualization with a quick summary
Capture an important observation, an idea for future work, or a milestone reached in the development of a project. All experiment runs in your report link to their parameters, metrics, logs, and code, so you can save the full context of your work.
Jot down some text and pull in relevant charts to illustrate your insight.
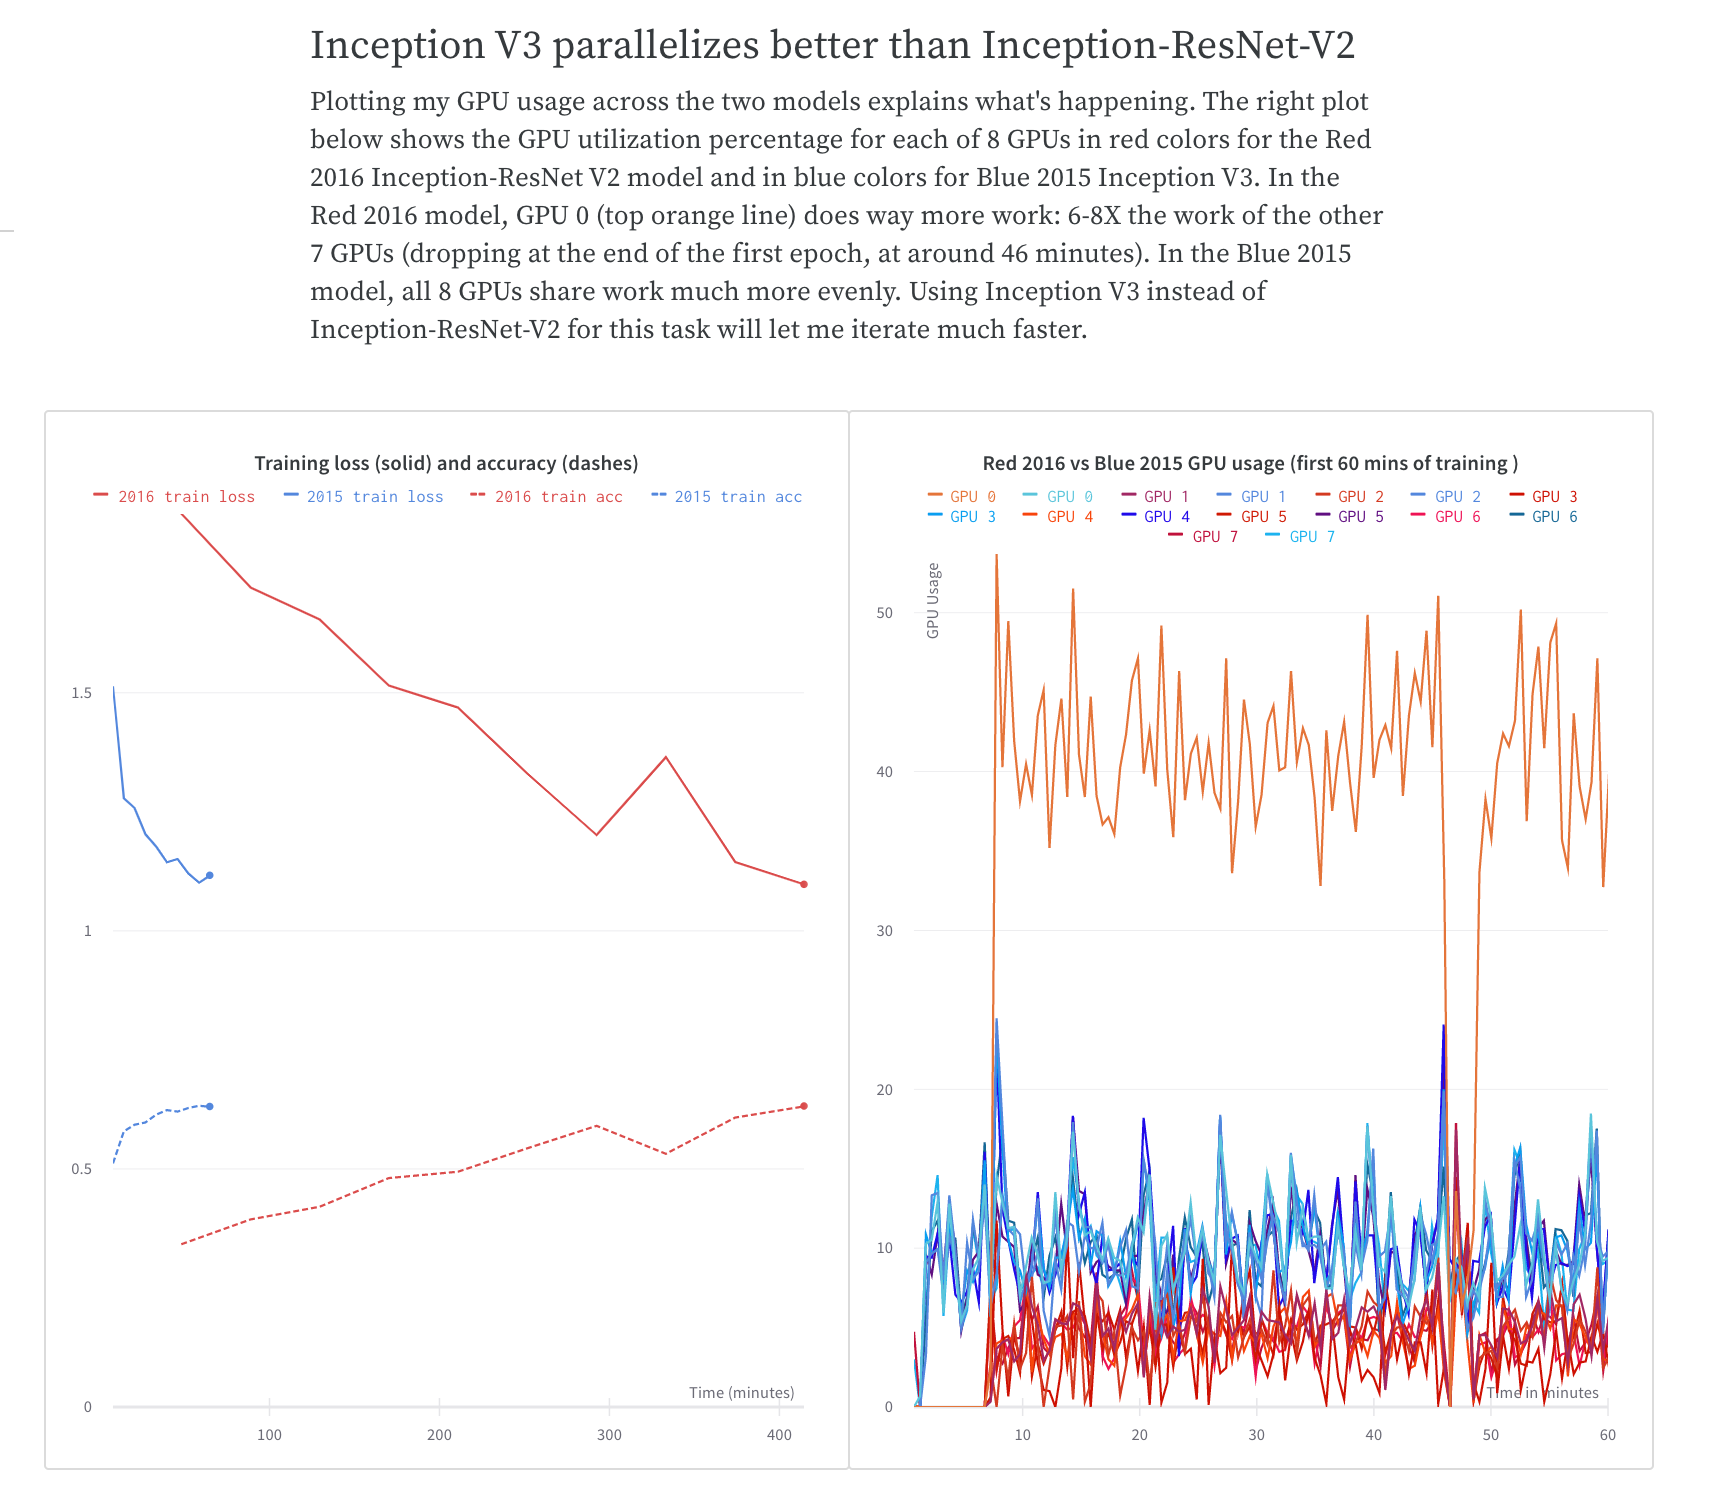
See the [What To Do When Inception-ResNet-V2 Is Too Slow](https://wandb.ai/stacey/estuary/reports/When-Inception-ResNet-V2-is-too-slow--Vmlldzo3MDcxMA) report for an example of how you can share comparisons of training time.
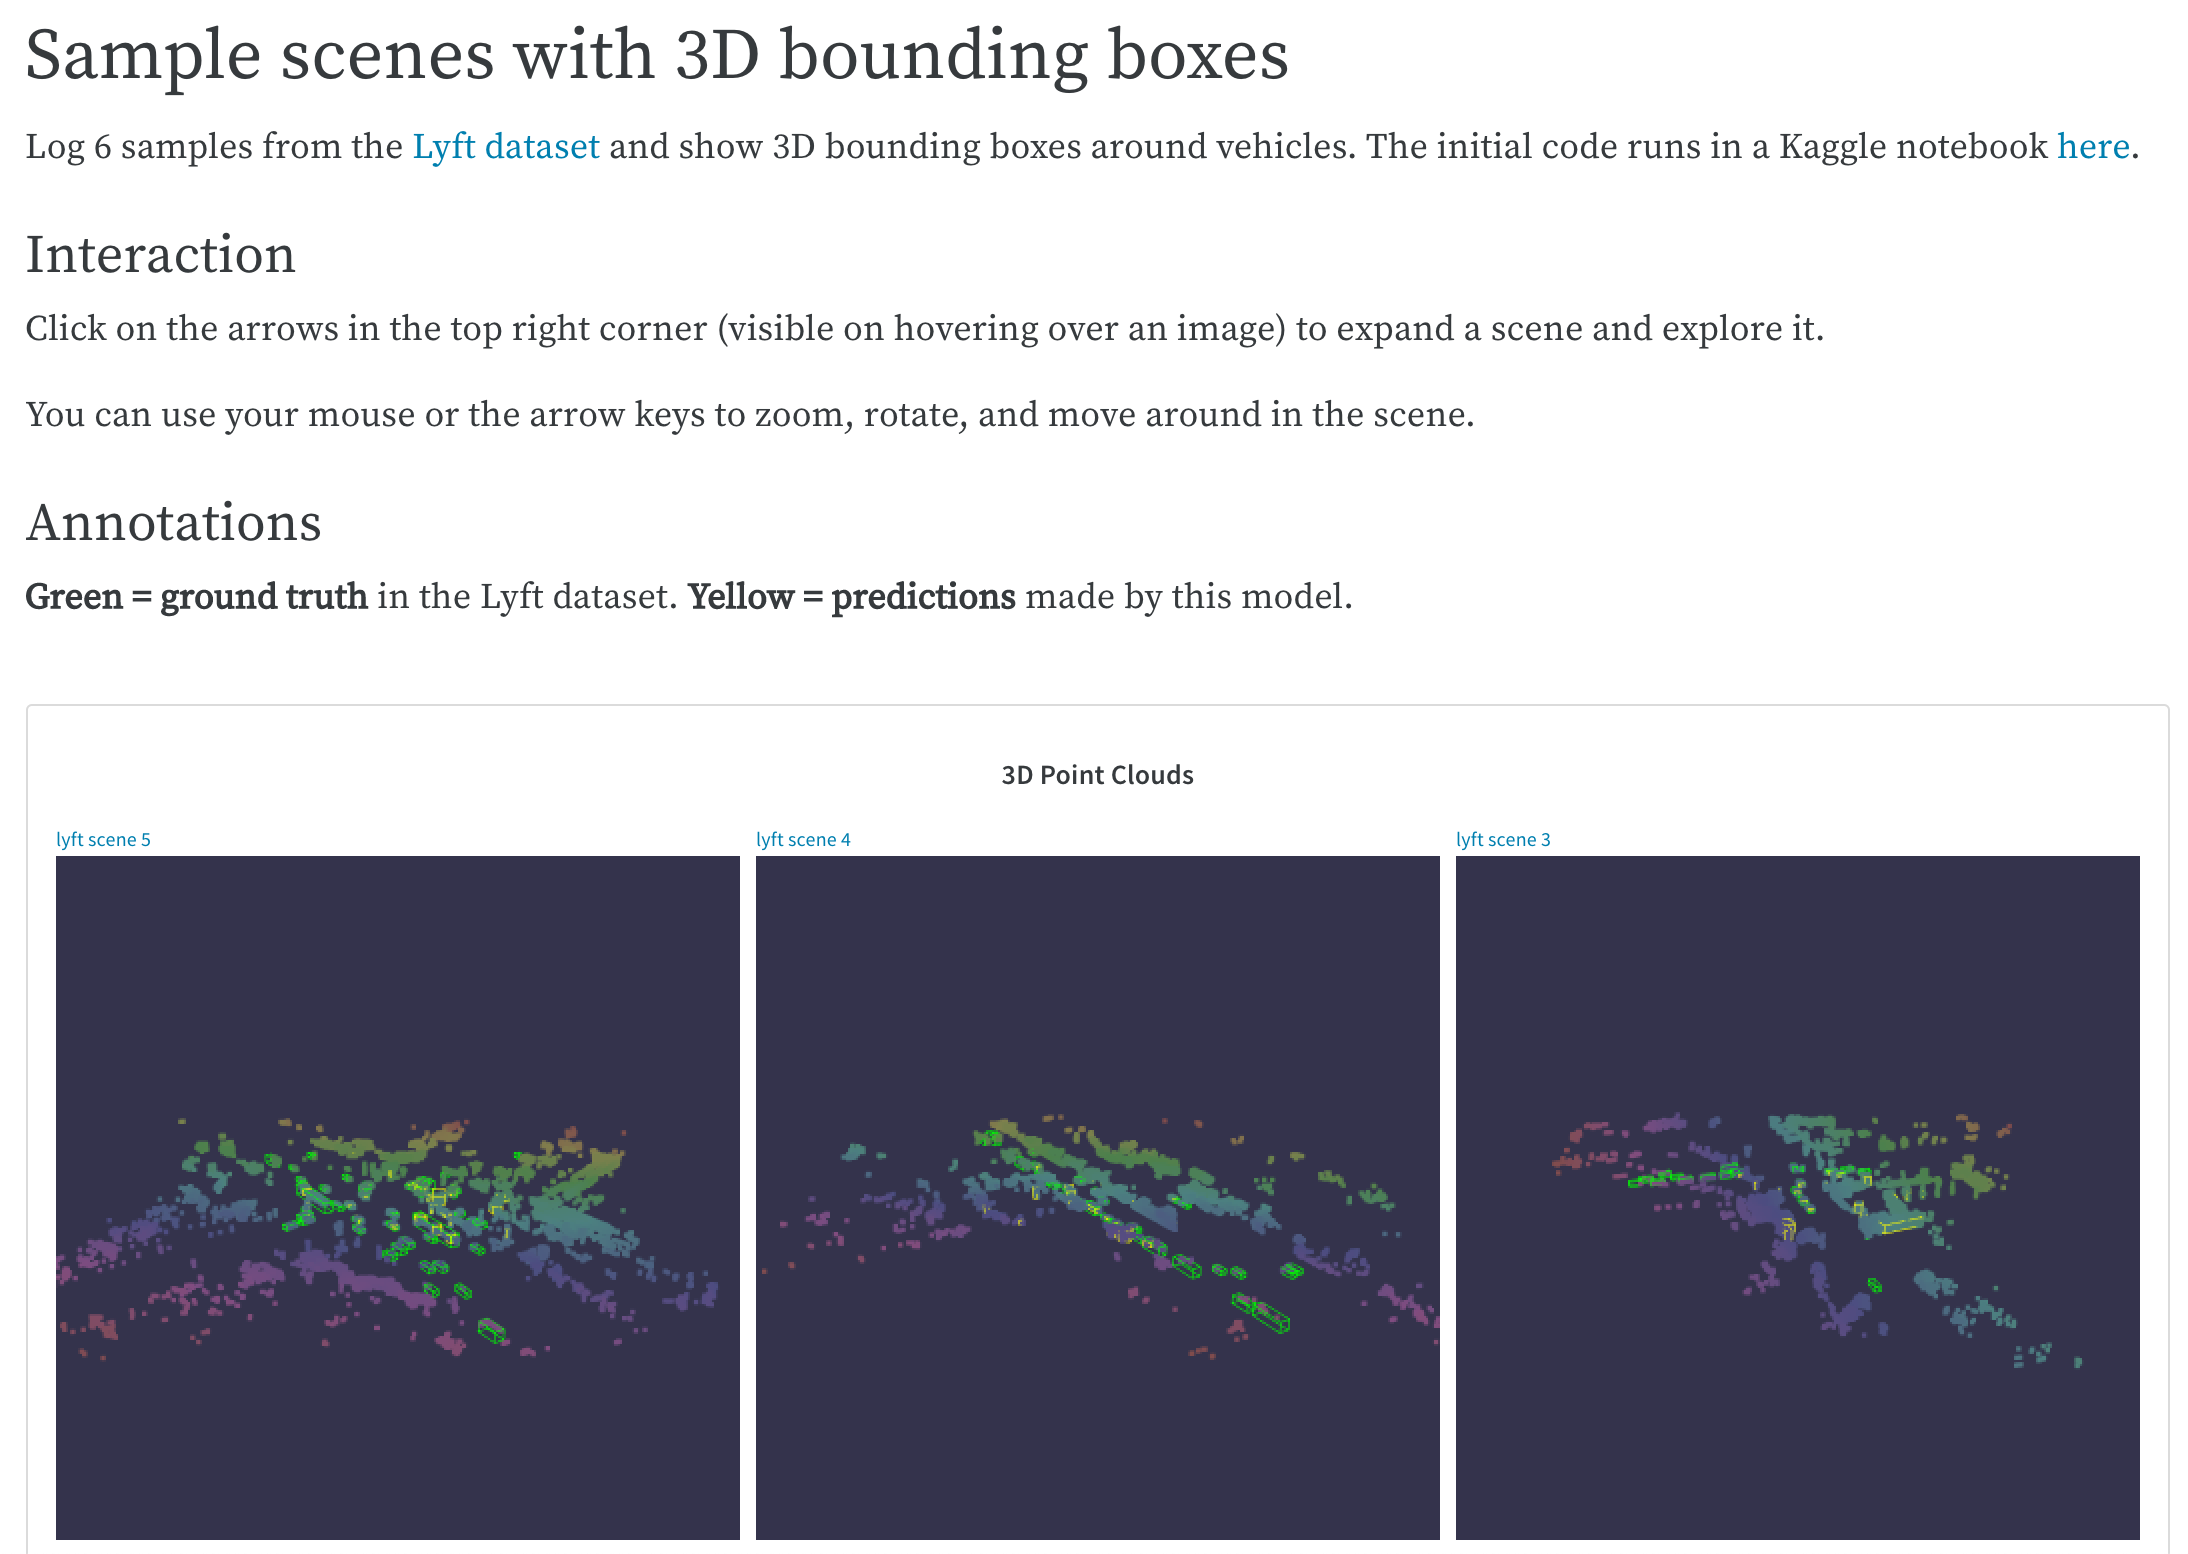
 Save the best examples from a complex code base for quick reference and future interaction. See the [LIDAR point clouds](https://wandb.ai/stacey/lyft/reports/LIDAR-Point-Clouds-of-Driving-Scenes--Vmlldzo2MzA5Mg) report for an example of how to visualize LIDAR point clouds from the Lyft dataset and annotate with 3D bounding boxes.
 ## Collaboration: Share findings with your colleagues
Explain how to get started with a project, share what you've observed so far, and synthesize the latest findings. Your colleagues can make suggestions or discuss details using comments on any panel or at the end of the report.
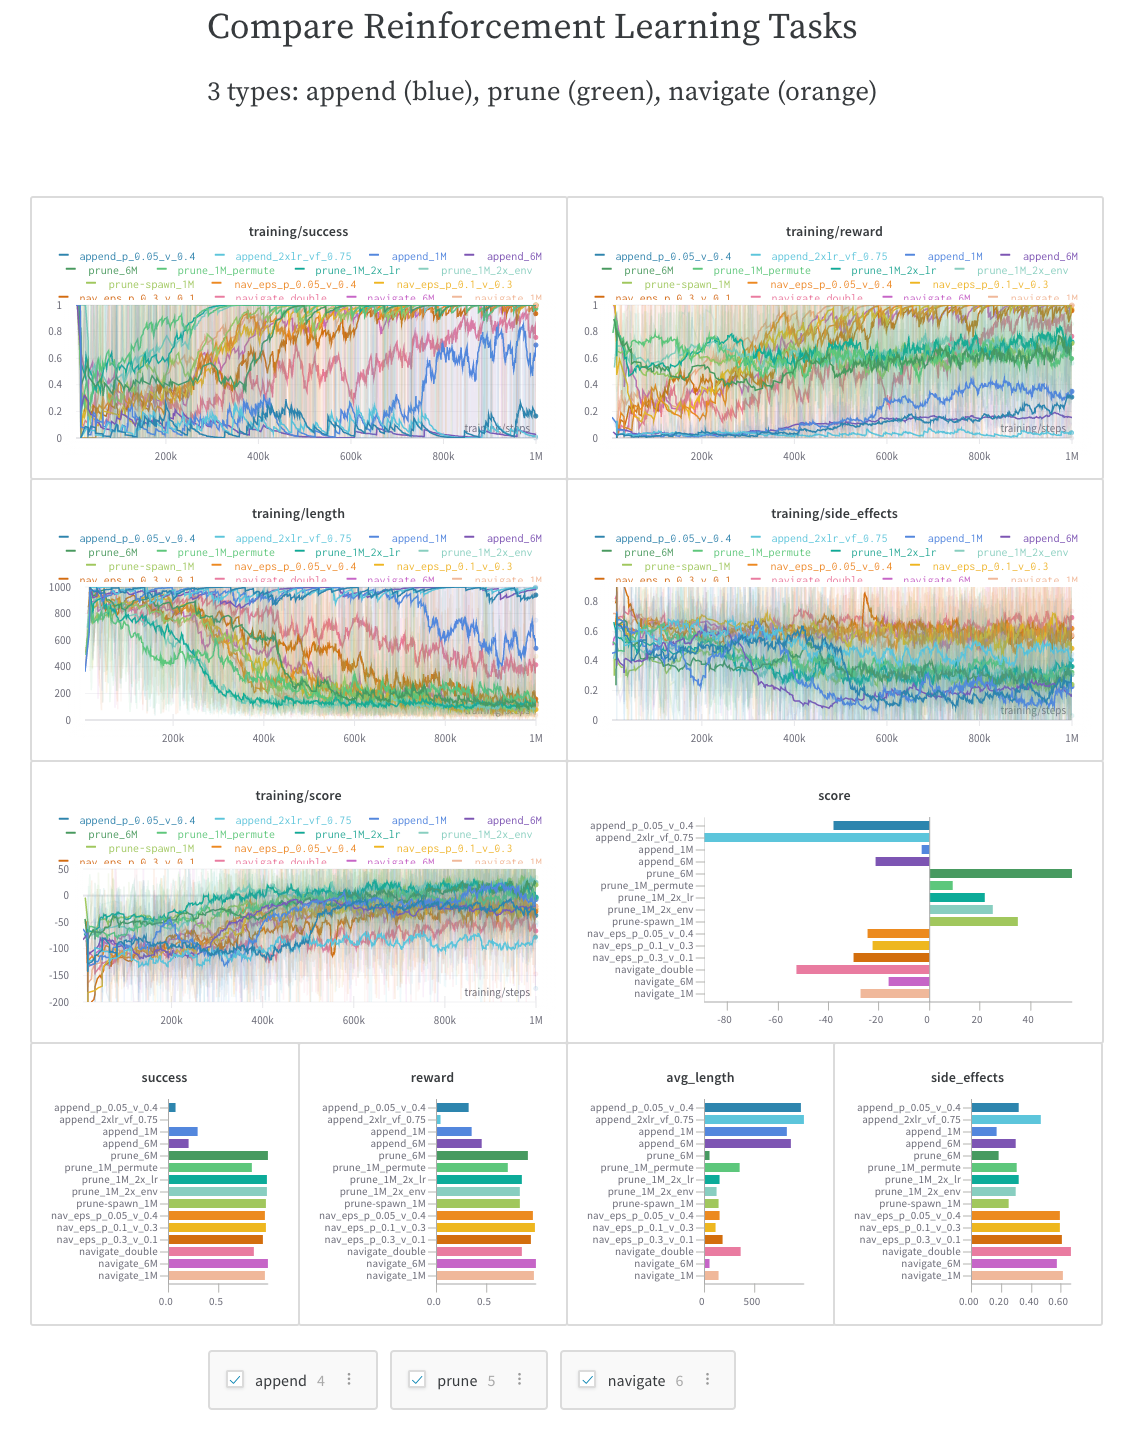
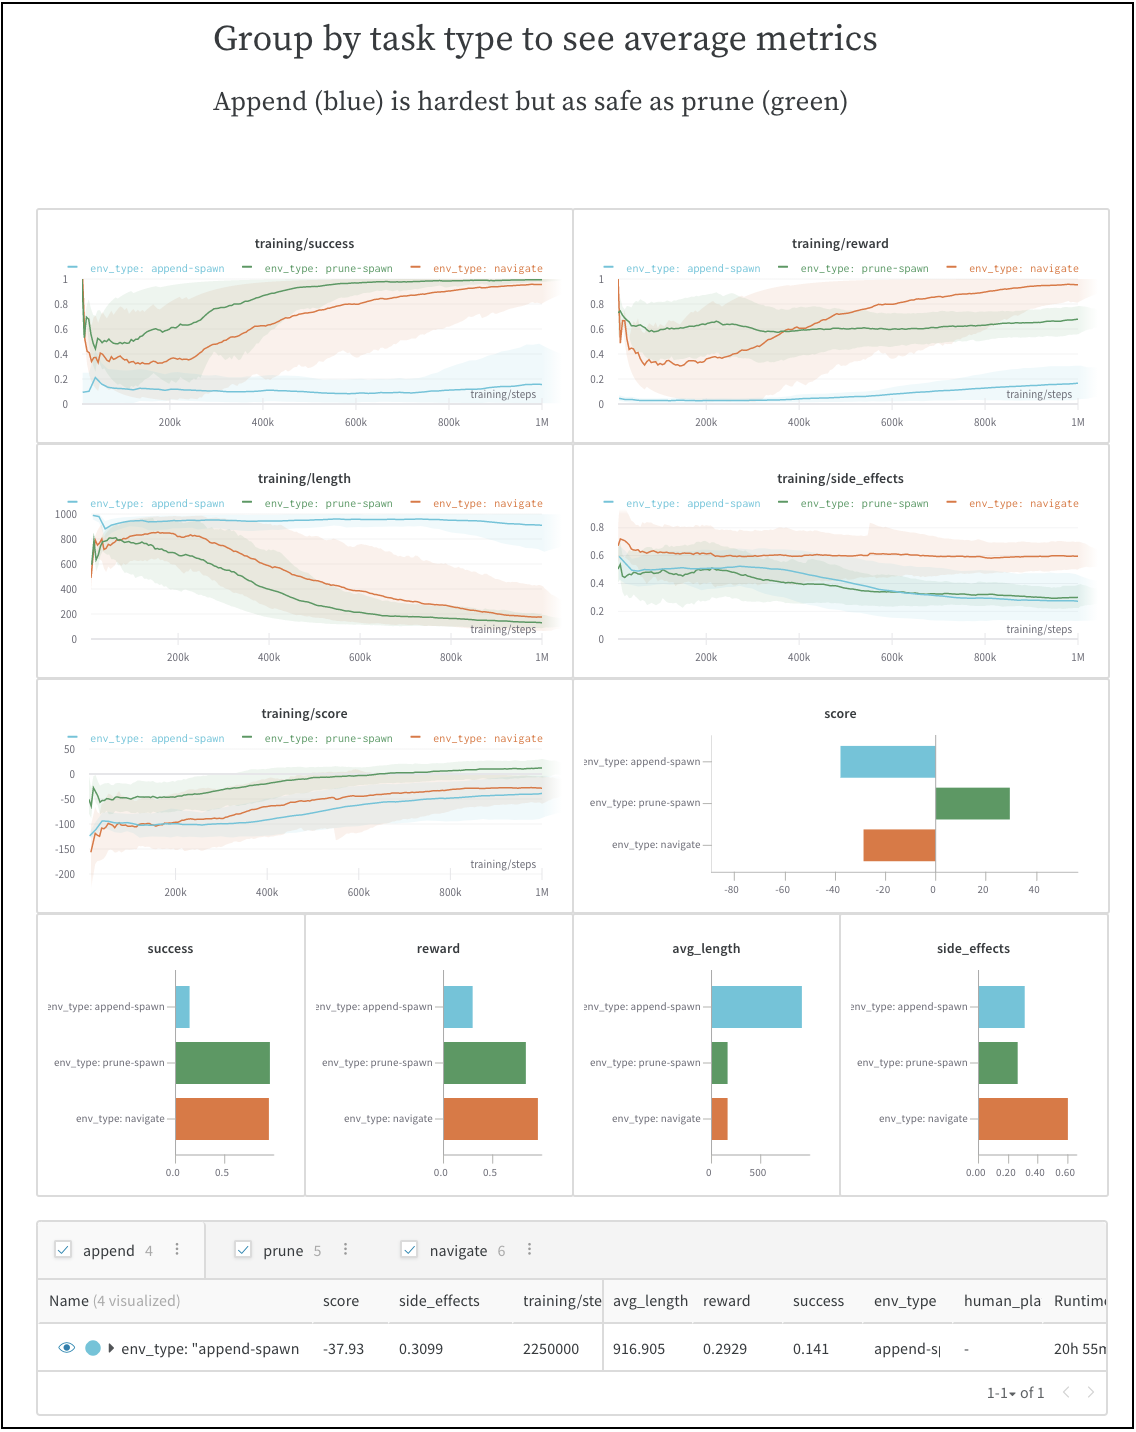
Include dynamic settings so that your colleagues can explore for themselves, get additional insights, and better plan their next steps. In this example, you can visualize three types of experiments independently, compare them, or average them.
See the [SafeLife benchmark experiments](https://wandb.ai/stacey/saferlife/reports/SafeLife-Benchmark-Experiments--Vmlldzo0NjE4MzM) report for an example of how to share first runs and observations of a benchmark.
## Collaboration: Share findings with your colleagues
Explain how to get started with a project, share what you've observed so far, and synthesize the latest findings. Your colleagues can make suggestions or discuss details using comments on any panel or at the end of the report.
Include dynamic settings so that your colleagues can explore for themselves, get additional insights, and better plan their next steps. In this example, you can visualize three types of experiments independently, compare them, or average them.
See the [SafeLife benchmark experiments](https://wandb.ai/stacey/saferlife/reports/SafeLife-Benchmark-Experiments--Vmlldzo0NjE4MzM) report for an example of how to share first runs and observations of a benchmark.
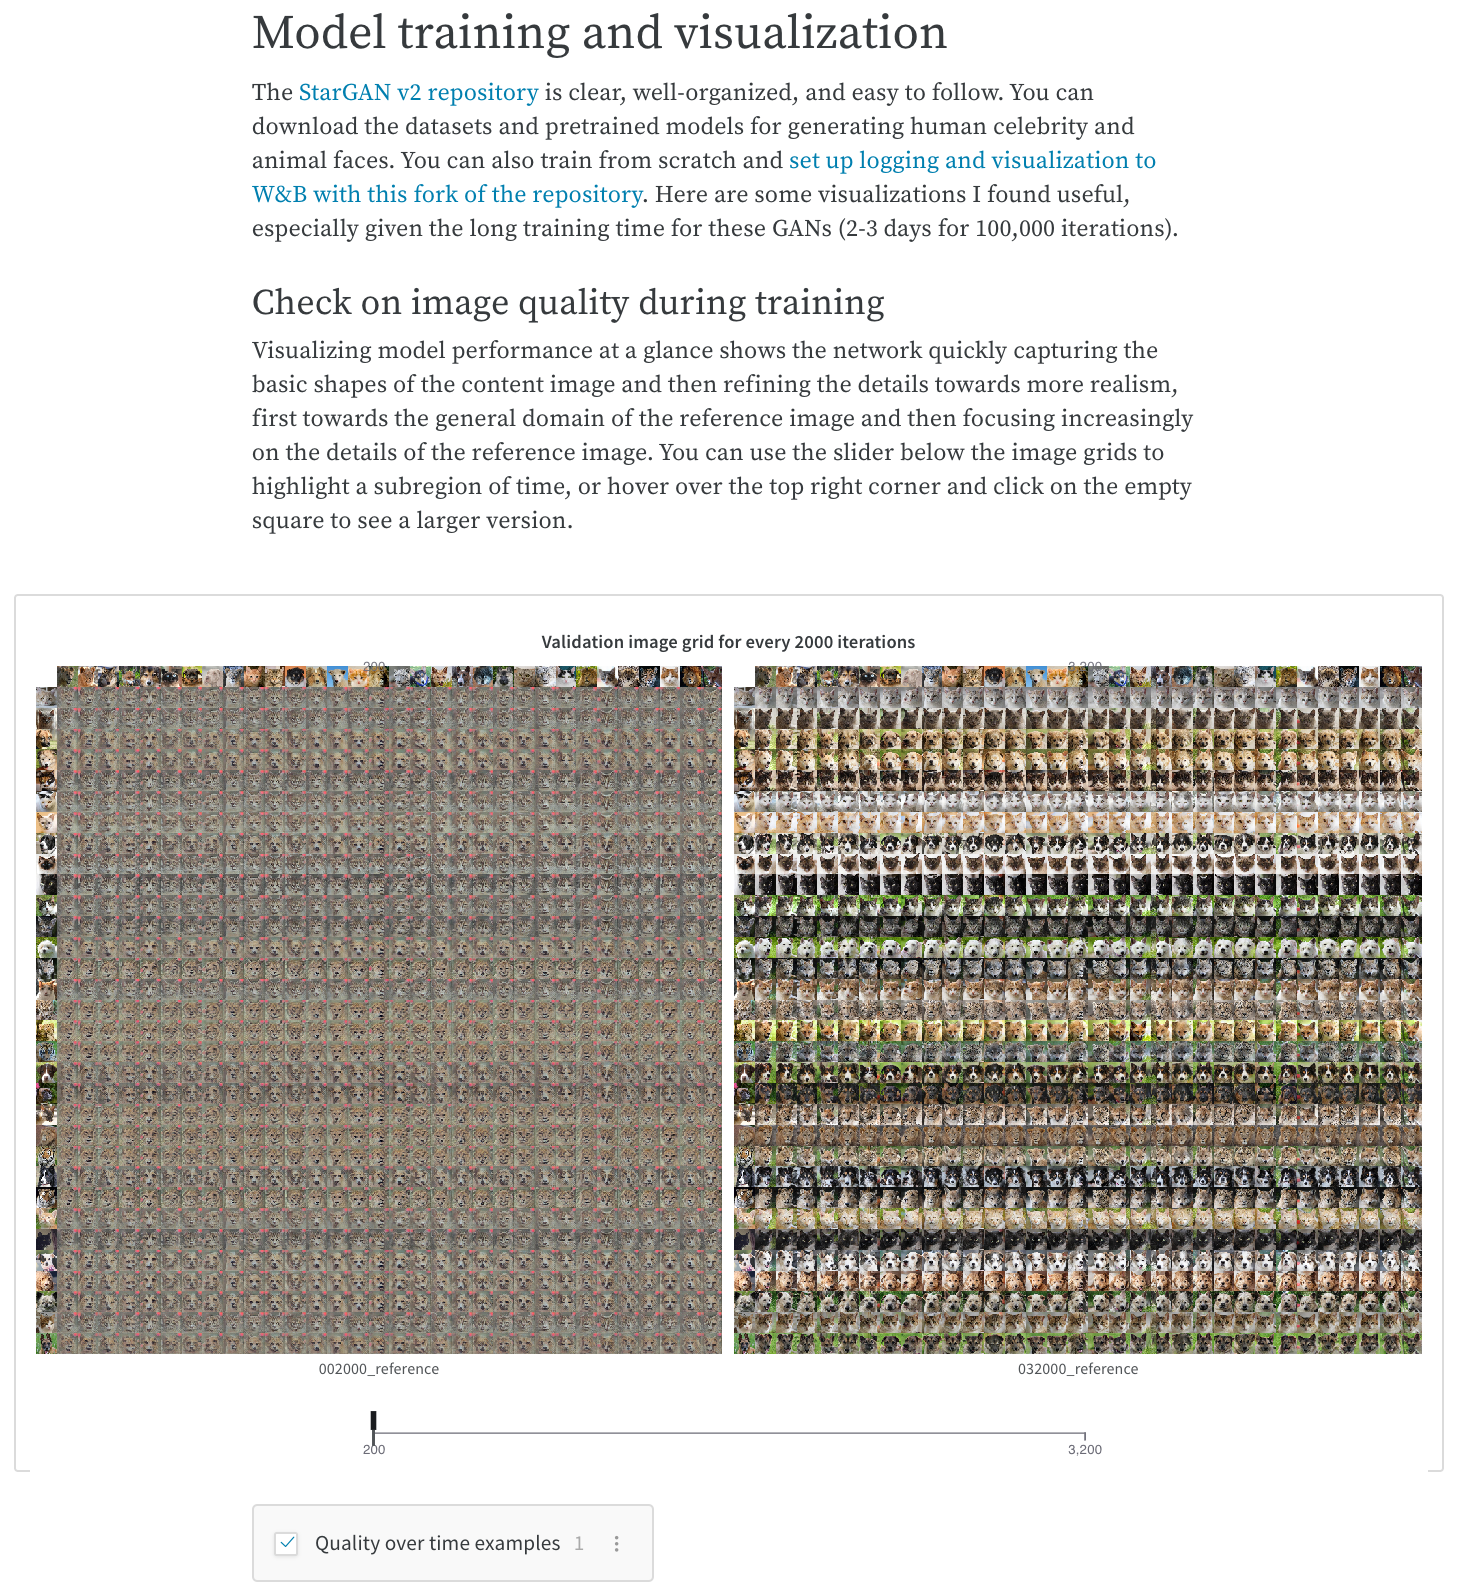
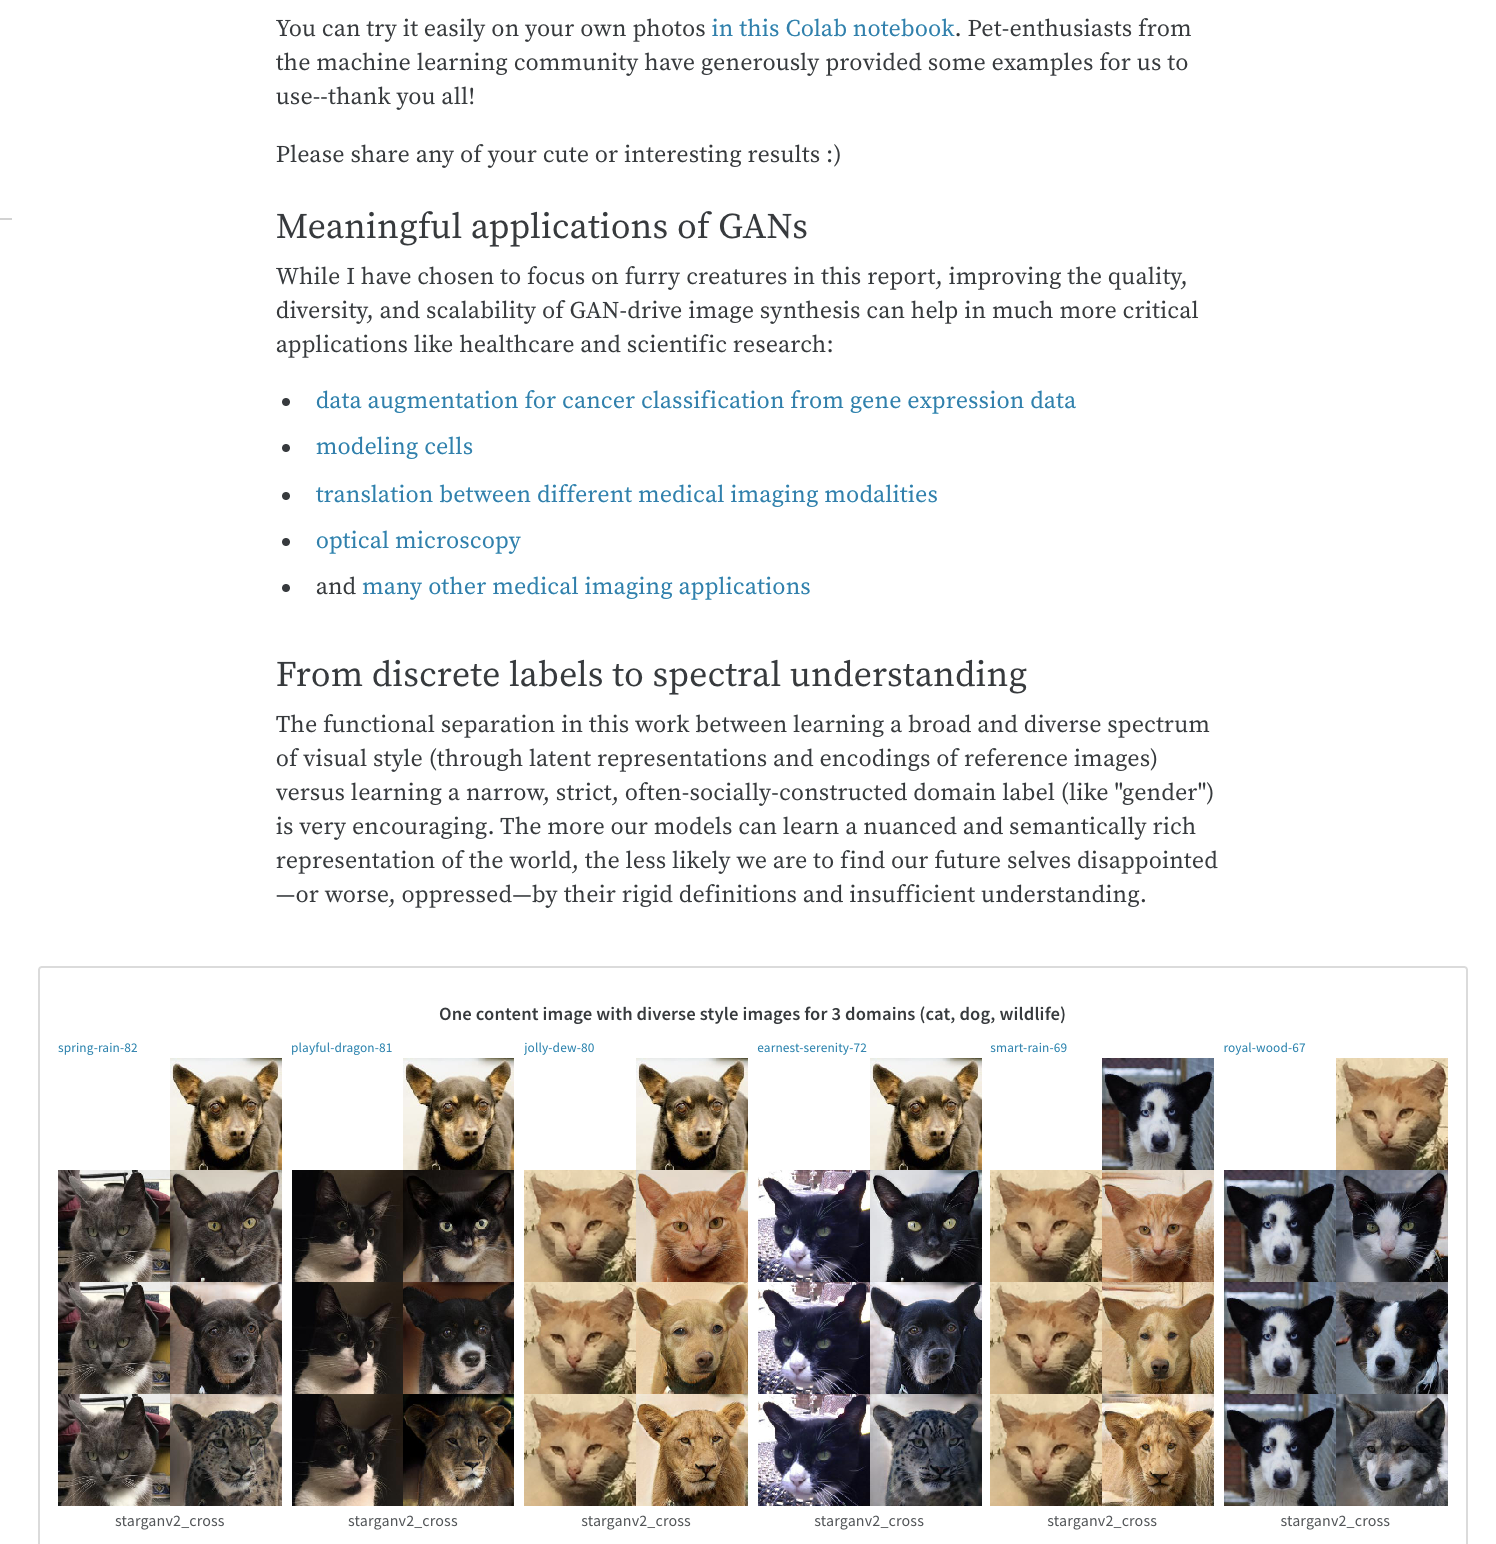
 Use sliders and configurable media panels to showcase a model's results or training progress. View the [Cute Animals and Post-Modern Style Transfer: StarGAN v2 for Multi-Domain Image Synthesis](https://wandb.ai/stacey/stargan/reports/Cute-Animals-and-Post-Modern-Style-Transfer-StarGAN-v2-for-Multi-Domain-Image-Synthesis---VmlldzoxNzcwODQ) report for an example report with sliders.
 ## Work log: Track what you've tried and plan next steps
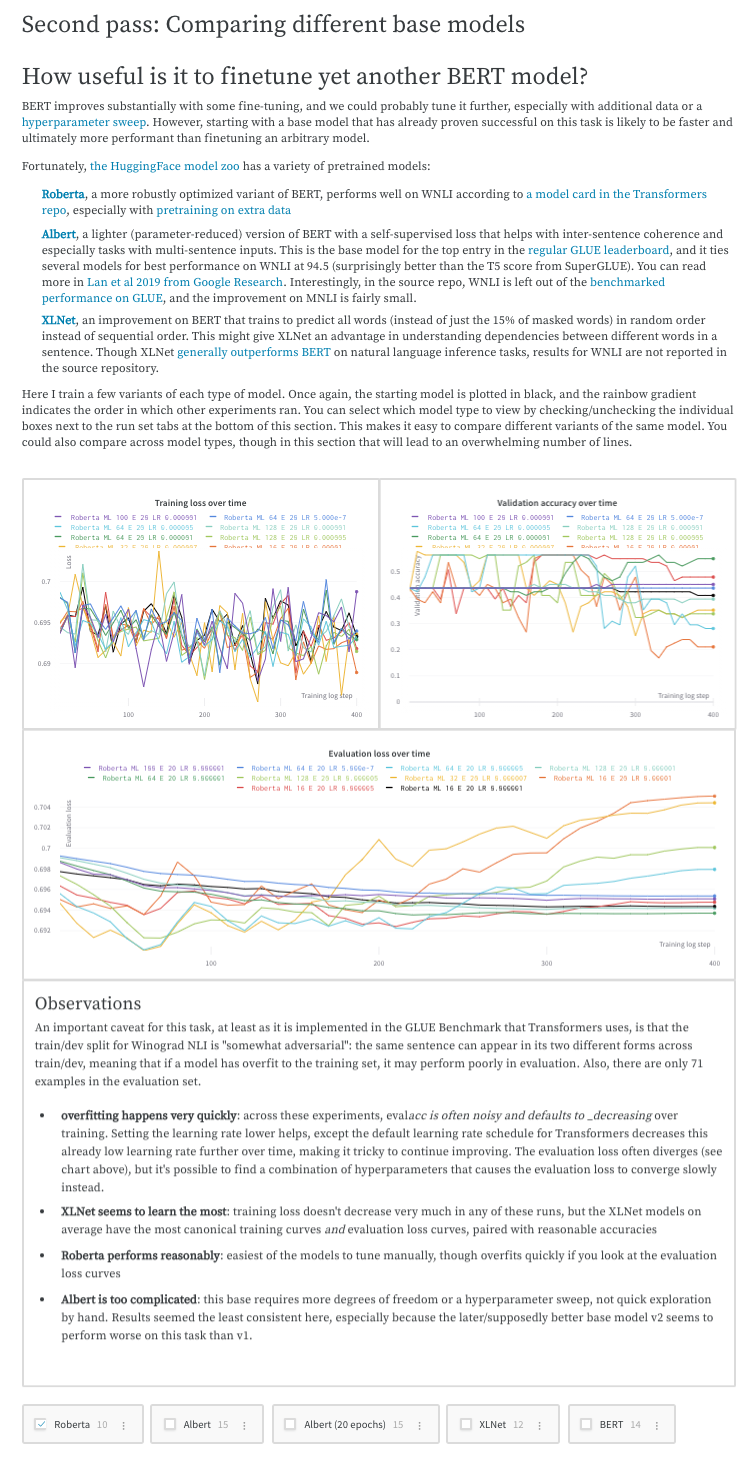
Write down your thoughts on experiments, your findings, and any gotchas and next steps as you work through a project, and keep everything organized in one place. This lets you "document" all the important pieces beyond your scripts. See the [Who Is Them? Text Disambiguation With Transformers](https://wandb.ai/stacey/winograd/reports/Who-is-Them-Text-Disambiguation-with-Transformers--VmlldzoxMDU1NTc) report for an example of how you can report your findings.
## Work log: Track what you've tried and plan next steps
Write down your thoughts on experiments, your findings, and any gotchas and next steps as you work through a project, and keep everything organized in one place. This lets you "document" all the important pieces beyond your scripts. See the [Who Is Them? Text Disambiguation With Transformers](https://wandb.ai/stacey/winograd/reports/Who-is-Them-Text-Disambiguation-with-Transformers--VmlldzoxMDU1NTc) report for an example of how you can report your findings.
 Tell the story of a project, which you and others can reference later to understand how and why a model was developed. See [The View from the Driver's Seat](https://wandb.ai/stacey/deep-drive/reports/The-View-from-the-Driver-s-Seat--Vmlldzo1MTg5NQ) report for how you can report your findings.
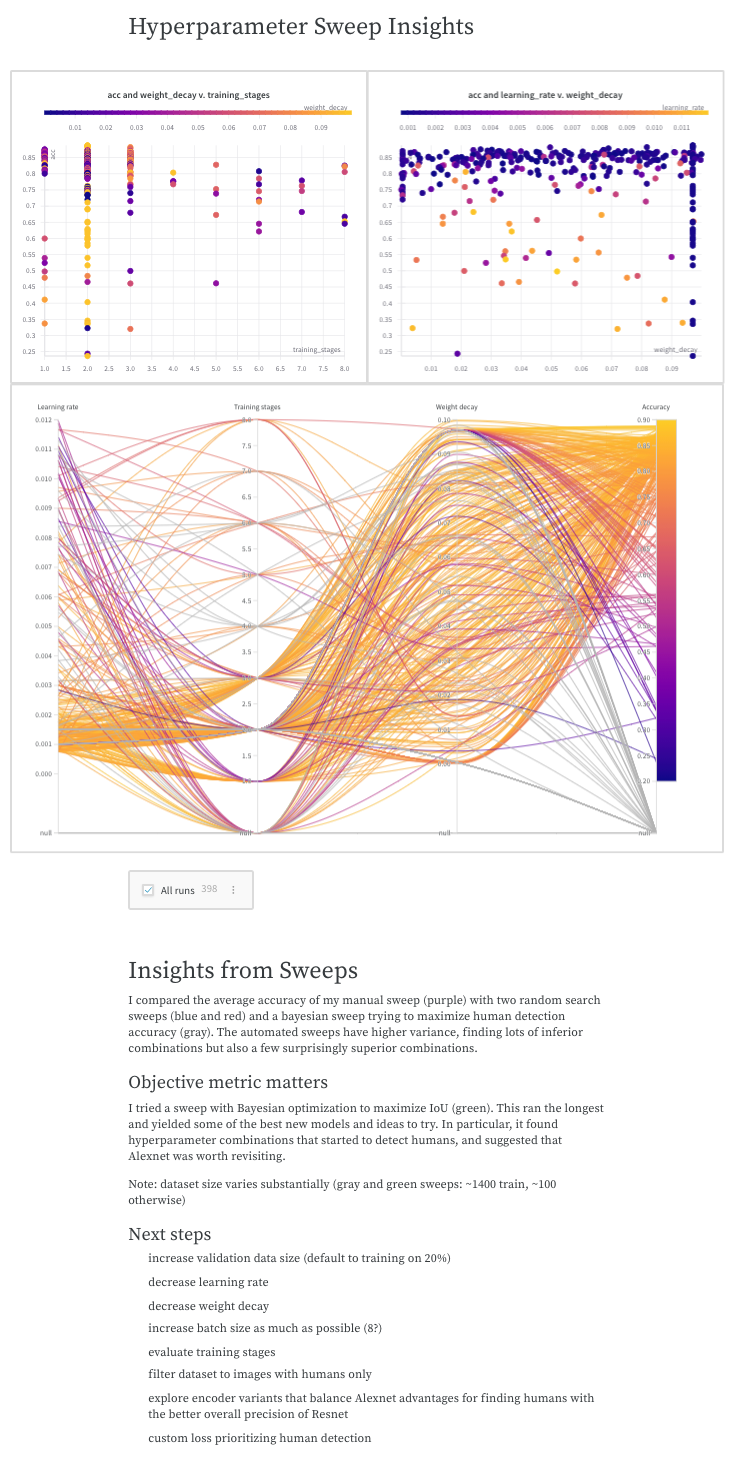 See [Learning Dexterity End-to-End Using W\&B Reports](https://bit.ly/wandb-learning-dexterity) for an example of how the OpenAI Robotics team uses Reports to run large-scale machine learning projects.