> ## Documentation Index
> Fetch the complete documentation index at: https://docs.wandb.ai/llms.txt
> Use this file to discover all available pages before exploring further.
# View a specific run in a project
> Learn how to view a specific logged run and its properties using the W&B App or the LEET terminal UI.
View information about a specific run, such as its current state, artifacts, metrics, and more. You can view and monitor runs using the W\&B App or the `wandb beta leet` terminal UI.
To view a specific run in the W\&B App:
1. Navigate to the [W\&B App](https://wandb.ai/home).
2. Navigate to the W\&B project you specified when you initialized the run.
3. Within the project sidebar, select the **Workspace** tab.
4. Within the run selector, click the run you want to view, or enter a partial run name to filter for matching runs.
Alternatively, you can directly access a specific run's workspace by entering its URL in your browser. The URL path of a specific run has the following format:
```text theme={null}
https://wandb.ai///runs/
```
Replace values enclosed in angle brackets (`< >`) with the actual values of the team name, project name, and [run ID](/models/runs/run-identifiers#run-id).
Explore the run's properties by navigating through the tabs: [Overview](/models/runs/view-logged-runs#overview), [Logs](/models/runs/view-logged-runs#logs), [Files](/models/runs/view-logged-runs#files), [Code](/models/runs/view-logged-runs#code), and [Artifacts](/models/runs/view-logged-runs#artifacts).
To view a run locally in your terminal using the `wandb beta leet` terminal UI:
1. If you started the run locally from a script, navigate to the directory where you ran your code. It contains a `wandb/` directory with a subdirectory per run and a `latest-run/` symbolic link. Each run directory contains a transaction log named in the format `run-.wandb`.
If you did not start the run locally but downloaded a `.wandb` transaction log file instead, make a note of its location.
2. Start `wandb beta leet` using one of these commands:
```bash theme={null}
# View the latest run, stored in ./wandb/latest-run/
wandb beta leet
# Specify a run directory
wandb beta leet ./wandb/run-20250813_124246-n67z9ude
# Specify a .wandb file
wandb beta leet ./wandb/run-20250813_124246-n67z9ude/run-n67z9ude.wandb
```
LEET displays a three-panel interface:
* **Left panel**: Run overview with environment variables, configuration, and summary statistics
* **Center panel**: Metrics grid with Braille-style line charts showing your logged metrics
* **Right panel**: System metrics including GPU/CPU/RAM utilization
Get started with these keyboard shortcuts:
* `h` or `?` - View all keyboard shortcuts
* `/` - Filter metrics by pattern
* `[` / `]` - Toggle left/right panels
* `n` / `N` - Navigate between metric pages
* `q` / `CMD+C` - Quit
See the [`wandb beta leet`](/models/ref/cli/wandb-beta/wandb-beta-leet) reference for more details.
## Overview
Use the **Overview** tab to learn about specific run information in a project, such as:
* **References**: Dictionary keys from your experiment's [config](/models/track/config) that you want to show prominently in the W\&B App. See [Highlight config values](/models/track/config#highlight-config-values) for more details.
* **Notes**: Any notes you added to the run. You can add notes to a run with the W\&B App or programmatically with the Python SDK.
* **Tags**: A list of strings. Tags are useful for organizing related runs together or applying temporary labels like `baseline` or `production`. You can add tags to a run with the W\&B App or programmatically with the Python SDK.
* **Author**: The W\&B entity that creates the run.
* **Command**: The command that initializes the run.
* **Description**: A description of the run that you provided. This field is empty if you do not specify a description when you create the run. You can add a description to a run with the W\&B App or programmatically with the Python SDK.
* **Tracked Hours**: The amount of time the run is actively computing or logging data, excluding any pauses or waiting periods. This metric helps you understand the actual computational time spent on your run. You are not billed for tracked hours, which are unlimited for all plans.
* **Runtime**: Measures the total time from the start to the end of the run. It's the wall-clock time for the run, including any time where the run is paused or waiting for resources. This metric provides the complete elapsed time for your run.
* **Git repository**: The git repository associated with the run. You must [enable git](/platform/app/settings-page/user-settings/#personal-github-integration) to view this field.
* **Host name**: Where W\&B computes the run. W\&B displays the name of your machine if you initialize the run locally on your machine.
* **Name**: The name of the run.
* **OS**: Operating system that initializes the run.
* **Python executable**: The command that starts the run.
* **Python version**: Specifies the Python version that creates the run.
* **Run path**: Identifies the unique run identifier in the form `entity/project/run-ID`.
* **Start time**: The timestamp when you initialize the run.
* **State**: The [state of the run](/models/runs/run-states).
* **System hardware**: The hardware W\&B uses to compute the run.
* **W\&B CLI version**: The W\&B CLI version installed on the machine that hosted the run command.
* **Git state**: The most recent git commit SHA of a repository or working directory where the run is initialized. This field is empty if you do not enable Git when you create the run or if the git information is not available.
W\&B stores the following information below the overview section:
* **Artifact Outputs**: Artifact outputs produced by the run.
* **Config**: List of config parameters saved with [`wandb.Run.config`](/models/track/config/).
* **Summary**: List of summary parameters saved with [`wandb.Run.log()`](/models/track/log/). By default, W\&B sets this value to the last value logged.
You can use the search box aboce the Config and Summary sections to filter for specific parameters. For example, if you enter `acc` in the search box, W\&B filters for all parameters with `acc` in their name such as `accuracy` and `val_acc`.
W\&B does not search for nested config or summary parameters. For example, if you log a nested config parameter with `wandb.Run.config.update({"model": {"learning_rate": 0.01}})`, W\&B does not return the `learning_rate` parameter if you search for `learning_rate` in the search box. You can only find the `learning_rate` parameter by searching for `model`.
View an example project overview [here](https://wandb.ai/stacey/deep-drive/overview).
## Logs
The **Logs** tab shows output printed on the command line such as the standard output (`stdout`) and standard error (`stderr`).
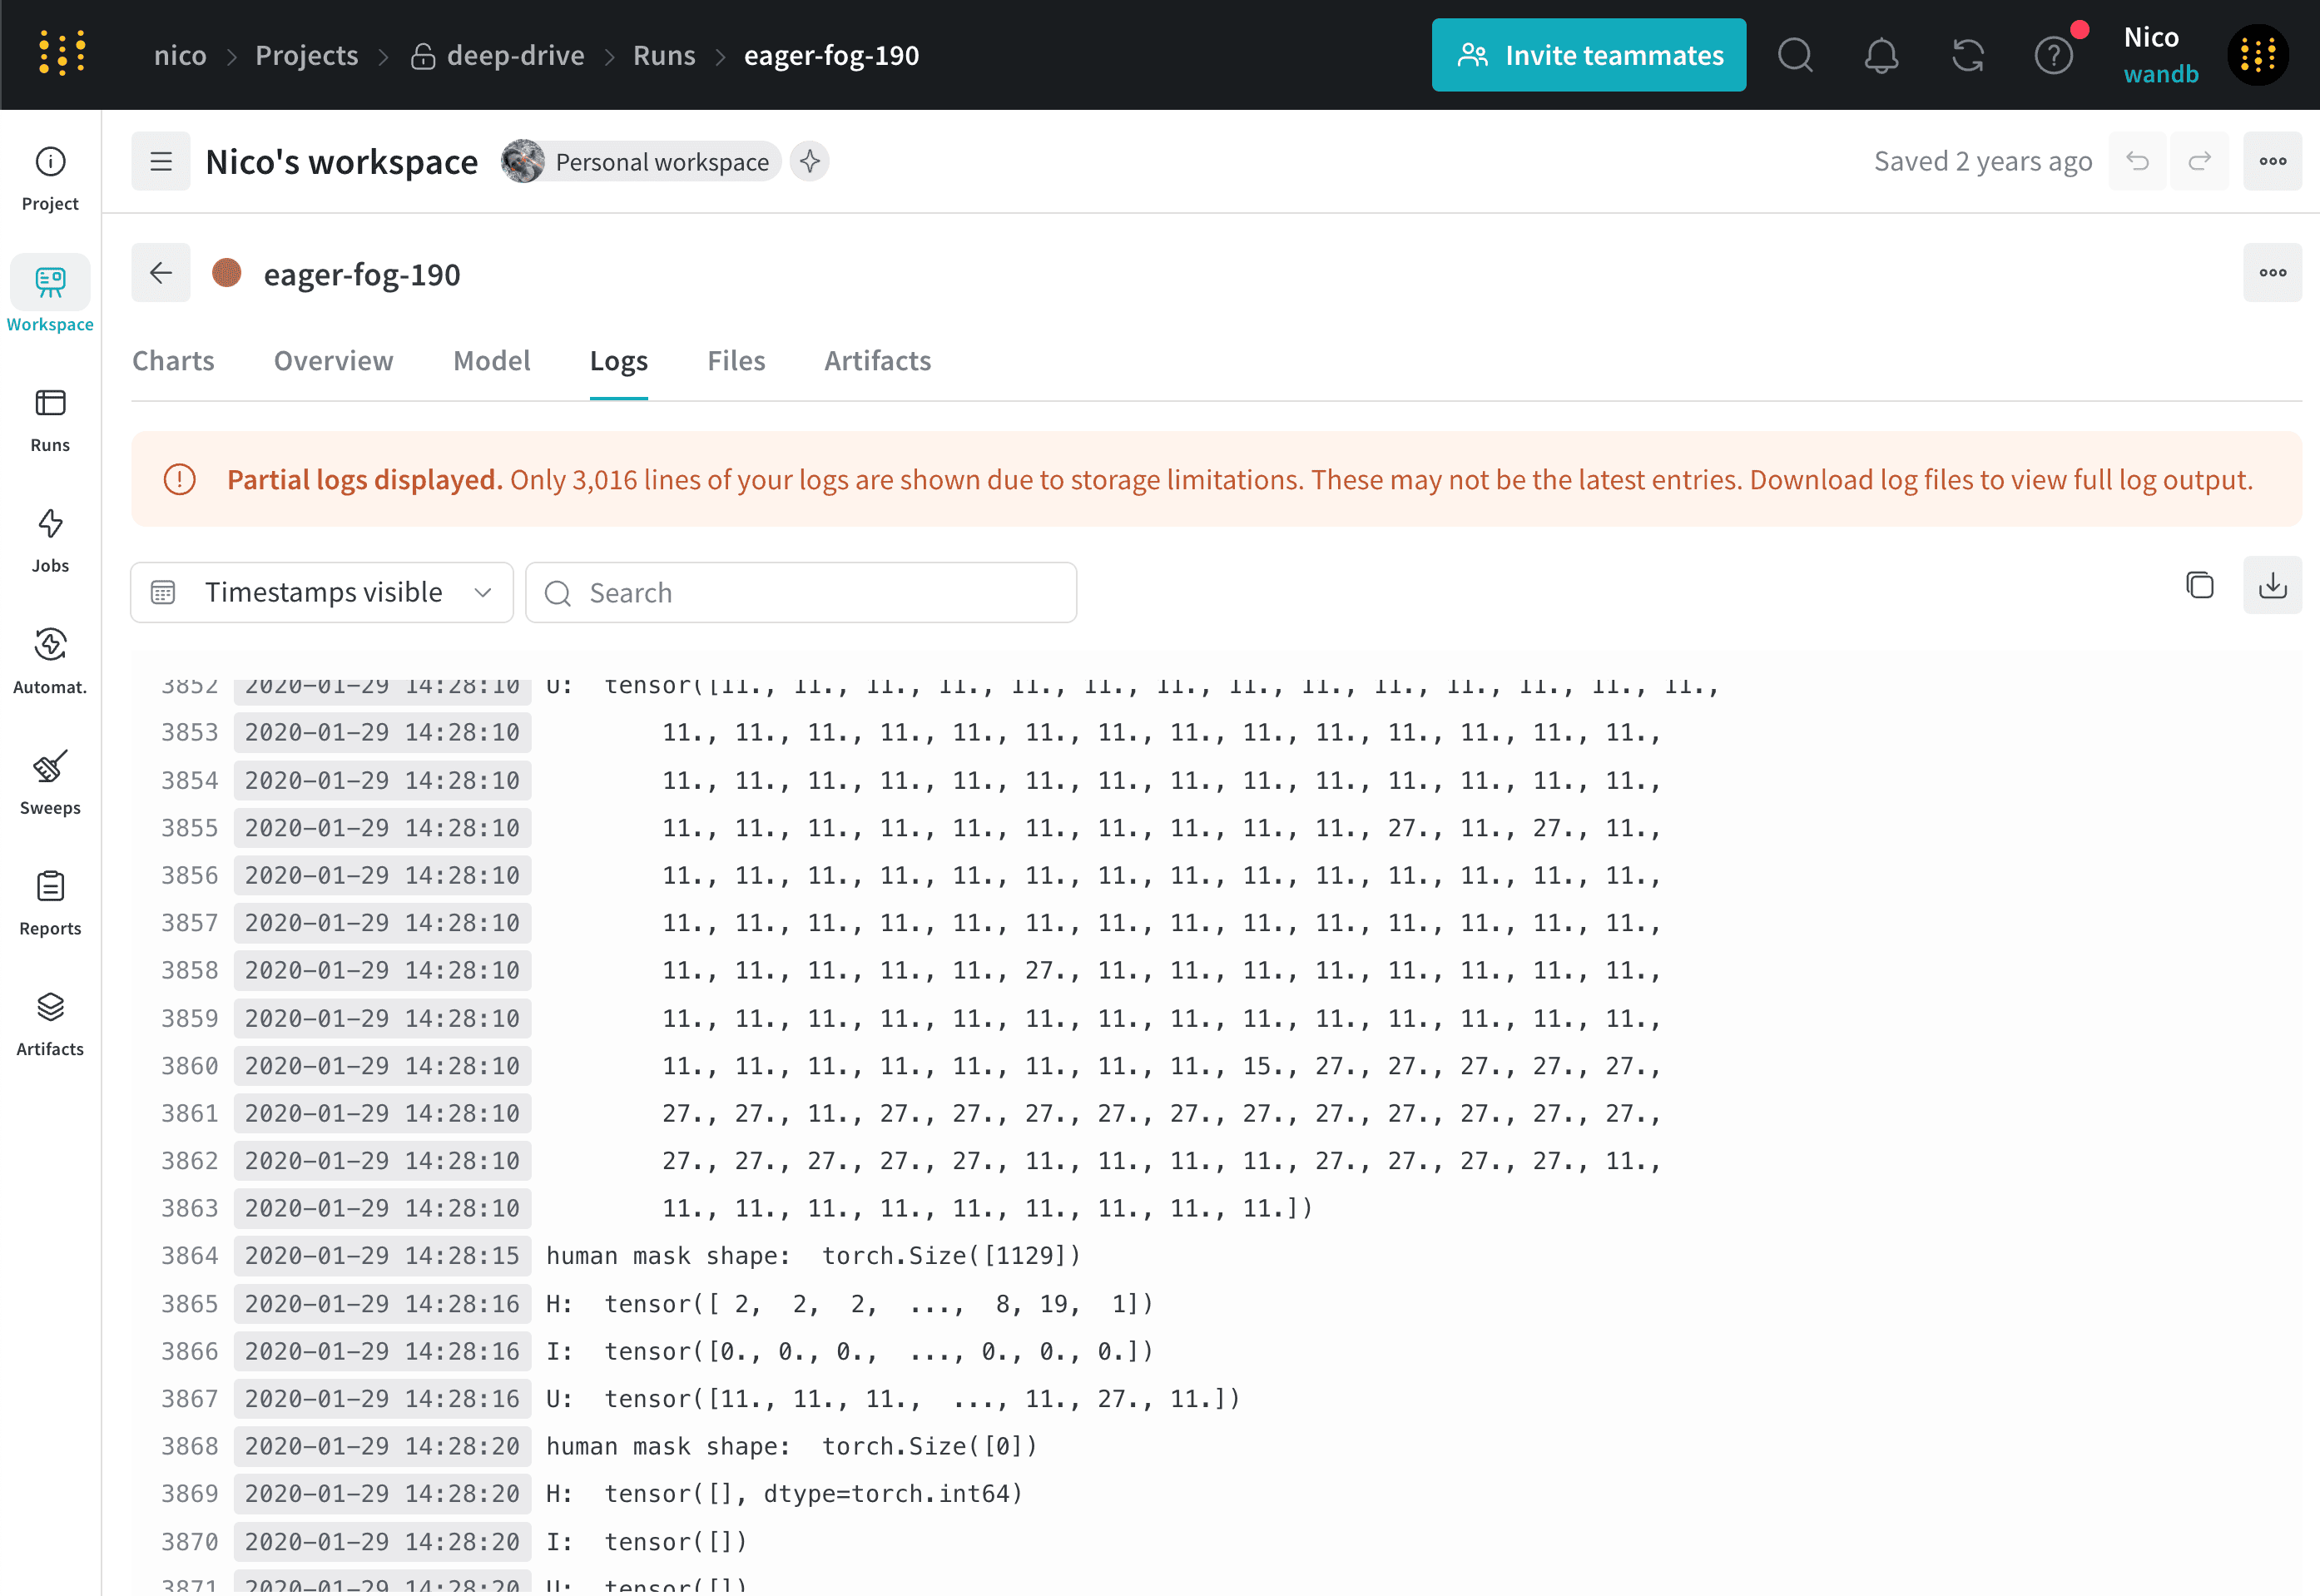 Click the **Download** button in the upper right hand corner to download the log file.
View an example logs tab [here](https://app.wandb.ai/stacey/deep-drive/runs/pr0os44x/logs).
## Files
Use the **Files** tab to view files associated with a specific run such as model checkpoints, validation set examples, and more
Click the **Download** button in the upper right hand corner to download the log file.
View an example logs tab [here](https://app.wandb.ai/stacey/deep-drive/runs/pr0os44x/logs).
## Files
Use the **Files** tab to view files associated with a specific run such as model checkpoints, validation set examples, and more
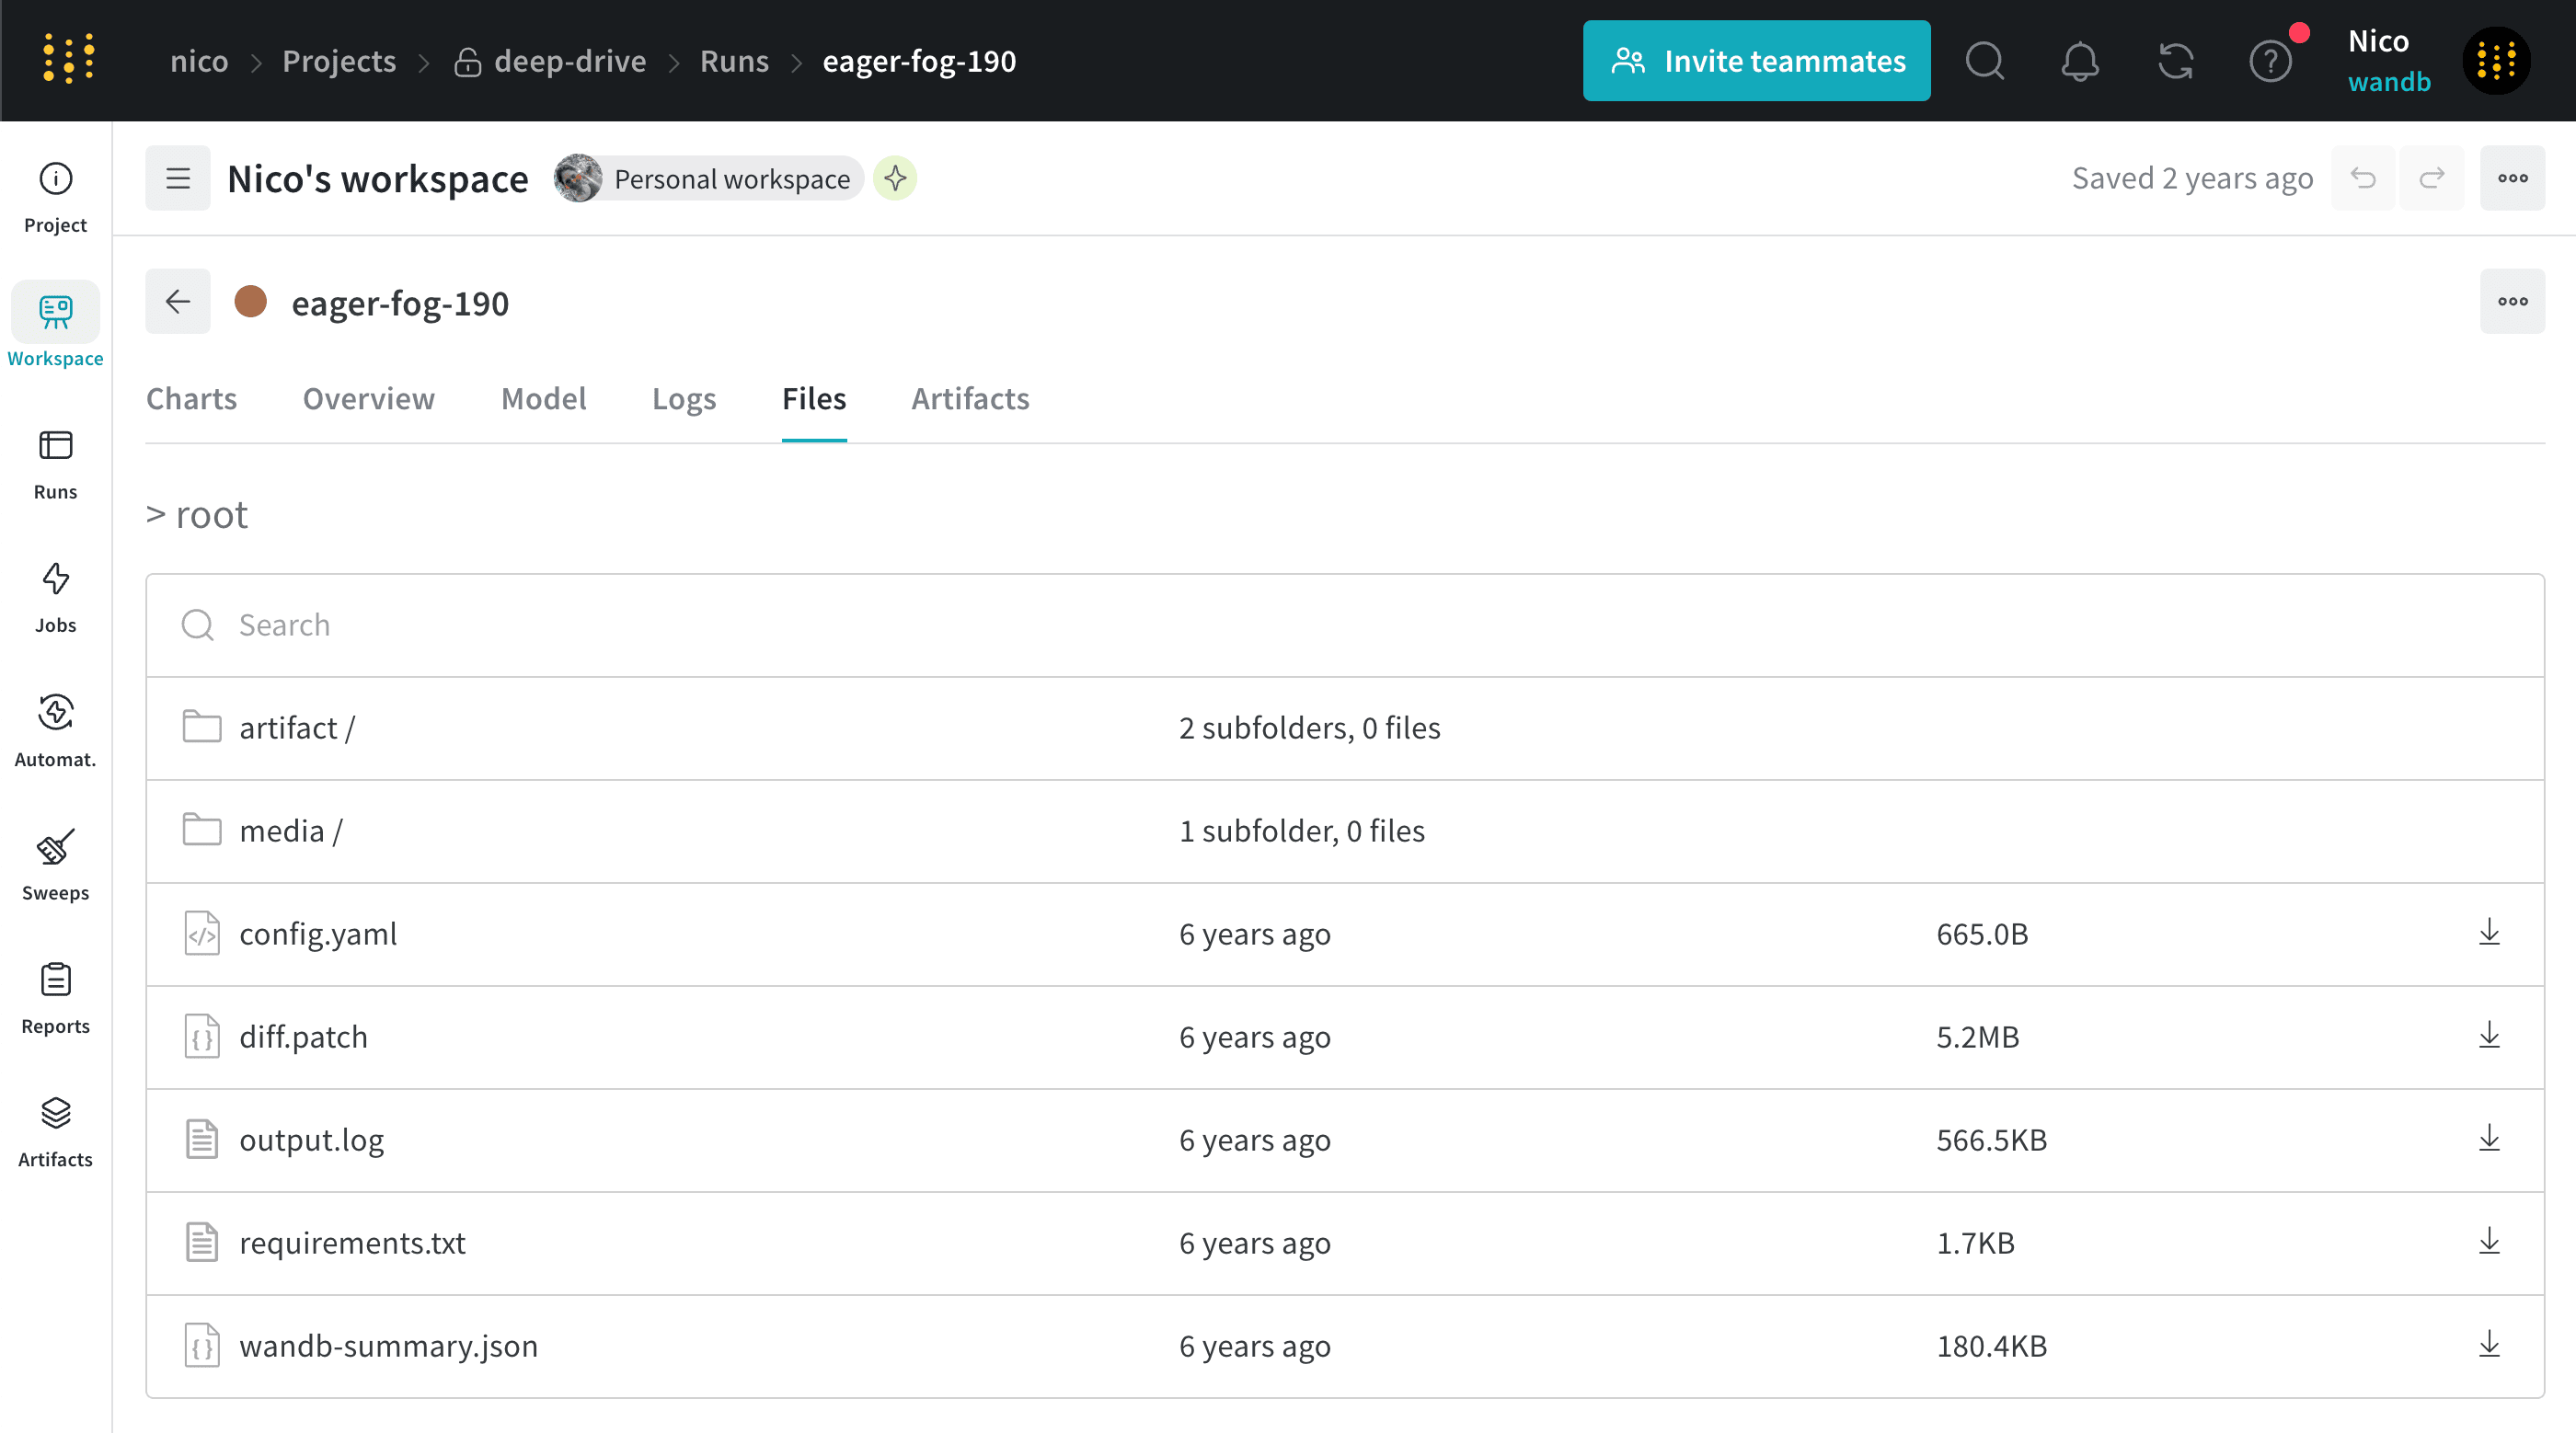 View an example files tab [here](https://app.wandb.ai/stacey/deep-drive/runs/pr0os44x/files/media/images).
## Code
The **Code** tab displays the code files associated with a specific run. This includes the main script that was executed as well as any additional code files that were part of the run's environment.
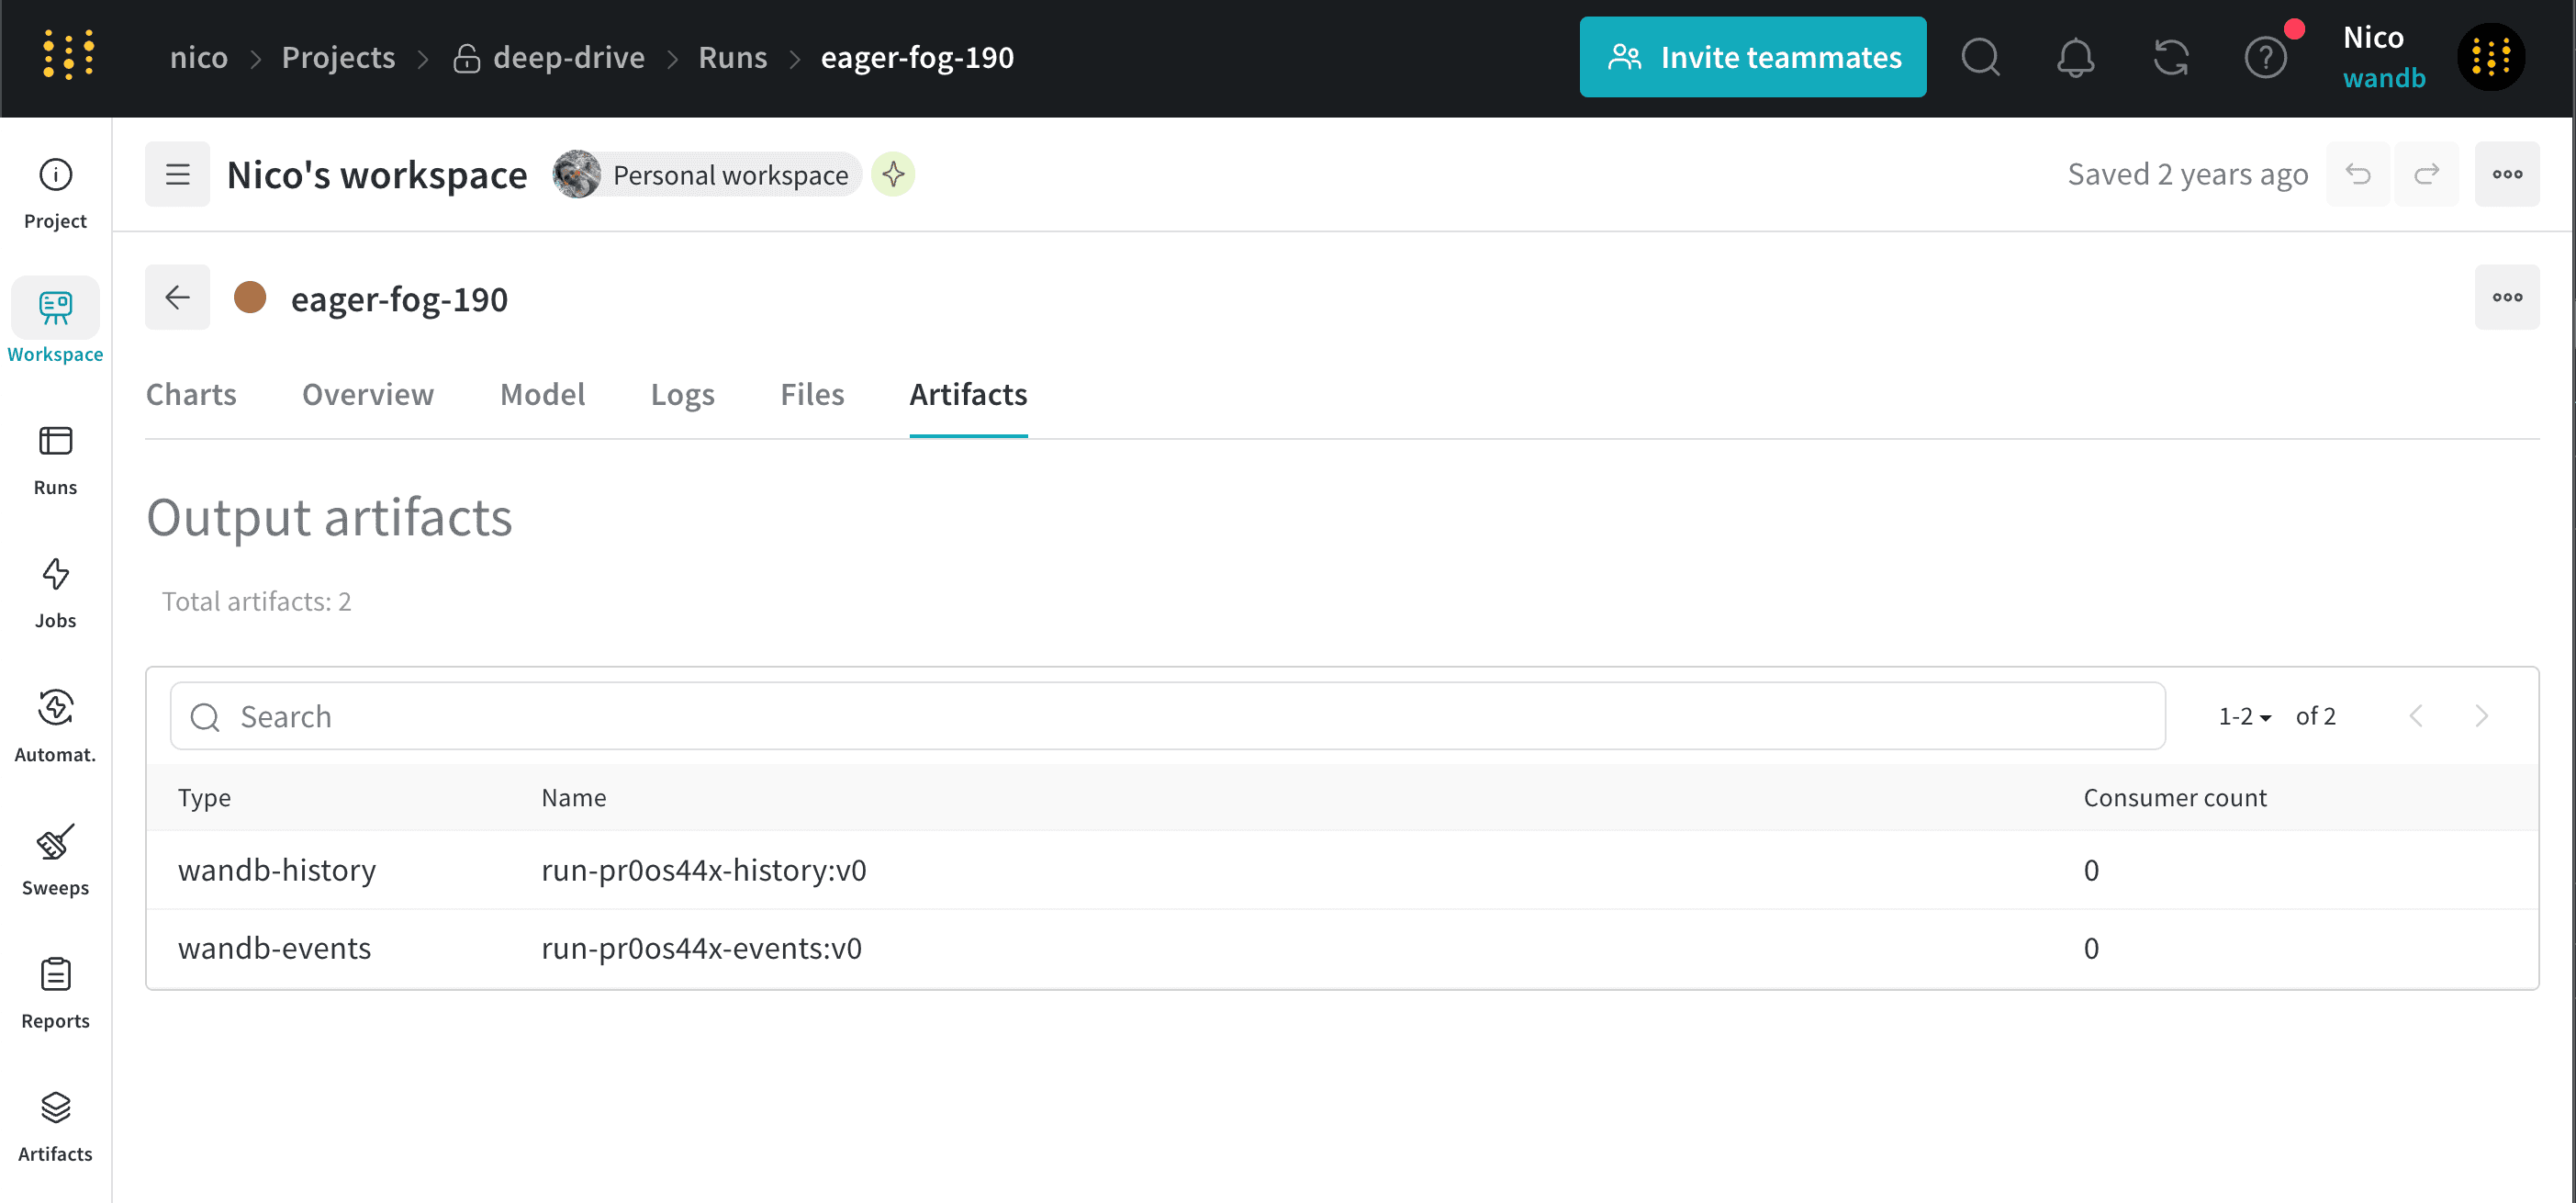
## Artifacts
The **Artifacts** tab lists the input and output [artifacts](/models/artifacts/) for the specified run.
View an example files tab [here](https://app.wandb.ai/stacey/deep-drive/runs/pr0os44x/files/media/images).
## Code
The **Code** tab displays the code files associated with a specific run. This includes the main script that was executed as well as any additional code files that were part of the run's environment.
## Artifacts
The **Artifacts** tab lists the input and output [artifacts](/models/artifacts/) for the specified run.