> ## Documentation Index
> Fetch the complete documentation index at: https://docs.wandb.ai/llms.txt
> Use this file to discover all available pages before exploring further.
> Visualize the results of your W&B Sweeps with the W&B App UI.
# Visualize sweep results
Visualize the results of your W\&B Sweeps with the W\&B App. Navigate to the [W\&B App](https://wandb.ai/home). Choose the project that you specified when you initialized a sweep. You will be redirected to your project [workspace](/models/track/workspaces/). Select the **Sweep icon** in the project sidebar (broom icon). From the Sweep UI, select the name of your Sweep from the list.
The sweep list shows each sweep's state (**State**), creation time (**Created**), who started it (**Creator**), how many runs finished (**Run count**), and total **Compute time**. For a grid search over a discrete search space, W\&B also shows **Est. Runs** (the expected number of runs). Open a sweep from the list to pause, resume, stop, or kill it from the app. For the same controls with the CLI, see [Manage sweeps](/models/sweeps/pause-resume-and-cancel-sweeps/).
By default, W\&B will automatically create a parallel coordinates plot, a parameter importance plot, and a scatter plot when you start a W\&B Sweep job.
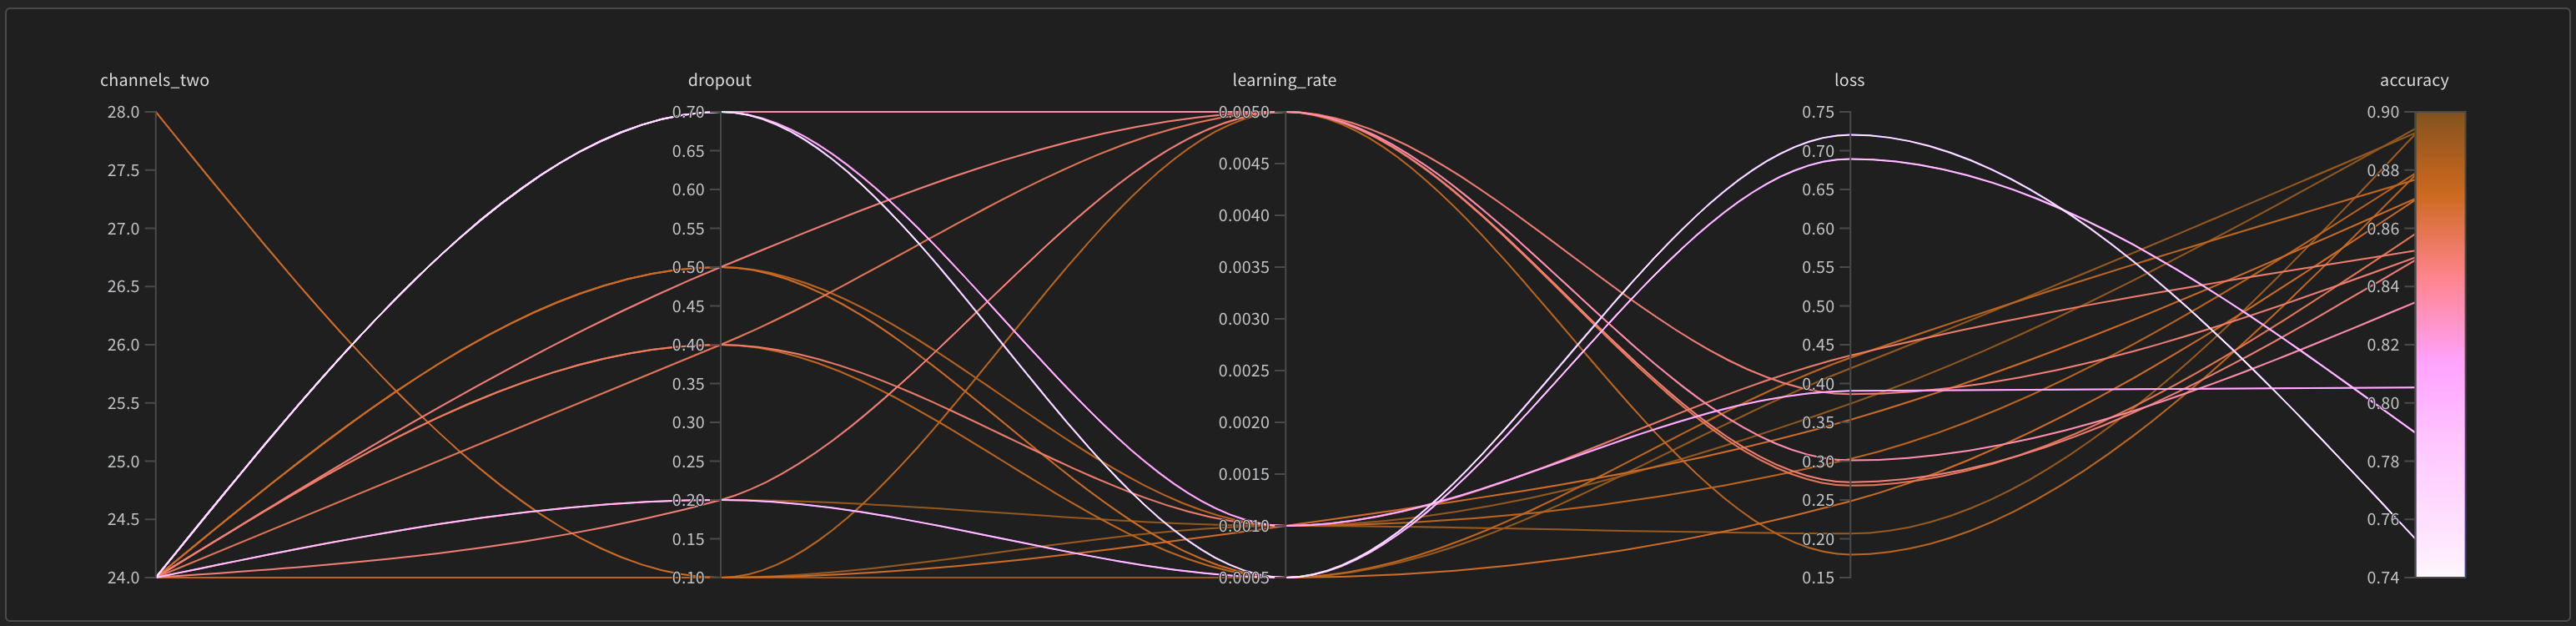
 Parallel coordinates charts summarize the relationship between large numbers of hyperparameters and model metrics at a glance. For more information on parallel coordinates plots, see [Parallel coordinates](/models/app/features/panels/parallel-coordinates/).
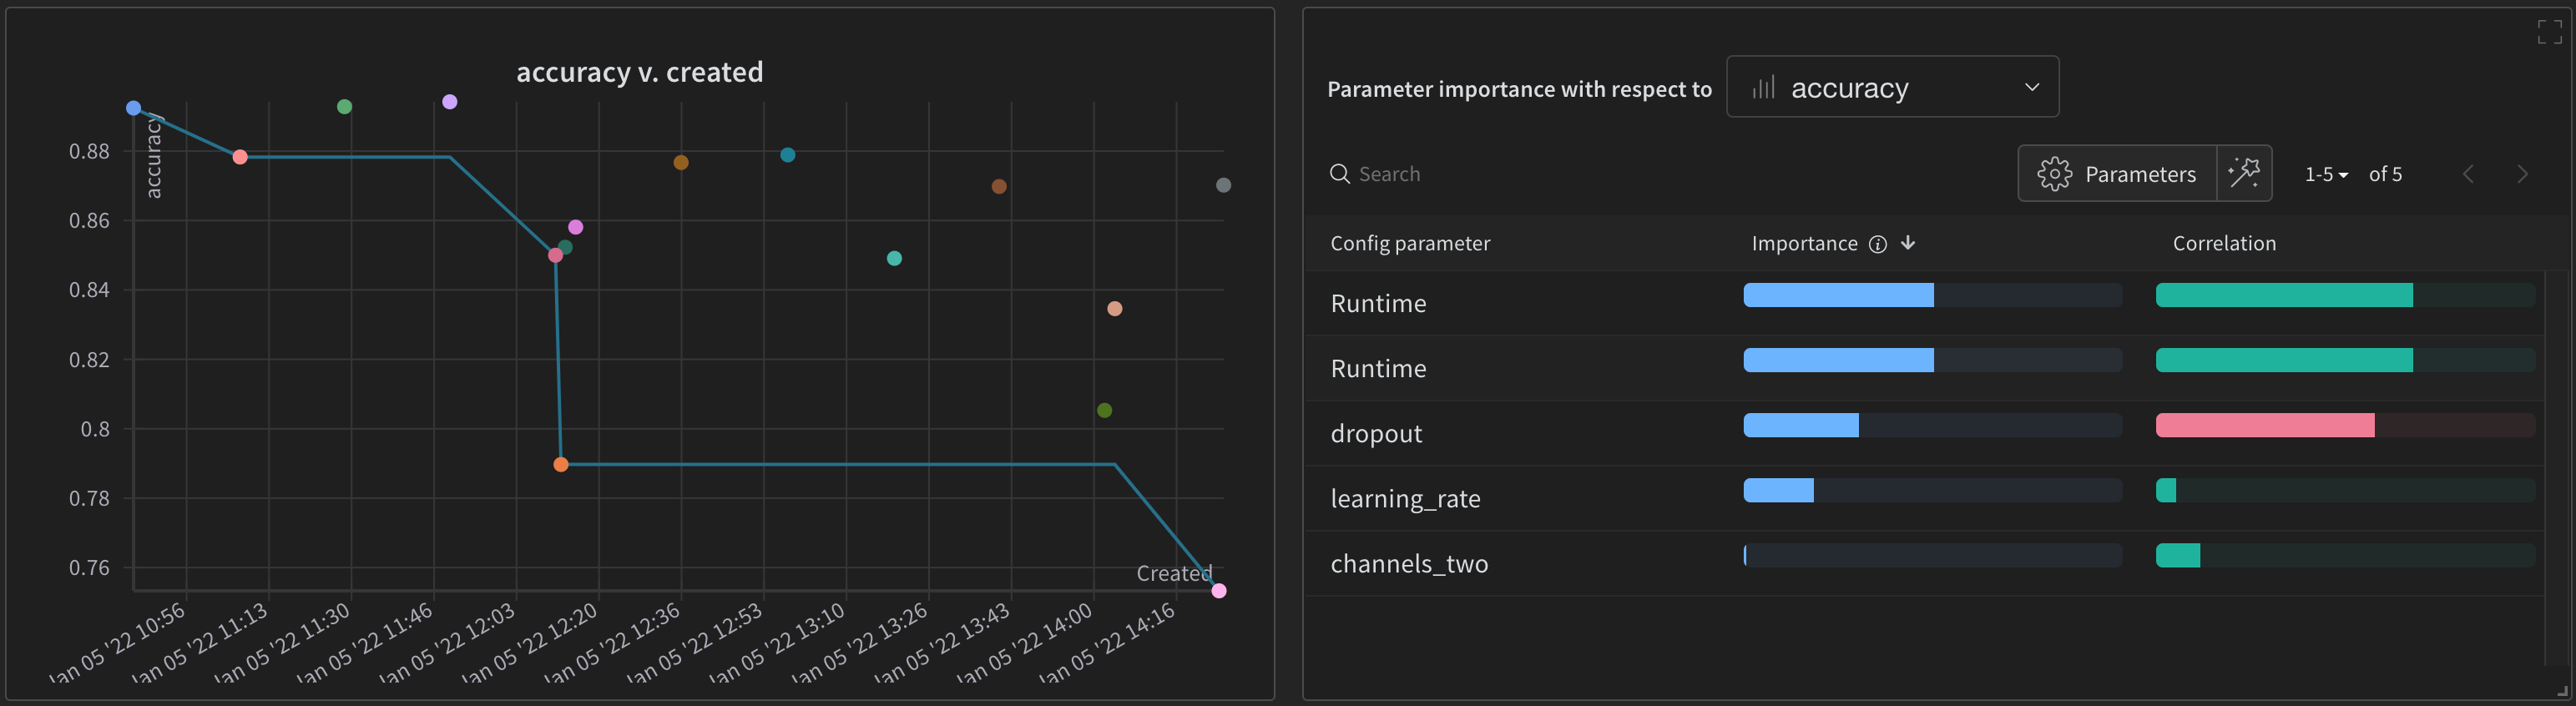
 The scatter plot(left) compares the W\&B Runs that were generated during the Sweep. For more information about scatter plots, see [Scatter Plots](/models/app/features/panels/scatter-plot/).
The parameter importance plot(right) lists the hyperparameters that were the best predictors of, and highly correlated to desirable values of your metrics. For more information on parameter importance plots, see [Parameter Importance](/models/app/features/panels/parameter-importance/).
The scatter plot(left) compares the W\&B Runs that were generated during the Sweep. For more information about scatter plots, see [Scatter Plots](/models/app/features/panels/scatter-plot/).
The parameter importance plot(right) lists the hyperparameters that were the best predictors of, and highly correlated to desirable values of your metrics. For more information on parameter importance plots, see [Parameter Importance](/models/app/features/panels/parameter-importance/).
 You can alter the dependent and independent values (x and y axis) that are automatically used. Within each panel there is a pencil icon called **Edit panel**. Choose **Edit panel**. A model will appear. Within the modal, you can alter the behavior of the graph.
For more information on all default W\&B visualization options, see [Panels](/models/app/features/panels/). See the [Data Visualization docs](/models/tables/) for information on how to create plots from W\&B Runs that are not part of a W\&B Sweep.
You can alter the dependent and independent values (x and y axis) that are automatically used. Within each panel there is a pencil icon called **Edit panel**. Choose **Edit panel**. A model will appear. Within the modal, you can alter the behavior of the graph.
For more information on all default W\&B visualization options, see [Panels](/models/app/features/panels/). See the [Data Visualization docs](/models/tables/) for information on how to create plots from W\&B Runs that are not part of a W\&B Sweep.