> ## Documentation Index
> Fetch the complete documentation index at: https://docs.wandb.ai/llms.txt
> Use this file to discover all available pages before exploring further.
> Iterate on datasets and understand model predictions
# Tables overview
export const TryProductLink = ({url}) =>
Try in W&B
;
export const ColabLink = ({url}) =>
Try in Colab
;
Use W\&B Tables to visualize and query tabular data. For example:
* Compare how different models perform on the same test set
* Identify patterns in your data
* Look at sample model predictions visually
* Query to find commonly misclassified examples
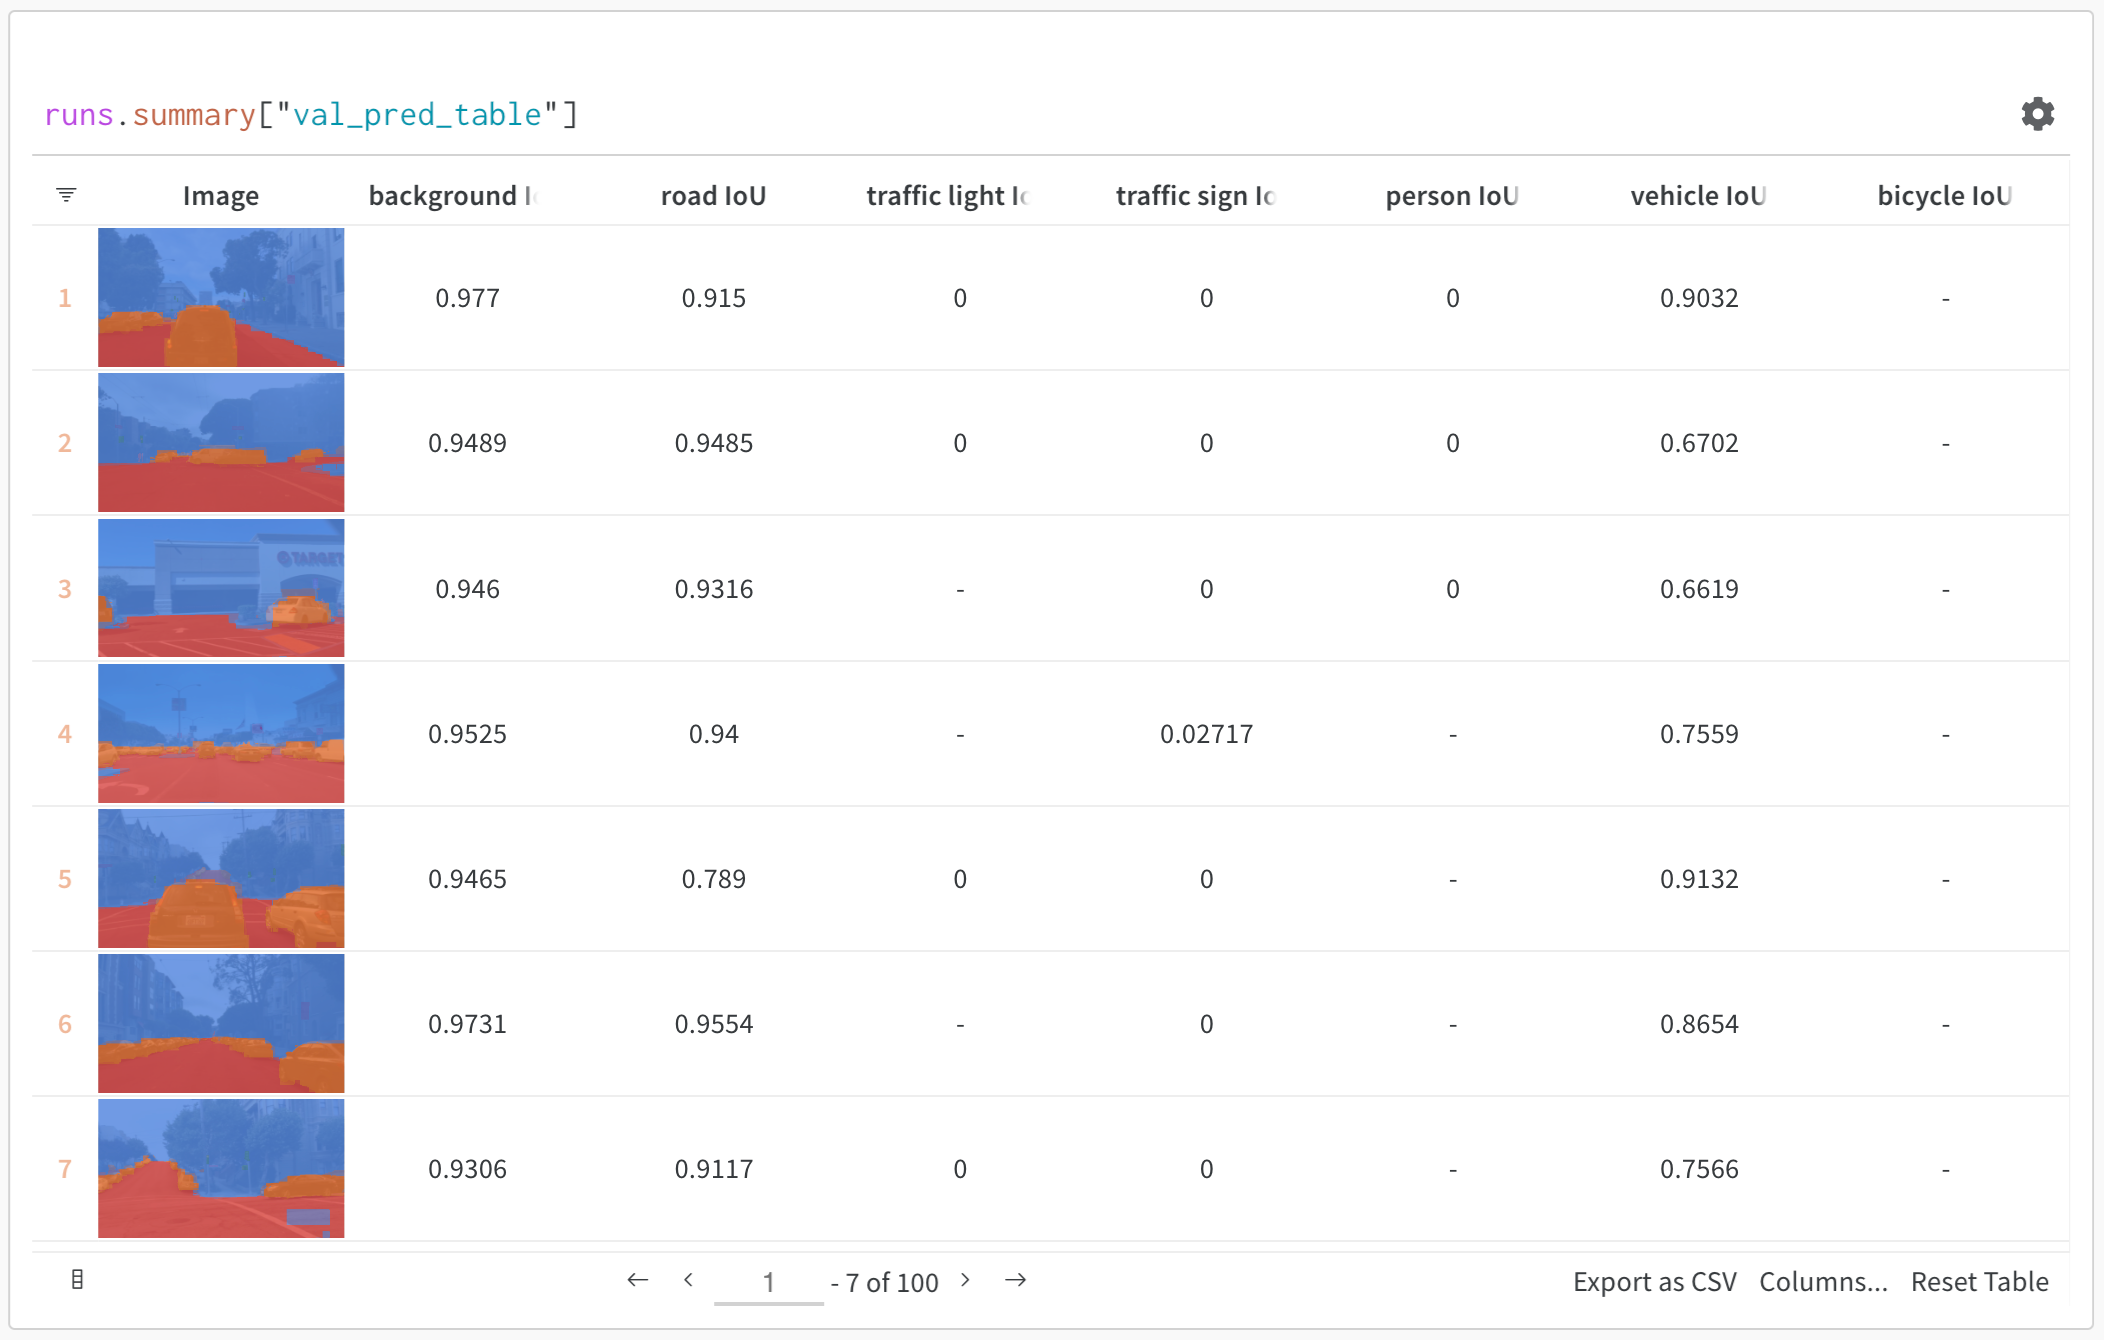
The above image shows a table with semantic segmentation and custom metrics. View this table here in this [sample project from the W\&B ML Course](https://wandb.ai/av-team/mlops-course-001).
## How it works
A Table is a two-dimensional grid of data where each column has a single type of data. Tables support primitive and numeric types, as well as nested lists, dictionaries, and rich media types.
## Log a Table
Log a table with a few lines of code:
* [`wandb.init()`](/models/ref/python/functions/init): Create a [run](/models/runs/) to track results.
* [`wandb.Table()`](/models/ref/python/data-types/table): Create a new table object.
* `columns`: Set the column names.
* `data`: Set the contents of the table.
* [`run.log()`](/models/ref/python/experiments/run.md/#method-runlog): Log the table to save it to W\&B.
```python theme={null}
import wandb
with wandb.init(project="table-test") as run:
my_table = wandb.Table(columns=["a", "b"], data=[["a1", "b1"], ["a2", "b2"]])
run.log({"Table Name": my_table})
```
## How to get started
* [Quickstart](/models/tables/tables-walkthrough/): Learn to log data tables, visualize data, and query data.
* [Tables Gallery](/models/tables/tables-gallery/): See example use cases for Tables.
 The above image shows a table with semantic segmentation and custom metrics. View this table here in this [sample project from the W\&B ML Course](https://wandb.ai/av-team/mlops-course-001).
## How it works
A Table is a two-dimensional grid of data where each column has a single type of data. Tables support primitive and numeric types, as well as nested lists, dictionaries, and rich media types.
## Log a Table
Log a table with a few lines of code:
* [`wandb.init()`](/models/ref/python/functions/init): Create a [run](/models/runs/) to track results.
* [`wandb.Table()`](/models/ref/python/data-types/table): Create a new table object.
* `columns`: Set the column names.
* `data`: Set the contents of the table.
* [`run.log()`](/models/ref/python/experiments/run.md/#method-runlog): Log the table to save it to W\&B.
```python theme={null}
import wandb
with wandb.init(project="table-test") as run:
my_table = wandb.Table(columns=["a", "b"], data=[["a1", "b1"], ["a2", "b2"]])
run.log({"Table Name": my_table})
```
## How to get started
* [Quickstart](/models/tables/tables-walkthrough/): Learn to log data tables, visualize data, and query data.
* [Tables Gallery](/models/tables/tables-gallery/): See example use cases for Tables.
The above image shows a table with semantic segmentation and custom metrics. View this table here in this [sample project from the W\&B ML Course](https://wandb.ai/av-team/mlops-course-001).
## How it works
A Table is a two-dimensional grid of data where each column has a single type of data. Tables support primitive and numeric types, as well as nested lists, dictionaries, and rich media types.
## Log a Table
Log a table with a few lines of code:
* [`wandb.init()`](/models/ref/python/functions/init): Create a [run](/models/runs/) to track results.
* [`wandb.Table()`](/models/ref/python/data-types/table): Create a new table object.
* `columns`: Set the column names.
* `data`: Set the contents of the table.
* [`run.log()`](/models/ref/python/experiments/run.md/#method-runlog): Log the table to save it to W\&B.
```python theme={null}
import wandb
with wandb.init(project="table-test") as run:
my_table = wandb.Table(columns=["a", "b"], data=[["a1", "b1"], ["a2", "b2"]])
run.log({"Table Name": my_table})
```
## How to get started
* [Quickstart](/models/tables/tables-walkthrough/): Learn to log data tables, visualize data, and query data.
* [Tables Gallery](/models/tables/tables-gallery/): See example use cases for Tables.