> ## Documentation Index
> Fetch the complete documentation index at: https://docs.wandb.ai/llms.txt
> Use this file to discover all available pages before exploring further.
> Explore example W&B Tables projects for image classification, audio, text analysis, and other use cases.
# Example tables
The following sections highlight some of the ways you can use tables:
### View your data
Log metrics and rich media during model training or evaluation, then visualize results in a persistent database synced to the cloud, or to your [hosting instance](/platform/hosting).
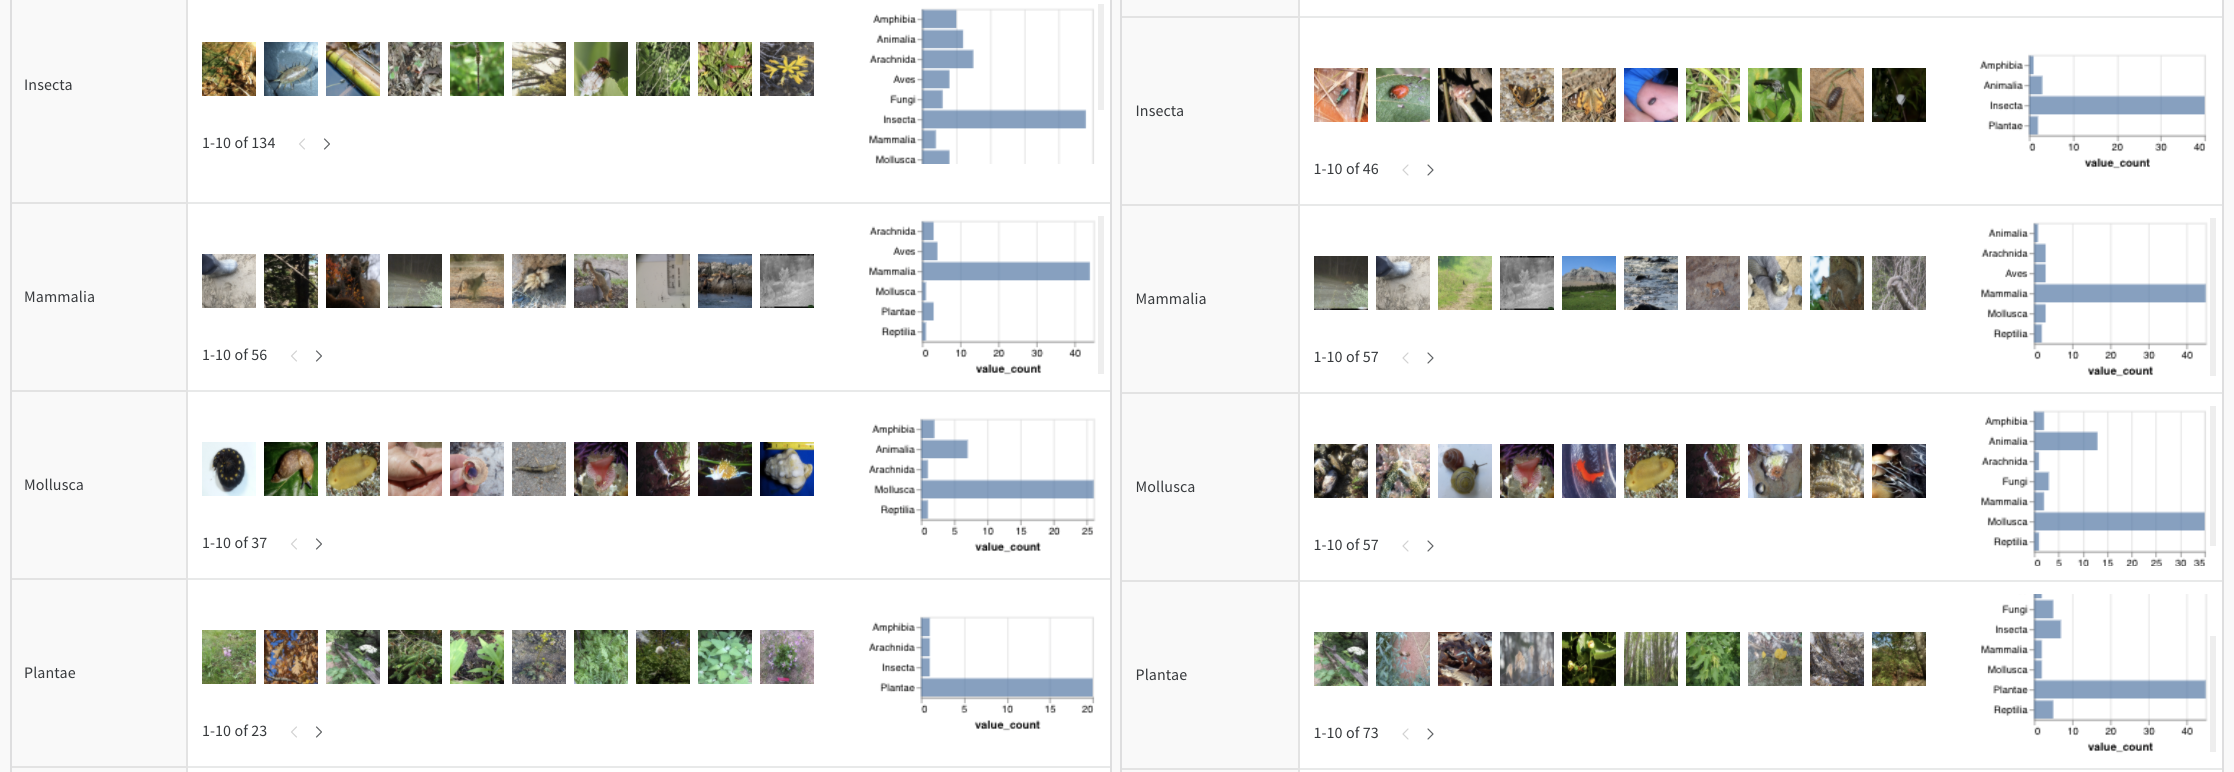
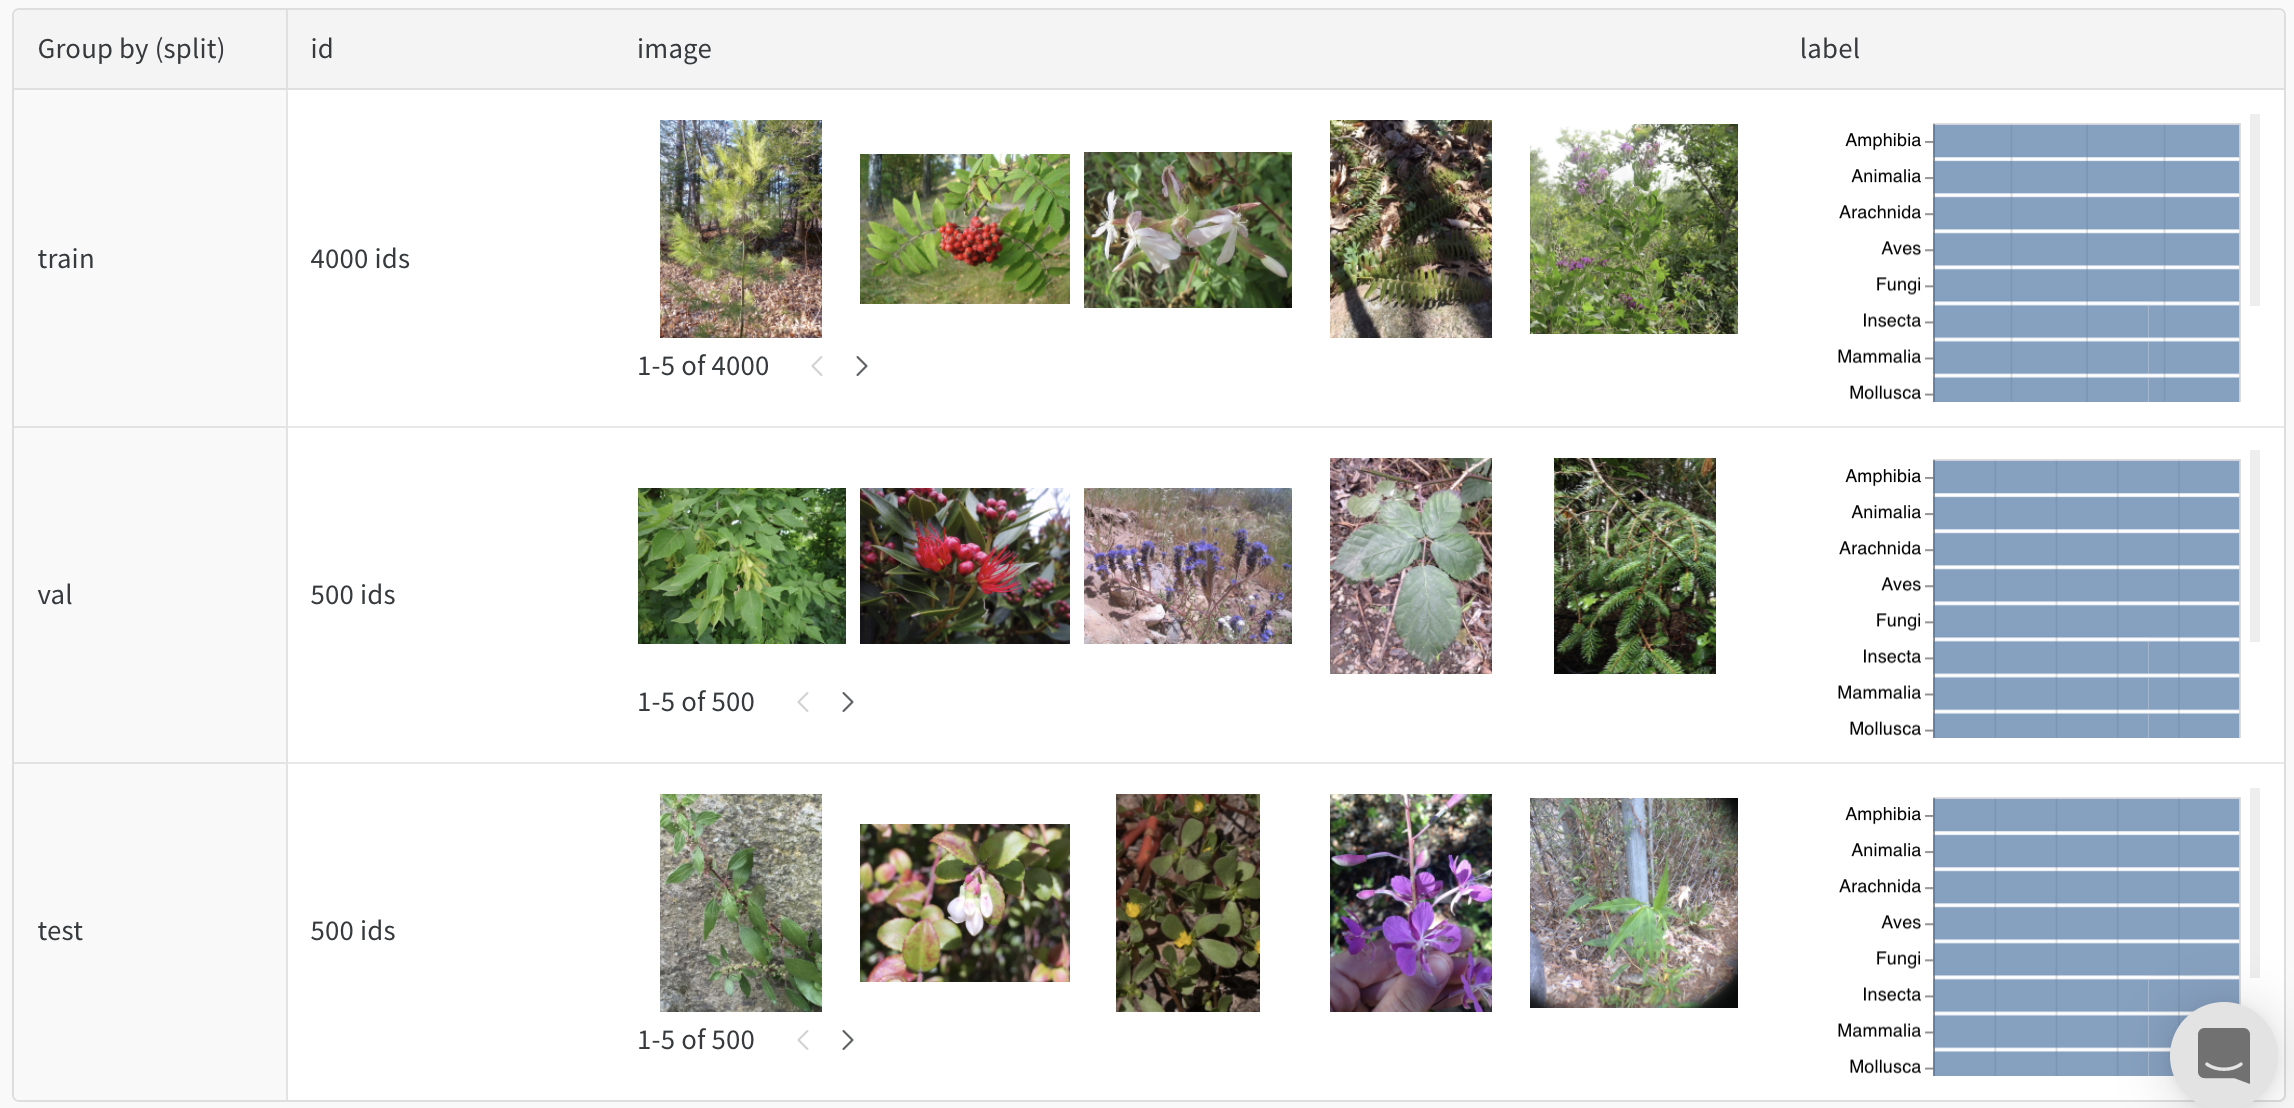 For example, check out this table that shows a [balanced split of a photos dataset](https://wandb.ai/stacey/mendeleev/artifacts/balanced_data/inat_80-10-10_5K/ab79f01e007113280018/files/data_split.table.json).
### Interactively explore your data
View, sort, filter, group, join, and query tables to understand your data and model performance—no need to browse static files or rerun analysis scripts.
For example, check out this table that shows a [balanced split of a photos dataset](https://wandb.ai/stacey/mendeleev/artifacts/balanced_data/inat_80-10-10_5K/ab79f01e007113280018/files/data_split.table.json).
### Interactively explore your data
View, sort, filter, group, join, and query tables to understand your data and model performance—no need to browse static files or rerun analysis scripts.
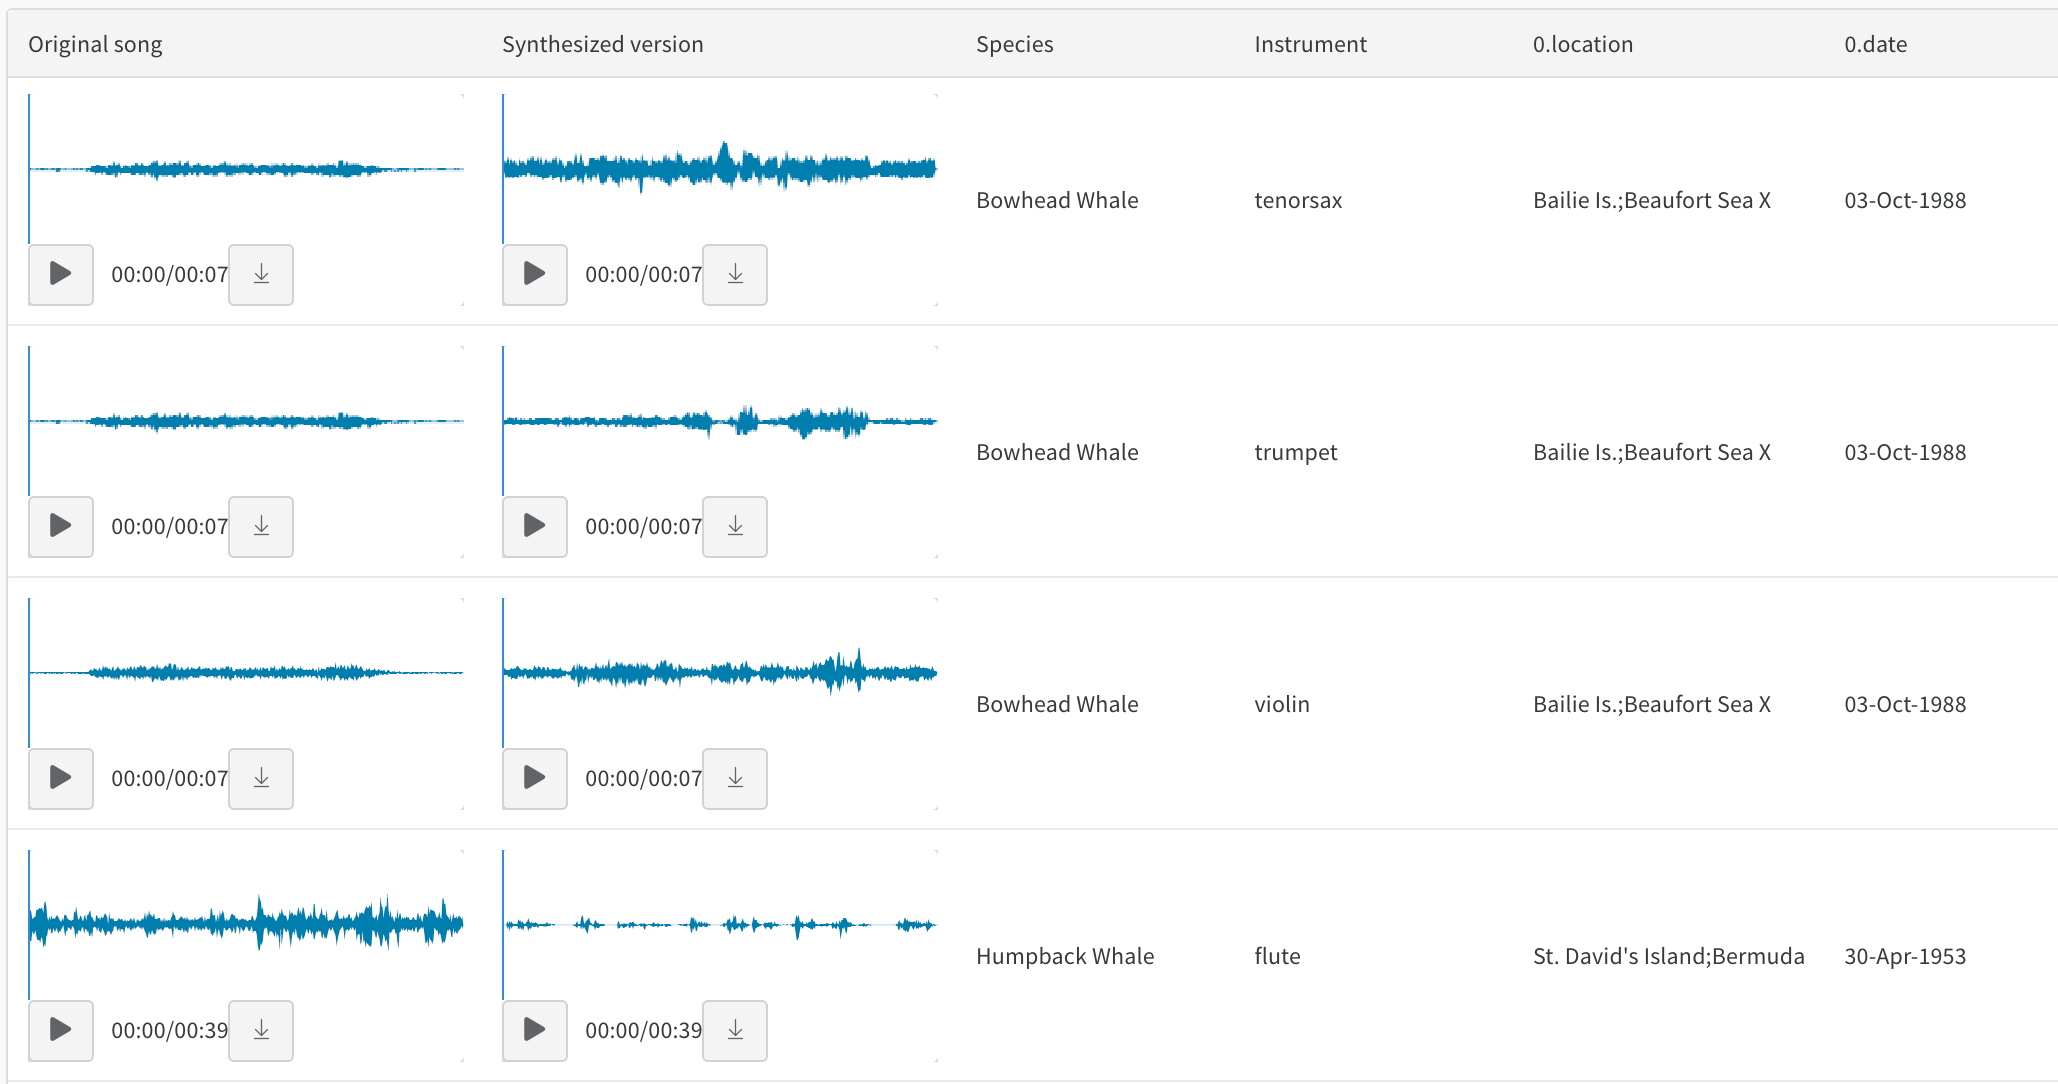 For example, see this report on [style-transferred audio](https://wandb.ai/stacey/cshanty/reports/Whale2Song-W-B-Tables-for-Audio--Vmlldzo4NDI3NzM).
### Compare model versions
Quickly compare results across different training epochs, datasets, hyperparameter choices, model architectures etc.
For example, see this report on [style-transferred audio](https://wandb.ai/stacey/cshanty/reports/Whale2Song-W-B-Tables-for-Audio--Vmlldzo4NDI3NzM).
### Compare model versions
Quickly compare results across different training epochs, datasets, hyperparameter choices, model architectures etc.
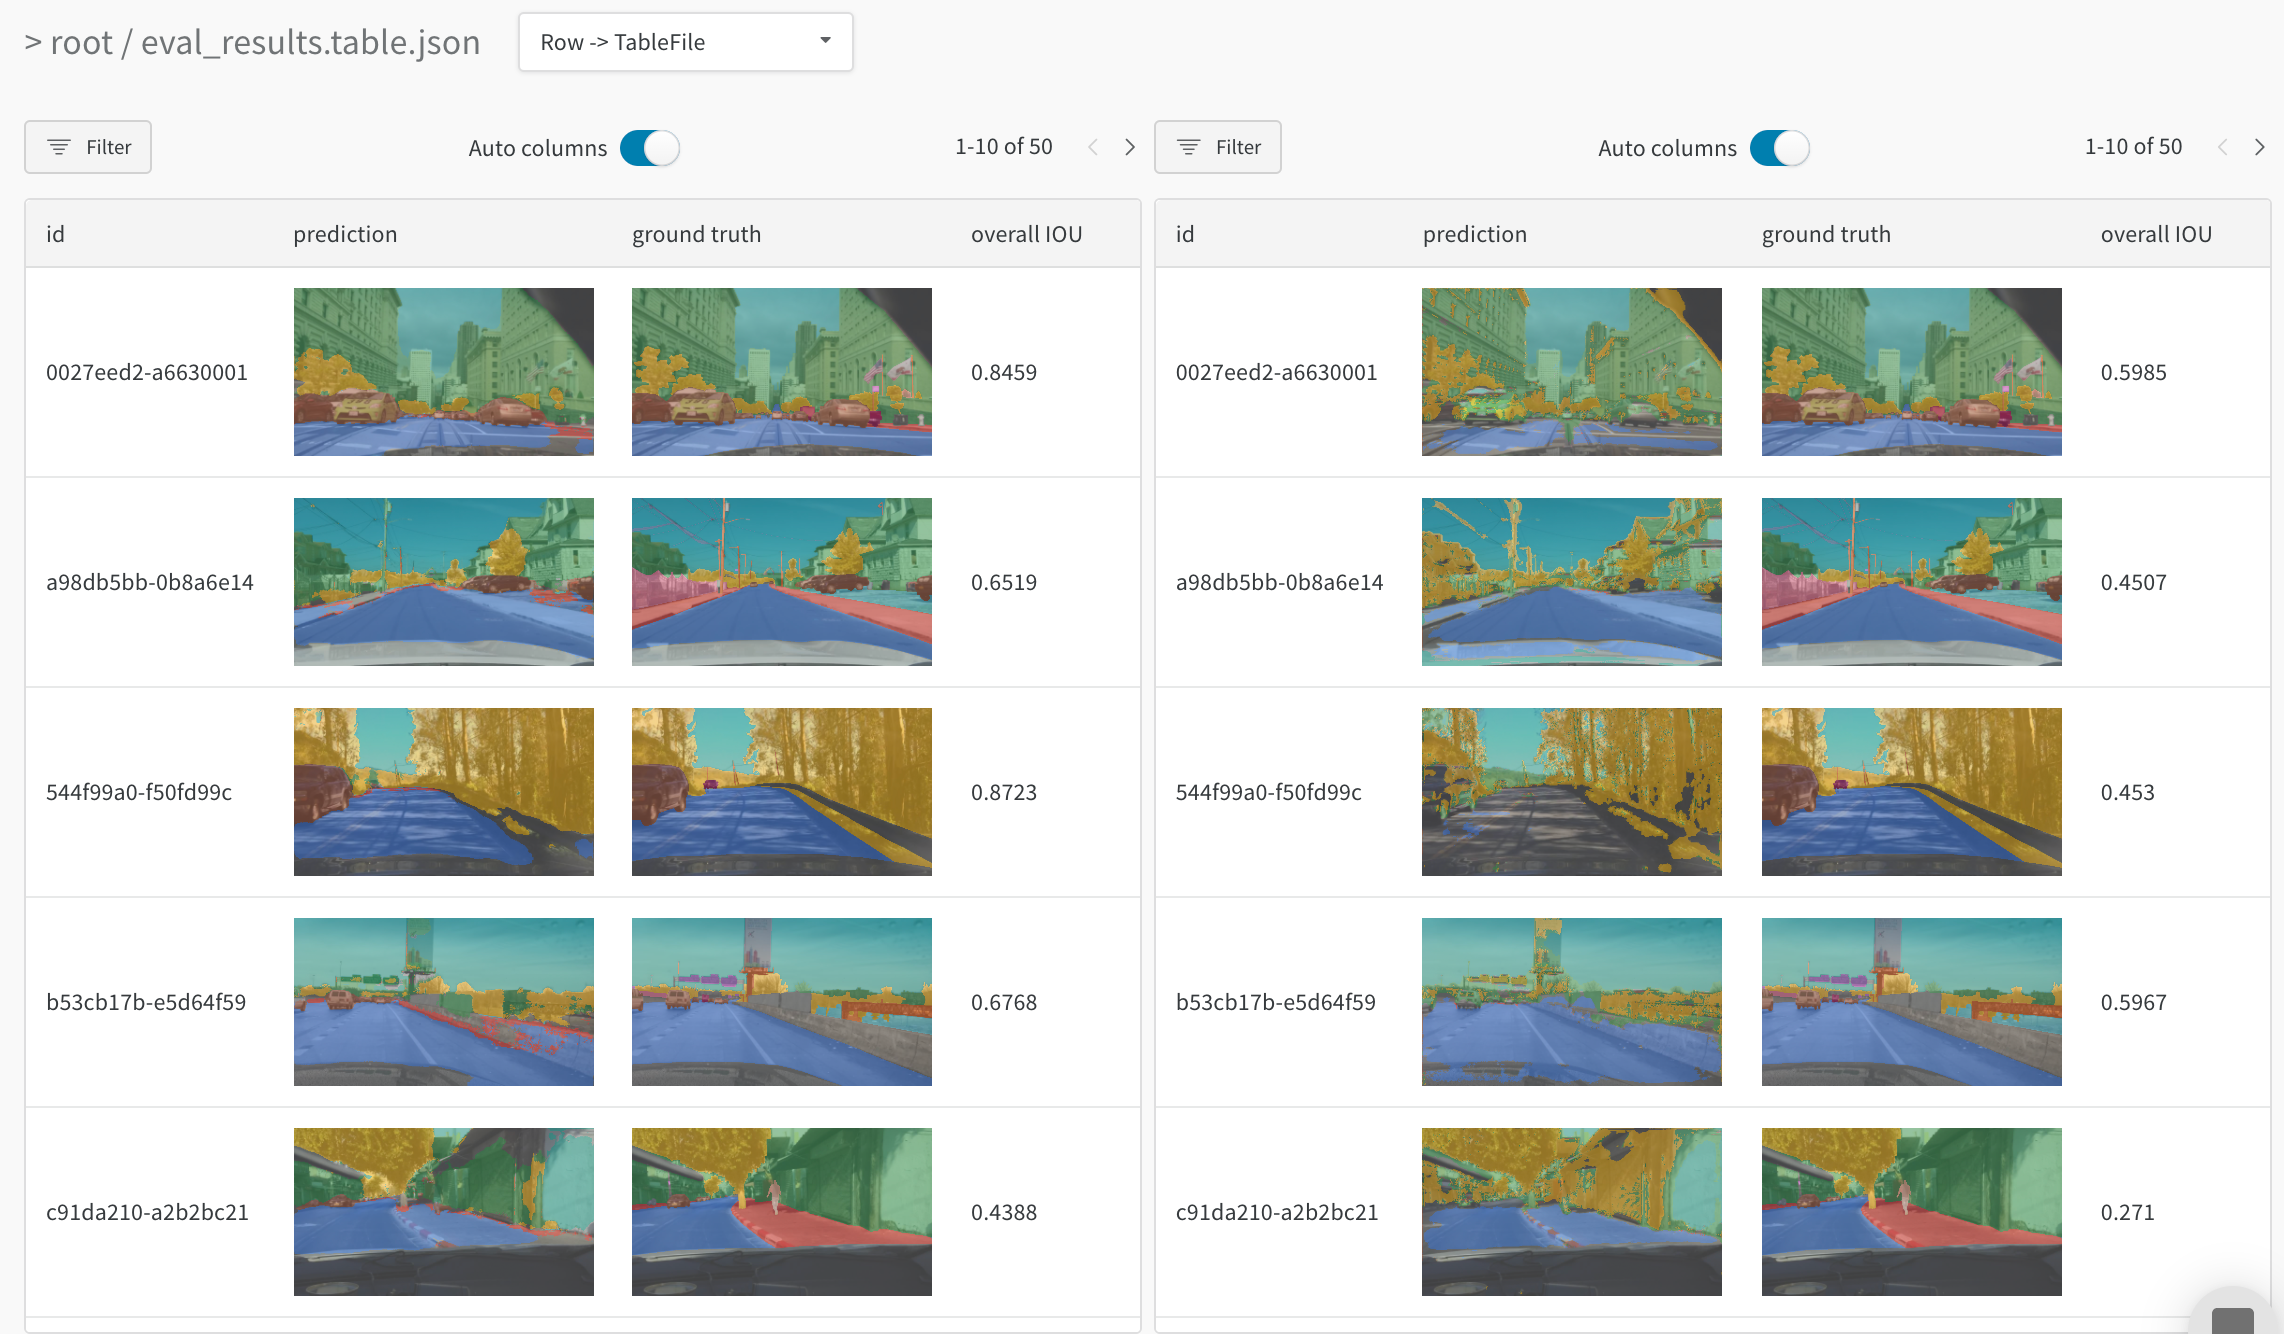 For example, see this table that compares [two models on the same test images](https://wandb.ai/stacey/evalserver_answers_2/artifacts/results/eval_Daenerys/c2290abd3d7274f00ad8/files/eval_results.table.json#b6dae62d4f00d31eeebf\$eval_Bob).
### Track every detail and see the bigger picture
Zoom in to visualize a specific prediction at a specific step. Zoom out to see the aggregate statistics, identify patterns of errors, and understand opportunities for improvement. This tool works for comparing steps from a single model training, or results across different model versions.
For example, see this table that compares [two models on the same test images](https://wandb.ai/stacey/evalserver_answers_2/artifacts/results/eval_Daenerys/c2290abd3d7274f00ad8/files/eval_results.table.json#b6dae62d4f00d31eeebf\$eval_Bob).
### Track every detail and see the bigger picture
Zoom in to visualize a specific prediction at a specific step. Zoom out to see the aggregate statistics, identify patterns of errors, and understand opportunities for improvement. This tool works for comparing steps from a single model training, or results across different model versions.
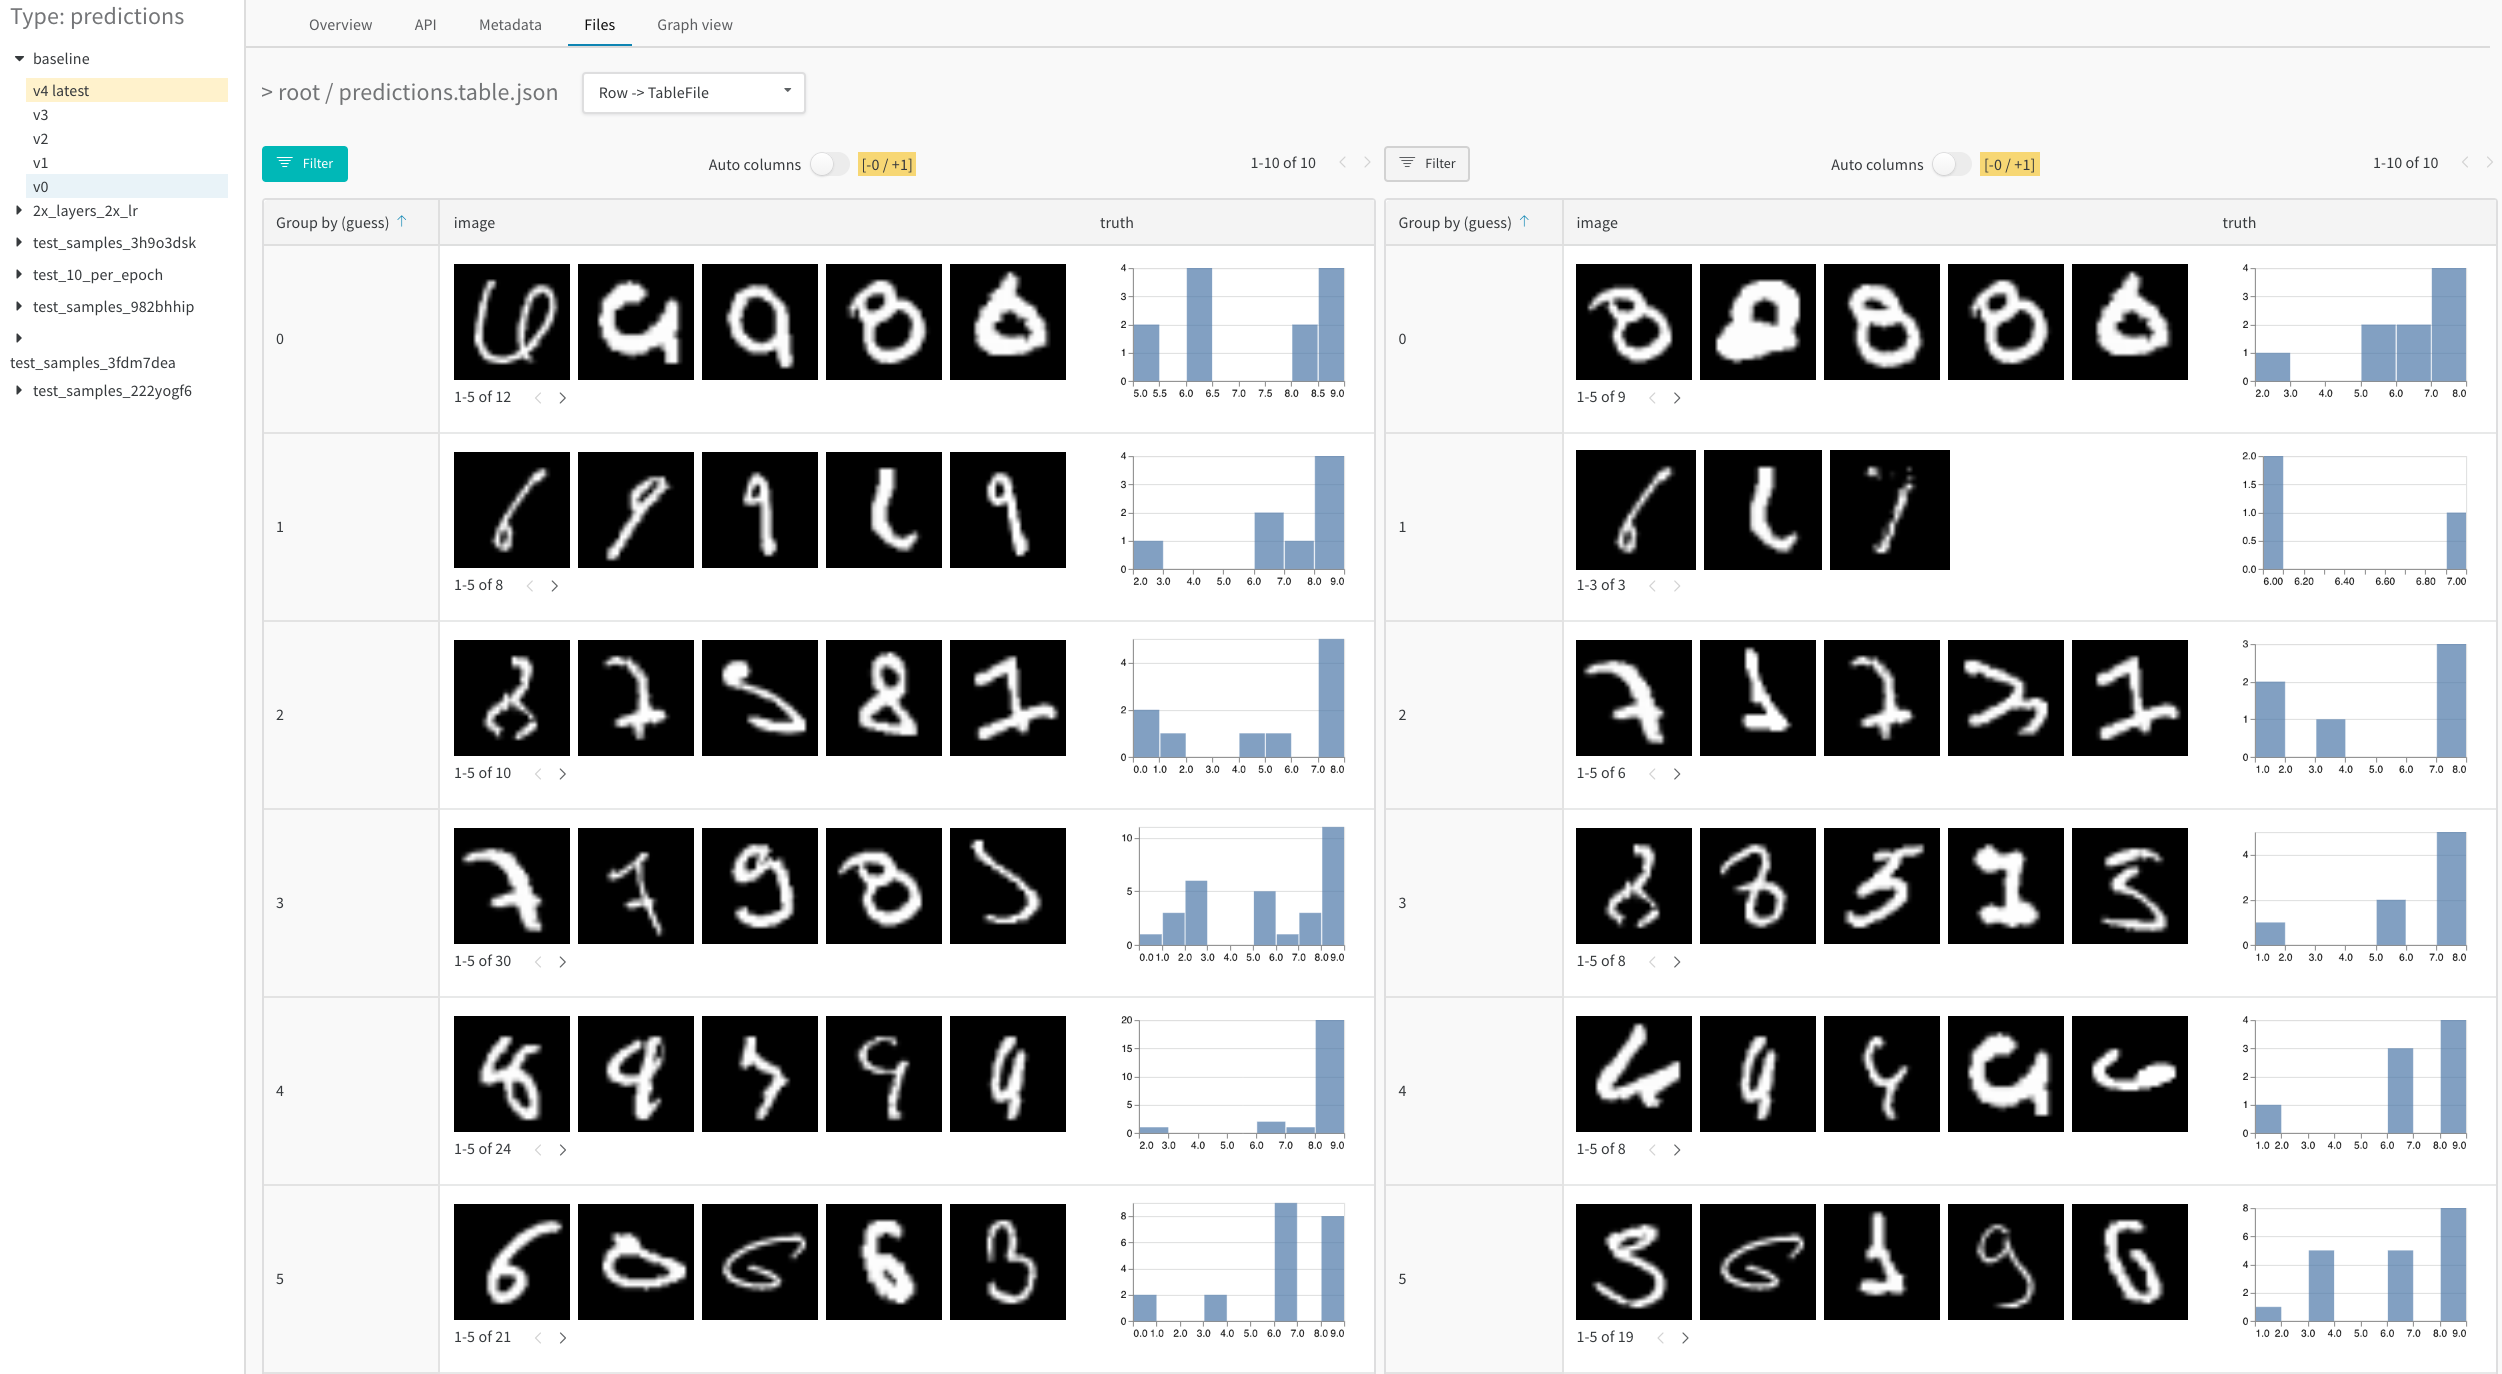 For example, see this example table that analyzes results [after one and then after five epochs on the MNIST dataset](https://wandb.ai/stacey/mnist-viz/artifacts/predictions/baseline/d888bc05719667811b23/files/predictions.table.json#7dd0cd845c0edb469dec).
## Example Projects with W\&B Tables
The following highlight some real W\&B Projects that use W\&B Tables.
### Image classification
Read [Visualize Data for Image Classification](https://wandb.ai/stacey/mendeleev/reports/Visualize-Data-for-Image-Classification--VmlldzozNjE3NjA), follow the [data visualization nature Colab](https://wandb.me/dsviz-nature-colab), or explore the [artifacts context](https://wandb.ai/stacey/mendeleev/artifacts/val_epoch_preds/val_pred_gawf9z8j/2dcee8fa22863317472b/files/val_epoch_res.table.json) to see how a CNN identifies ten types of living things (plants, bird, insects, etc) from [iNaturalist](https://www.inaturalist.org/pages/developers) photos.
For example, see this example table that analyzes results [after one and then after five epochs on the MNIST dataset](https://wandb.ai/stacey/mnist-viz/artifacts/predictions/baseline/d888bc05719667811b23/files/predictions.table.json#7dd0cd845c0edb469dec).
## Example Projects with W\&B Tables
The following highlight some real W\&B Projects that use W\&B Tables.
### Image classification
Read [Visualize Data for Image Classification](https://wandb.ai/stacey/mendeleev/reports/Visualize-Data-for-Image-Classification--VmlldzozNjE3NjA), follow the [data visualization nature Colab](https://wandb.me/dsviz-nature-colab), or explore the [artifacts context](https://wandb.ai/stacey/mendeleev/artifacts/val_epoch_preds/val_pred_gawf9z8j/2dcee8fa22863317472b/files/val_epoch_res.table.json) to see how a CNN identifies ten types of living things (plants, bird, insects, etc) from [iNaturalist](https://www.inaturalist.org/pages/developers) photos.
 ### Audio
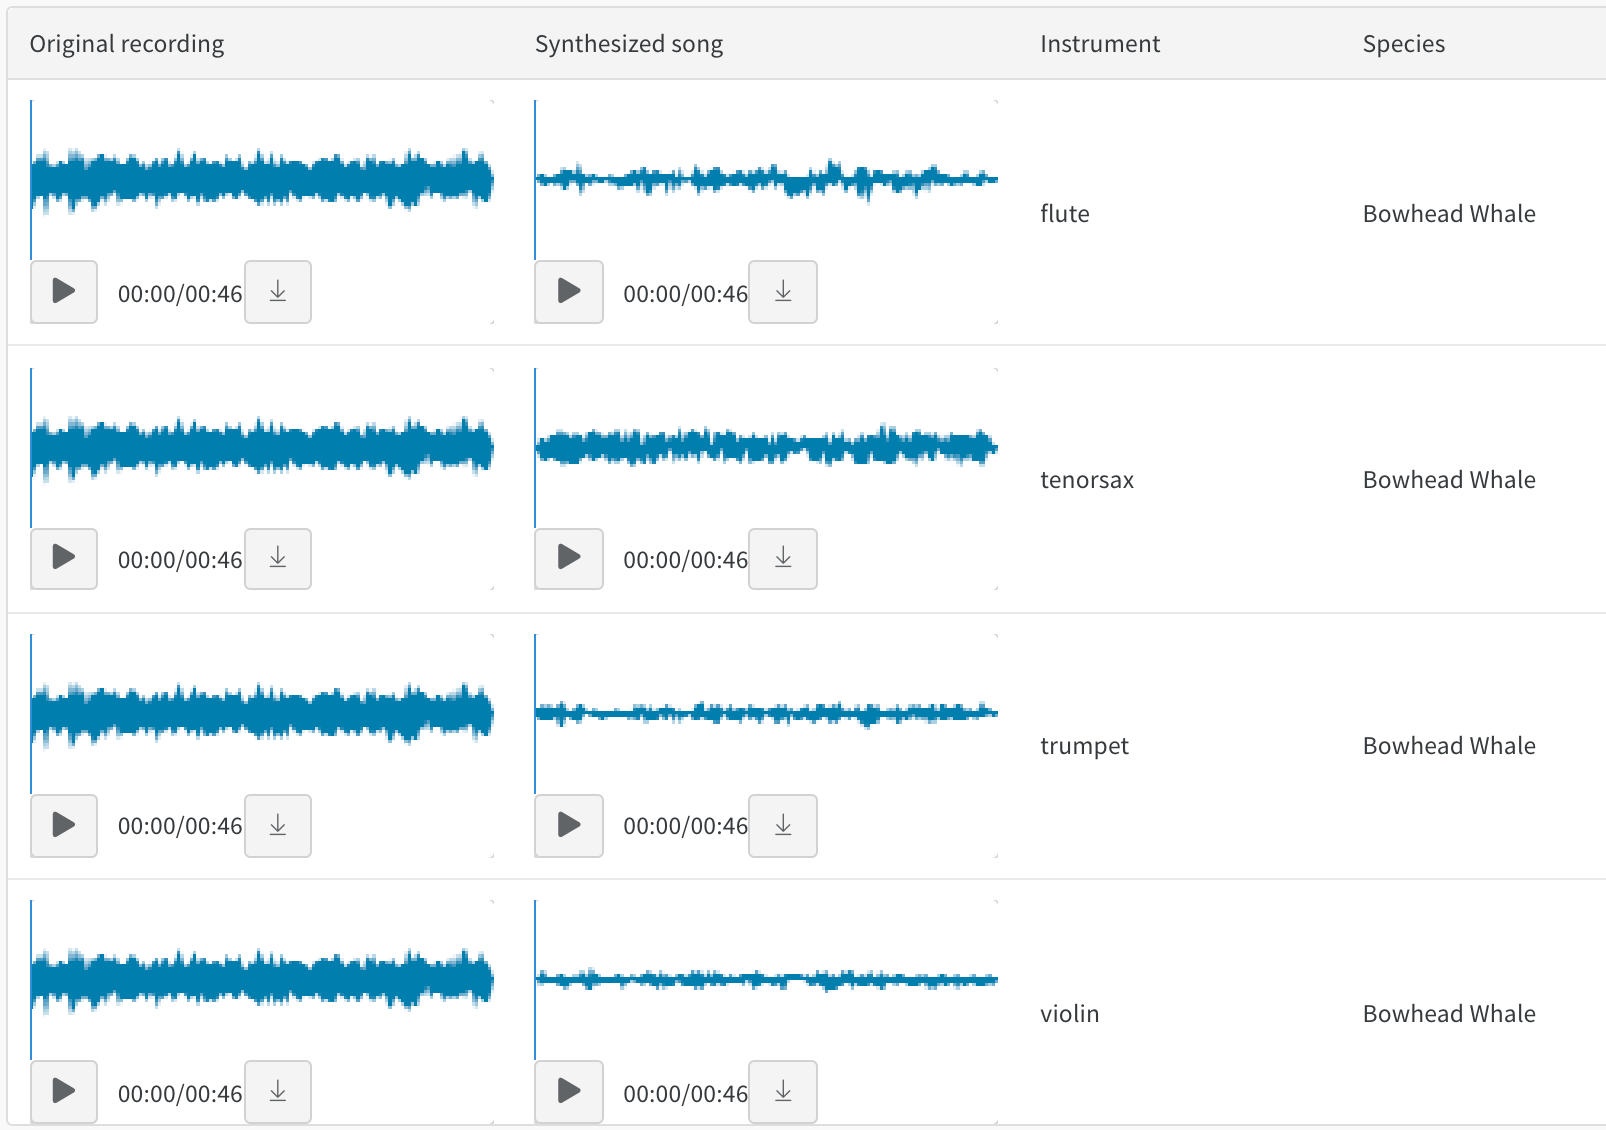
Interact with audio tables in [Whale2Song - W\&B Tables for Audio](https://wandb.ai/stacey/cshanty/reports/Whale2Song-W-B-Tables-for-Audio--Vmlldzo4NDI3NzM) on timbre transfer. You can compare a recorded whale song with a synthesized rendition of the same melody on an instrument like violin or trumpet. You can also record your own songs and explore their synthesized versions in W\&B with the [audio transfer Colab](http://wandb.me/audio-transfer).
### Audio
Interact with audio tables in [Whale2Song - W\&B Tables for Audio](https://wandb.ai/stacey/cshanty/reports/Whale2Song-W-B-Tables-for-Audio--Vmlldzo4NDI3NzM) on timbre transfer. You can compare a recorded whale song with a synthesized rendition of the same melody on an instrument like violin or trumpet. You can also record your own songs and explore their synthesized versions in W\&B with the [audio transfer Colab](http://wandb.me/audio-transfer).
 ### Text
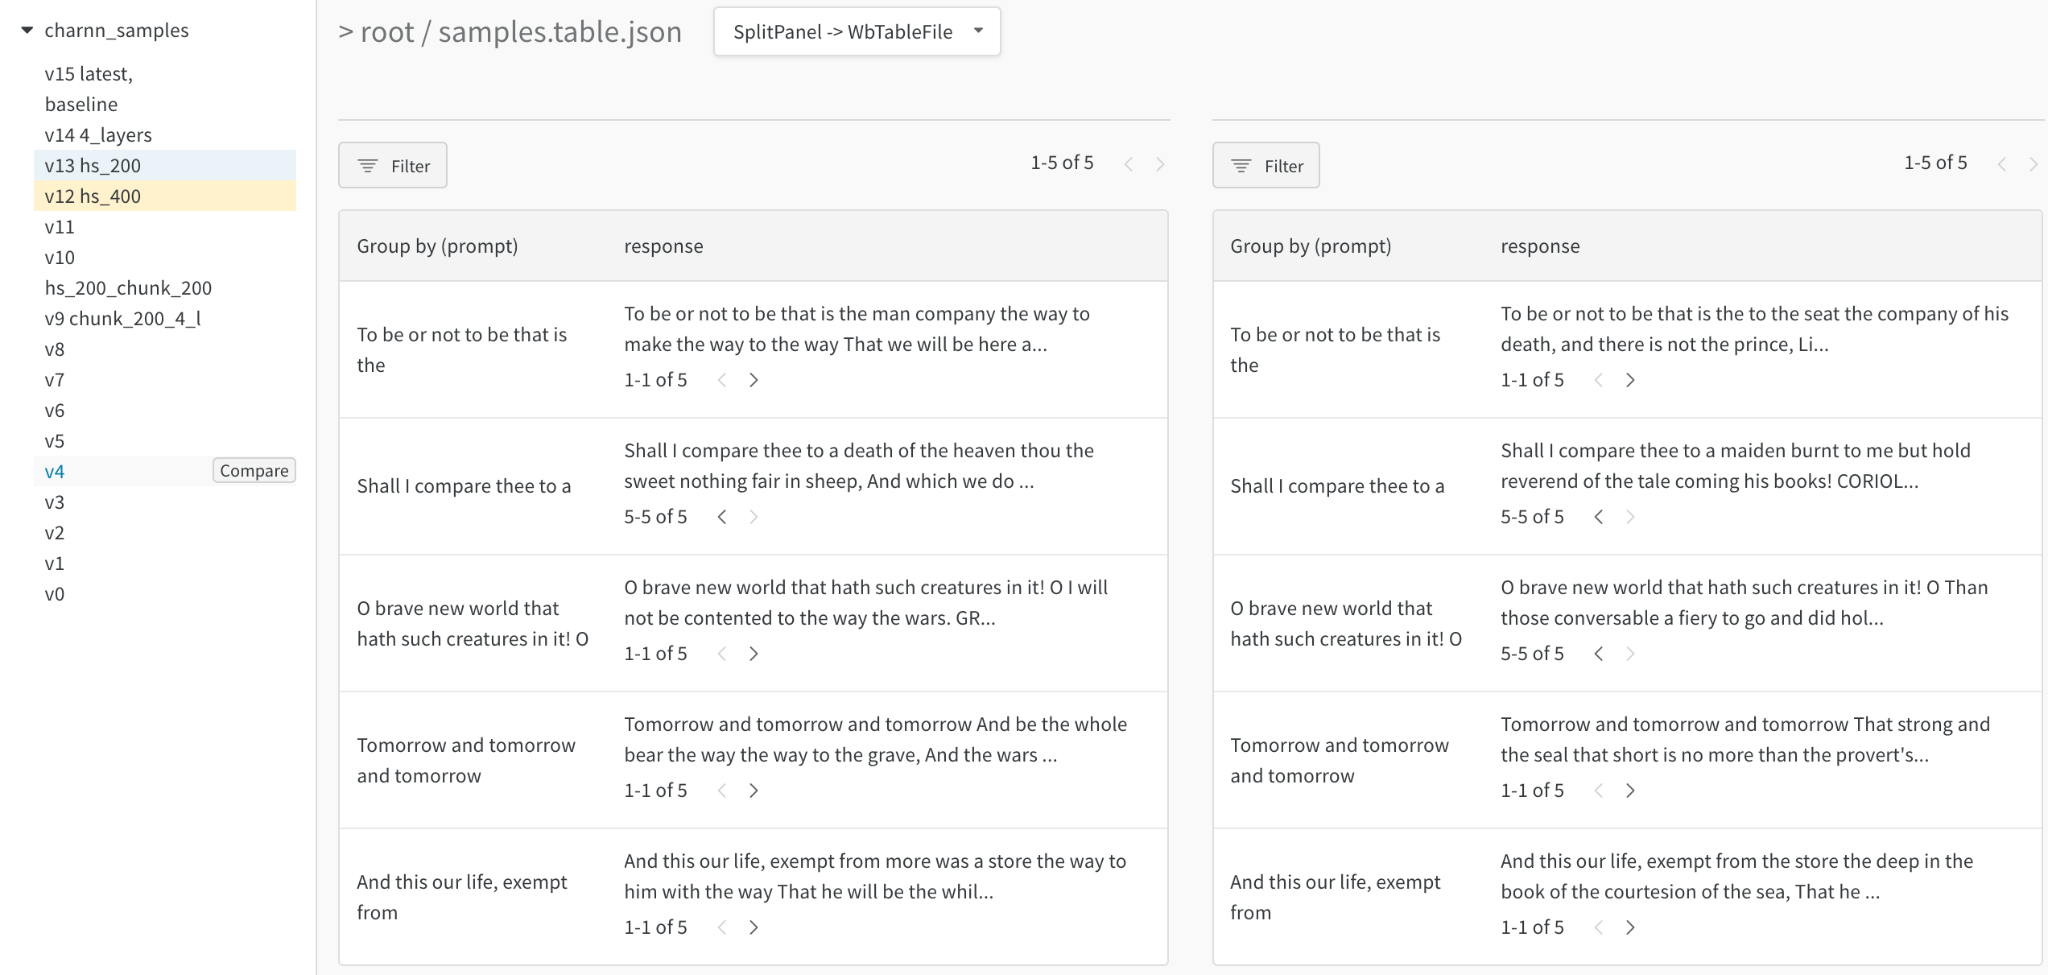
Browse text samples from training data or generated output, dynamically group by relevant fields, and align your evaluation across model variants or experiment settings. Render text as Markdown or use visual diff mode to compare texts. See the [Shakespeare text generation report](https://wandb.ai/stacey/nlg/reports/Visualize-Text-Data-Predictions--Vmlldzo1NzcwNzY) for an example of a character-based RNN.
### Text
Browse text samples from training data or generated output, dynamically group by relevant fields, and align your evaluation across model variants or experiment settings. Render text as Markdown or use visual diff mode to compare texts. See the [Shakespeare text generation report](https://wandb.ai/stacey/nlg/reports/Visualize-Text-Data-Predictions--Vmlldzo1NzcwNzY) for an example of a character-based RNN.
 ### Video
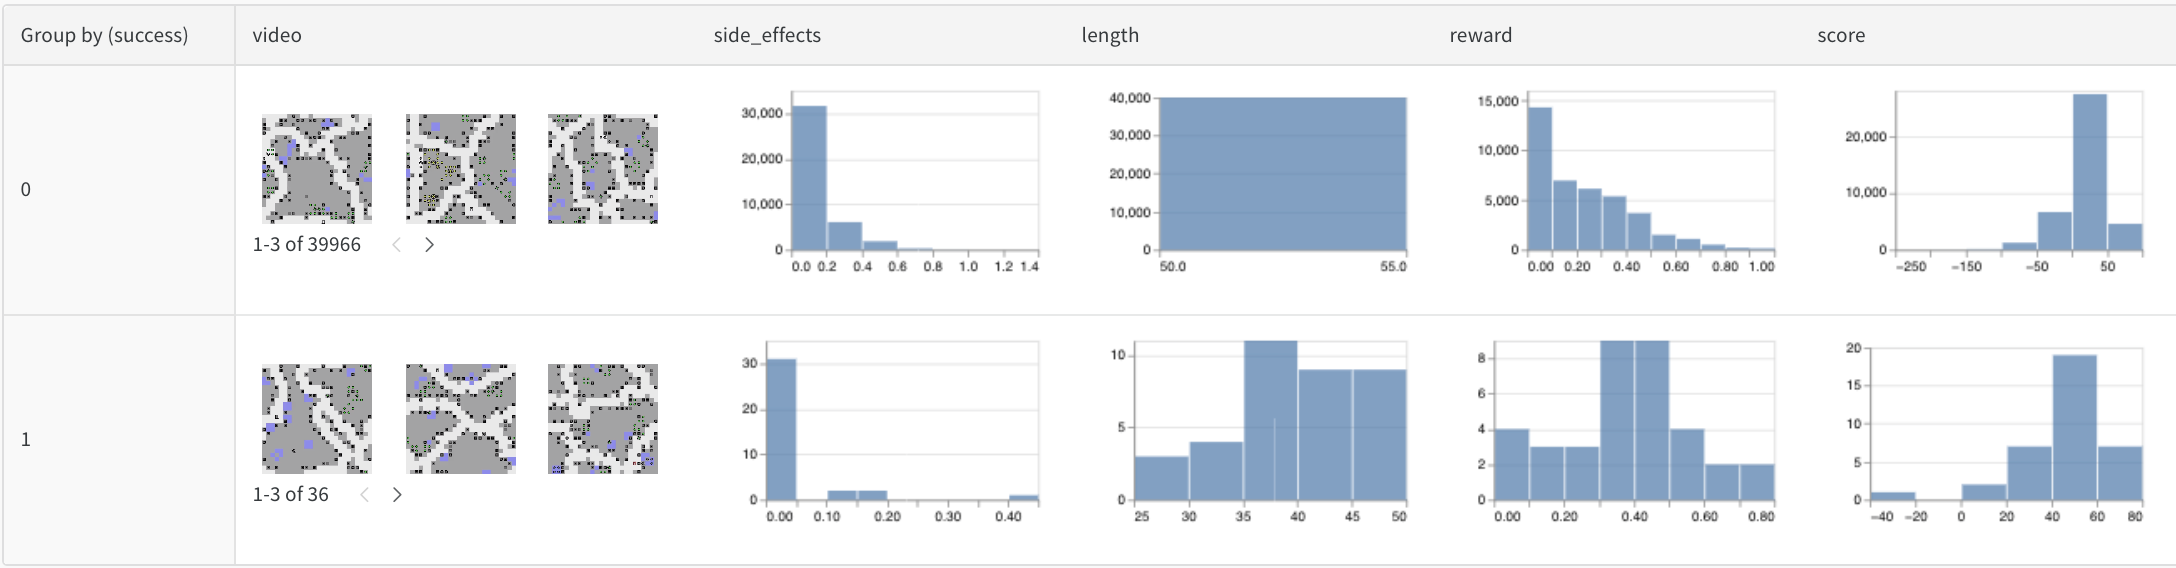
Browse and aggregate over videos logged during training to understand your models. Here is an early example using the [SafeLife benchmark](https://wandb.ai/safelife/v1dot2/benchmark) for RL agents seeking to [minimize side effects ](https://wandb.ai/stacey/saferlife/artifacts/video/videos_append-spawn/c1f92c6e27fa0725c154/files/video_examples.table.json)
### Video
Browse and aggregate over videos logged during training to understand your models. Here is an early example using the [SafeLife benchmark](https://wandb.ai/safelife/v1dot2/benchmark) for RL agents seeking to [minimize side effects ](https://wandb.ai/stacey/saferlife/artifacts/video/videos_append-spawn/c1f92c6e27fa0725c154/files/video_examples.table.json)
 ### Tabular data
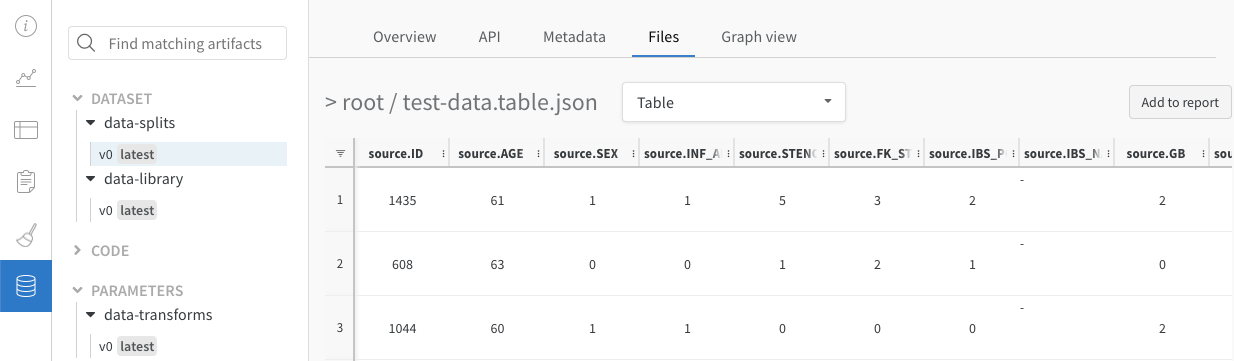
View a report on how to [split and pre-process tabular data](https://wandb.ai/dpaiton/splitting-tabular-data/reports/Tabular-Data-Versioning-and-Deduplication-with-Weights-Biases--VmlldzoxNDIzOTA1) with version control and de-duplication.
### Tabular data
View a report on how to [split and pre-process tabular data](https://wandb.ai/dpaiton/splitting-tabular-data/reports/Tabular-Data-Versioning-and-Deduplication-with-Weights-Biases--VmlldzoxNDIzOTA1) with version control and de-duplication.
 ### Comparing model variants (semantic segmentation)
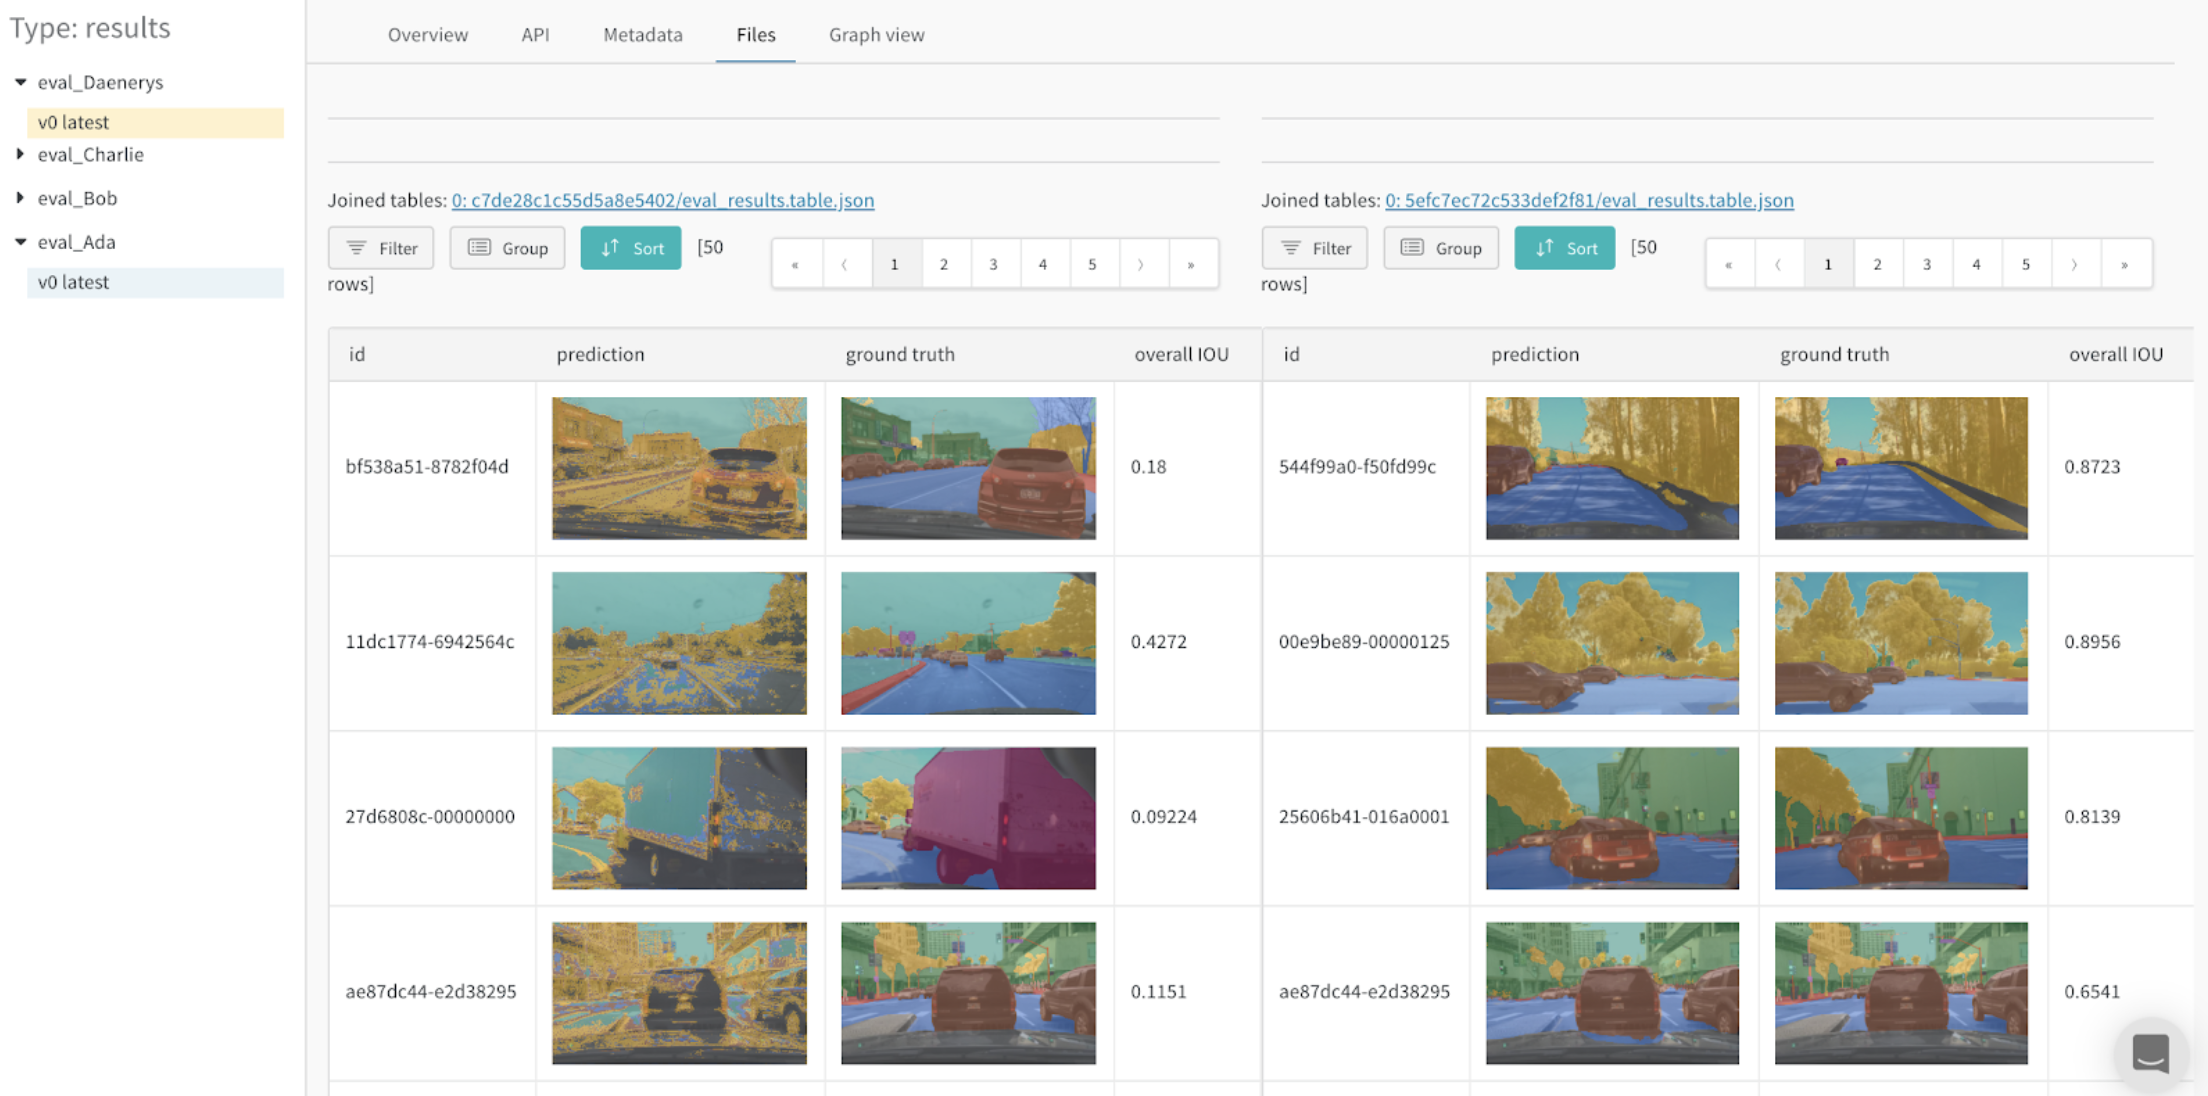
An [interactive notebook](https://wandb.me/dsviz-cars-demo) and [live example](https://wandb.ai/stacey/evalserver_answers_2/artifacts/results/eval_Daenerys/c2290abd3d7274f00ad8/files/eval_results.table.json#a57f8e412329727038c2\$eval_Ada) of logging Tables for semantic segmentation and comparing different models. Try your own queries [in this Table](https://wandb.ai/stacey/evalserver_answers_2/artifacts/results/eval_Daenerys/c2290abd3d7274f00ad8/files/eval_results.table.json).
### Comparing model variants (semantic segmentation)
An [interactive notebook](https://wandb.me/dsviz-cars-demo) and [live example](https://wandb.ai/stacey/evalserver_answers_2/artifacts/results/eval_Daenerys/c2290abd3d7274f00ad8/files/eval_results.table.json#a57f8e412329727038c2\$eval_Ada) of logging Tables for semantic segmentation and comparing different models. Try your own queries [in this Table](https://wandb.ai/stacey/evalserver_answers_2/artifacts/results/eval_Daenerys/c2290abd3d7274f00ad8/files/eval_results.table.json).
 ### Analyzing improvement over training time
A detailed report on how to [visualize predictions over time](https://wandb.ai/stacey/mnist-viz/reports/Visualize-Predictions-over-Time--Vmlldzo1OTQxMTk) and the accompanying [interactive notebook](https://wandb.me/dsviz-mnist-colab).
### Analyzing improvement over training time
A detailed report on how to [visualize predictions over time](https://wandb.ai/stacey/mnist-viz/reports/Visualize-Predictions-over-Time--Vmlldzo1OTQxMTk) and the accompanying [interactive notebook](https://wandb.me/dsviz-mnist-colab).