> ## Documentation Index
> Fetch the complete documentation index at: https://docs.wandb.ai/llms.txt
> Use this file to discover all available pages before exploring further.
> Track machine learning experiments with W&B to log metrics, hyperparameters, system metrics, and model artifacts.
# Experiments overview
export const TryProductLink = ({url}) =>
Try in W&B
;
export const ColabLink = ({url}) =>
Try in Colab
;
Track machine learning experiments with a few lines of code. You can then review the results in an [interactive dashboard](/models/track/workspaces/) or export your data to Python for programmatic access using our [Public API](/models/ref/python/public-api/).
Utilize W\&B Integrations if you use popular frameworks such as [Keras](/models/integrations/keras). See [W\&B Integrations](/models/integrations) for a full list of integrations and information on how to add W\&B to your code.
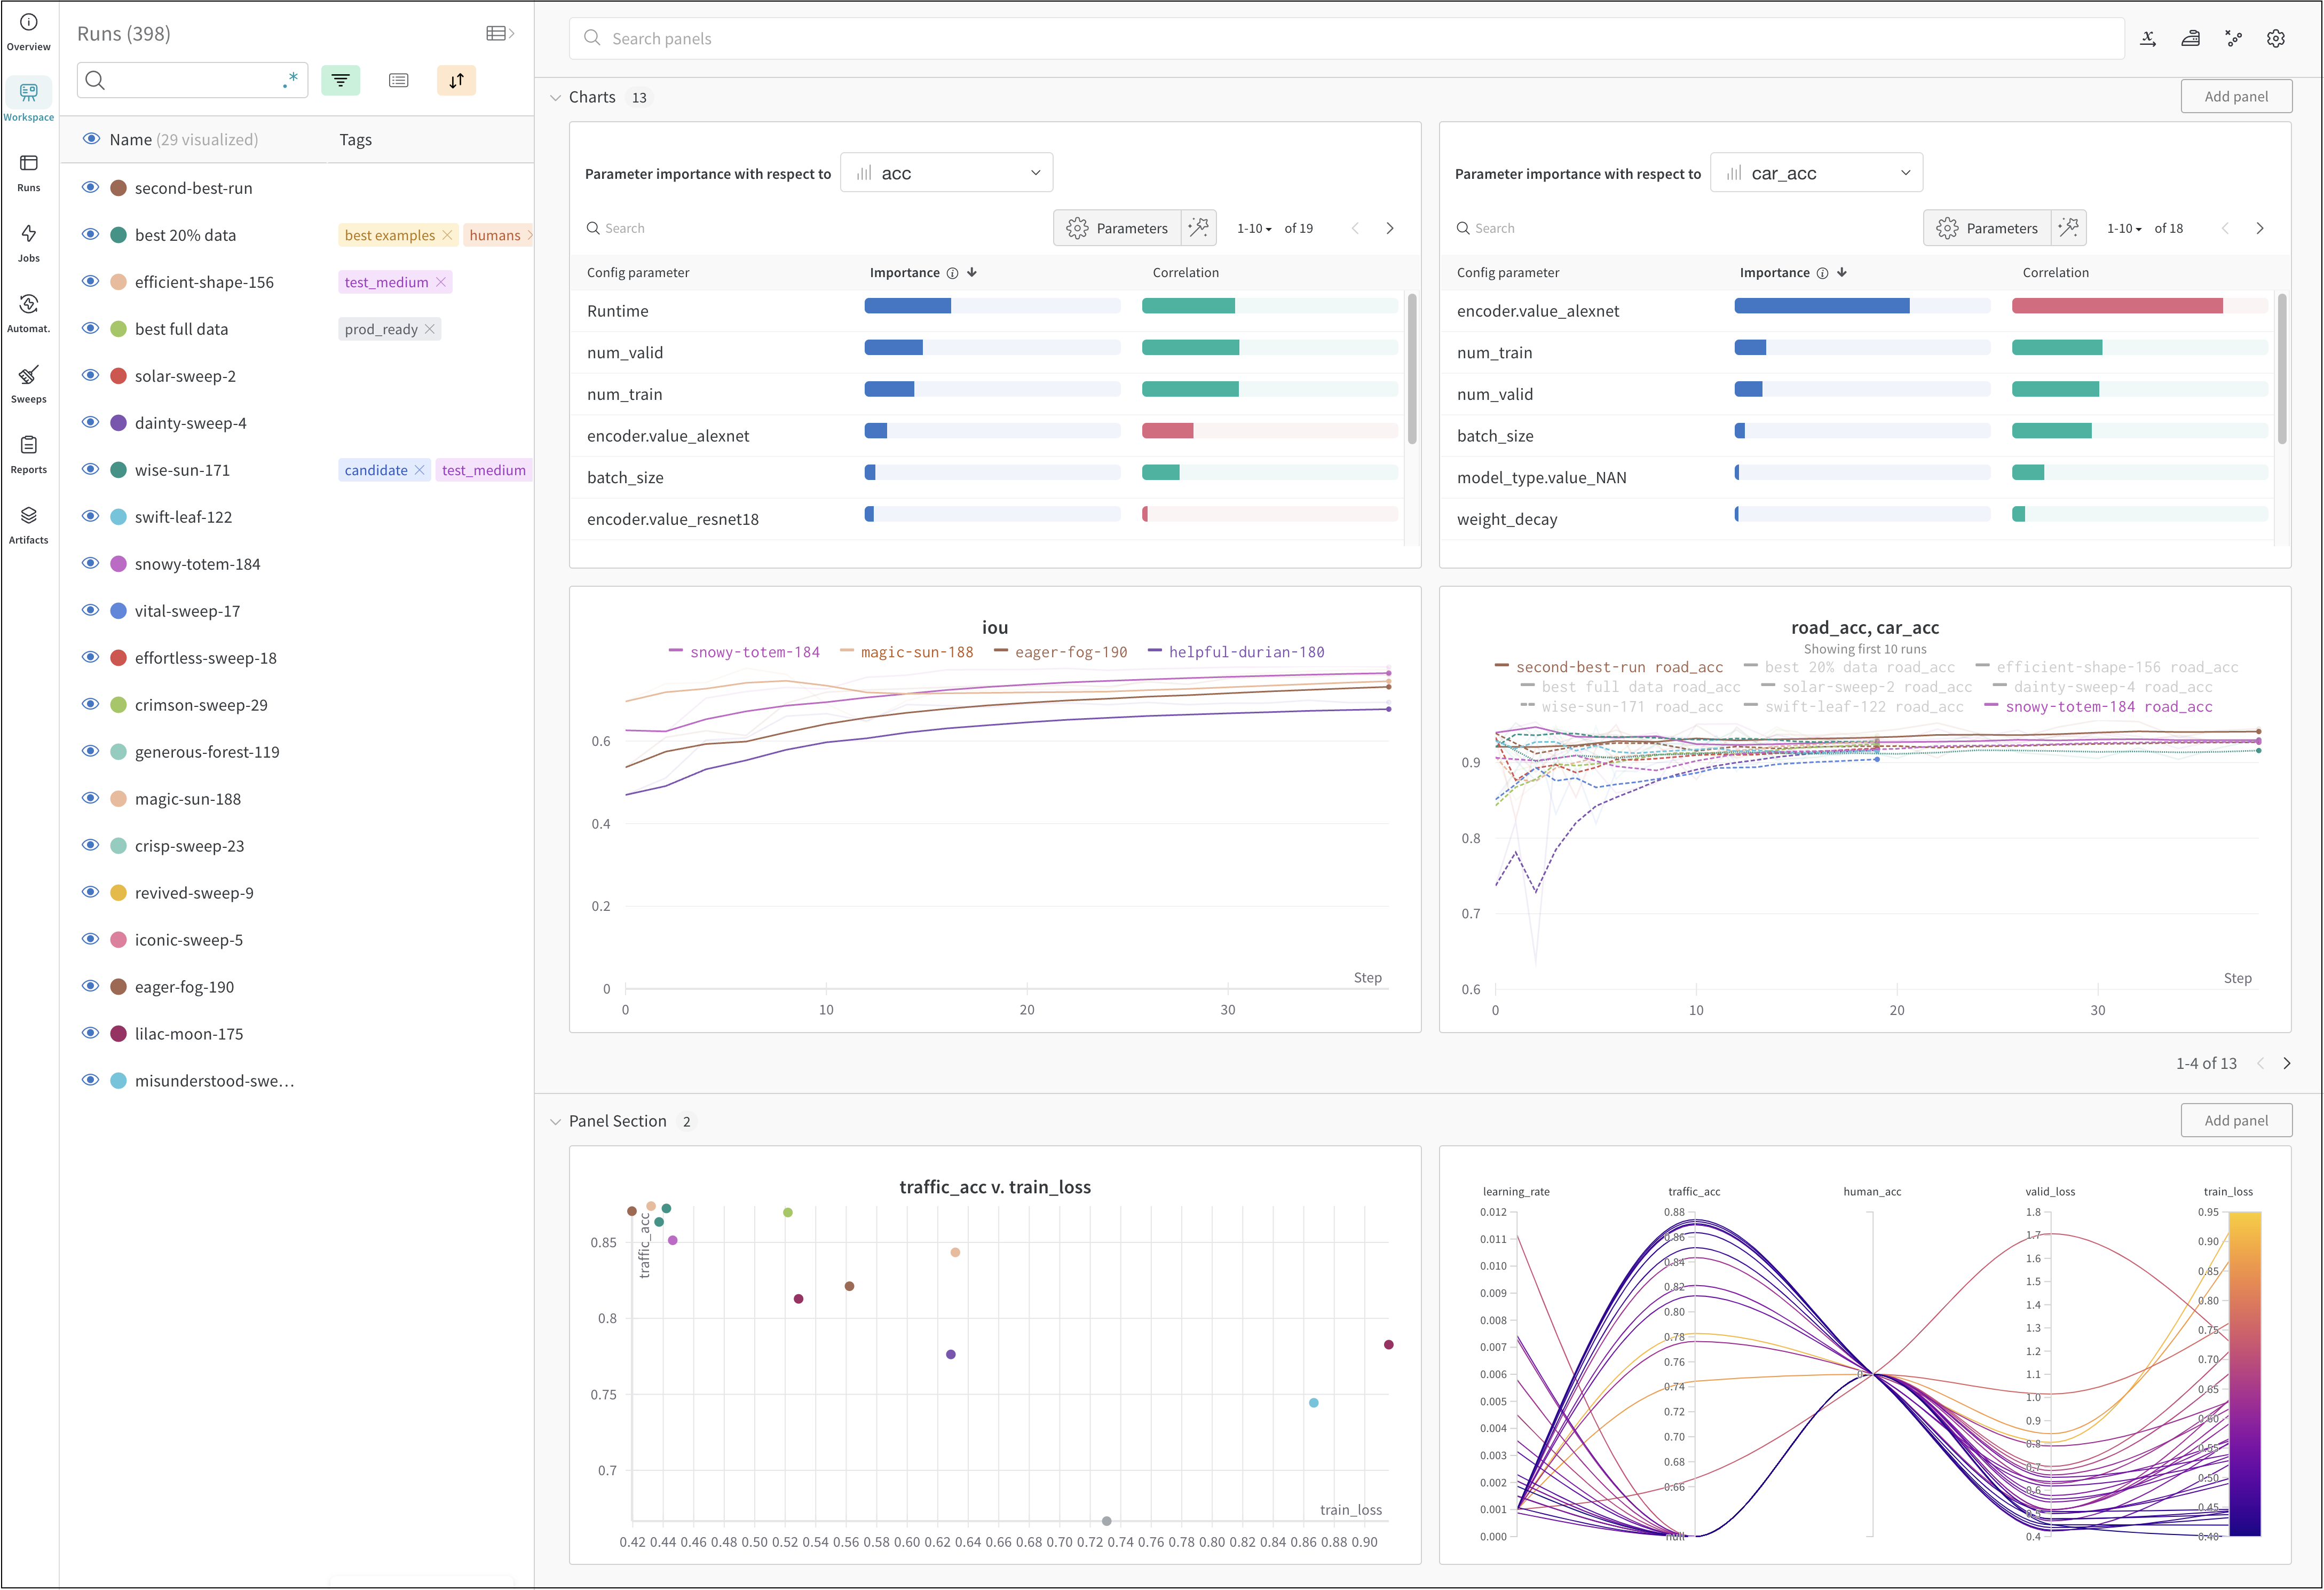
The image above shows an example dashboard where you can view and compare metrics across multiple [runs](/models/runs/).
## How it works
Track a machine learning experiment with a few lines of code:
1. Create a [W\&B Run](/models/runs/).
2. Store a dictionary of hyperparameters, such as learning rate or model type, into your configuration ([`wandb.Run.config`](/models/track/config/)).
3. Log metrics ([`wandb.Run.log()`](/models/track/log/)) over time in a training loop, such as accuracy and loss.
4. Save outputs of a run, like the model weights or a table of predictions.
The following code demonstrates a common W\&B experiment tracking workflow:
```python theme={null}
# Start a run.
#
# When this block exits, it waits for logged data to finish uploading.
# If an exception is raised, the run is marked failed.
with wandb.init(entity="", project="my-project-name") as run:
# Save mode inputs and hyperparameters.
run.config.learning_rate = 0.01
# Run your experiment code.
for epoch in range(num_epochs):
# Do some training...
# Log metrics over time to visualize model performance.
run.log({"loss": loss})
# Upload model outputs as artifacts.
run.log_artifact(model)
```
## Get started
Depending on your use case, explore the following resources to get started with W\&B Experiments:
* Read the [W\&B Quickstart](/models/quickstart/) for a step-by-step outline of the W\&B Python SDK commands you could use to create, track, and use a dataset artifact.
* Explore this chapter to learn how to:
* Create an experiment
* Configure experiments
* Log data from experiments
* View results from experiments
* Explore the [W\&B Python Library](/models/ref/python/) within the [W\&B API Reference Guide](/models/ref/python/).
## Best practices and tips
For best practices and tips for experiments and logging, see [Best Practices: Experiments and Logging](https://wandb.ai/wandb/pytorch-lightning-e2e/reports/W-B-Best-Practices-Guide--VmlldzozNTU1ODY1#w\&b-experiments-and-logging).
 The image above shows an example dashboard where you can view and compare metrics across multiple [runs](/models/runs/).
## How it works
Track a machine learning experiment with a few lines of code:
1. Create a [W\&B Run](/models/runs/).
2. Store a dictionary of hyperparameters, such as learning rate or model type, into your configuration ([`wandb.Run.config`](/models/track/config/)).
3. Log metrics ([`wandb.Run.log()`](/models/track/log/)) over time in a training loop, such as accuracy and loss.
4. Save outputs of a run, like the model weights or a table of predictions.
The following code demonstrates a common W\&B experiment tracking workflow:
```python theme={null}
# Start a run.
#
# When this block exits, it waits for logged data to finish uploading.
# If an exception is raised, the run is marked failed.
with wandb.init(entity="", project="my-project-name") as run:
# Save mode inputs and hyperparameters.
run.config.learning_rate = 0.01
# Run your experiment code.
for epoch in range(num_epochs):
# Do some training...
# Log metrics over time to visualize model performance.
run.log({"loss": loss})
# Upload model outputs as artifacts.
run.log_artifact(model)
```
## Get started
Depending on your use case, explore the following resources to get started with W\&B Experiments:
* Read the [W\&B Quickstart](/models/quickstart/) for a step-by-step outline of the W\&B Python SDK commands you could use to create, track, and use a dataset artifact.
* Explore this chapter to learn how to:
* Create an experiment
* Configure experiments
* Log data from experiments
* View results from experiments
* Explore the [W\&B Python Library](/models/ref/python/) within the [W\&B API Reference Guide](/models/ref/python/).
## Best practices and tips
For best practices and tips for experiments and logging, see [Best Practices: Experiments and Logging](https://wandb.ai/wandb/pytorch-lightning-e2e/reports/W-B-Best-Practices-Guide--VmlldzozNTU1ODY1#w\&b-experiments-and-logging).
The image above shows an example dashboard where you can view and compare metrics across multiple [runs](/models/runs/).
## How it works
Track a machine learning experiment with a few lines of code:
1. Create a [W\&B Run](/models/runs/).
2. Store a dictionary of hyperparameters, such as learning rate or model type, into your configuration ([`wandb.Run.config`](/models/track/config/)).
3. Log metrics ([`wandb.Run.log()`](/models/track/log/)) over time in a training loop, such as accuracy and loss.
4. Save outputs of a run, like the model weights or a table of predictions.
The following code demonstrates a common W\&B experiment tracking workflow:
```python theme={null}
# Start a run.
#
# When this block exits, it waits for logged data to finish uploading.
# If an exception is raised, the run is marked failed.
with wandb.init(entity="", project="my-project-name") as run:
# Save mode inputs and hyperparameters.
run.config.learning_rate = 0.01
# Run your experiment code.
for epoch in range(num_epochs):
# Do some training...
# Log metrics over time to visualize model performance.
run.log({"loss": loss})
# Upload model outputs as artifacts.
run.log_artifact(model)
```
## Get started
Depending on your use case, explore the following resources to get started with W\&B Experiments:
* Read the [W\&B Quickstart](/models/quickstart/) for a step-by-step outline of the W\&B Python SDK commands you could use to create, track, and use a dataset artifact.
* Explore this chapter to learn how to:
* Create an experiment
* Configure experiments
* Log data from experiments
* View results from experiments
* Explore the [W\&B Python Library](/models/ref/python/) within the [W\&B API Reference Guide](/models/ref/python/).
## Best practices and tips
For best practices and tips for experiments and logging, see [Best Practices: Experiments and Logging](https://wandb.ai/wandb/pytorch-lightning-e2e/reports/W-B-Best-Practices-Guide--VmlldzozNTU1ODY1#w\&b-experiments-and-logging).