> ## Documentation Index
> Fetch the complete documentation index at: https://docs.wandb.ai/llms.txt
> Use this file to discover all available pages before exploring further.
> Use W&B with Jupyter to get interactive visualizations without leaving your notebook.
# Track Jupyter notebooks
Use W\&B with Jupyter to get interactive visualizations without leaving your notebook. Combine custom analysis, experiments, and prototypes, all fully logged.
## Use cases for W\&B with Jupyter notebooks
1. **Iterative experimentation**: Run and re-run experiments, tweaking parameters, and have all the runs you do saved automatically to W\&B without having to take manual notes along the way.
2. **Code saving**: When reproducing a model, it's hard to know which cells in a notebook ran, and in which order. Turn on code saving on your [settings page](/platform/app/settings-page/) to save a record of cell execution for each experiment.
3. **Custom analysis**: Once runs are logged to W\&B, it's easy to get a dataframe from the API and do custom analysis, then log those results to W\&B to save and share in reports.
## Getting started in a notebook
Start your notebook with the following code to install W\&B and link your account:
```notebook theme={null}
!pip install wandb -qqq
import wandb
wandb.login()
```
Next, set up your experiment and save hyperparameters:
```python theme={null}
wandb.init(
project="jupyter-projo",
config={
"batch_size": 128,
"learning_rate": 0.01,
"dataset": "CIFAR-100",
},
)
```
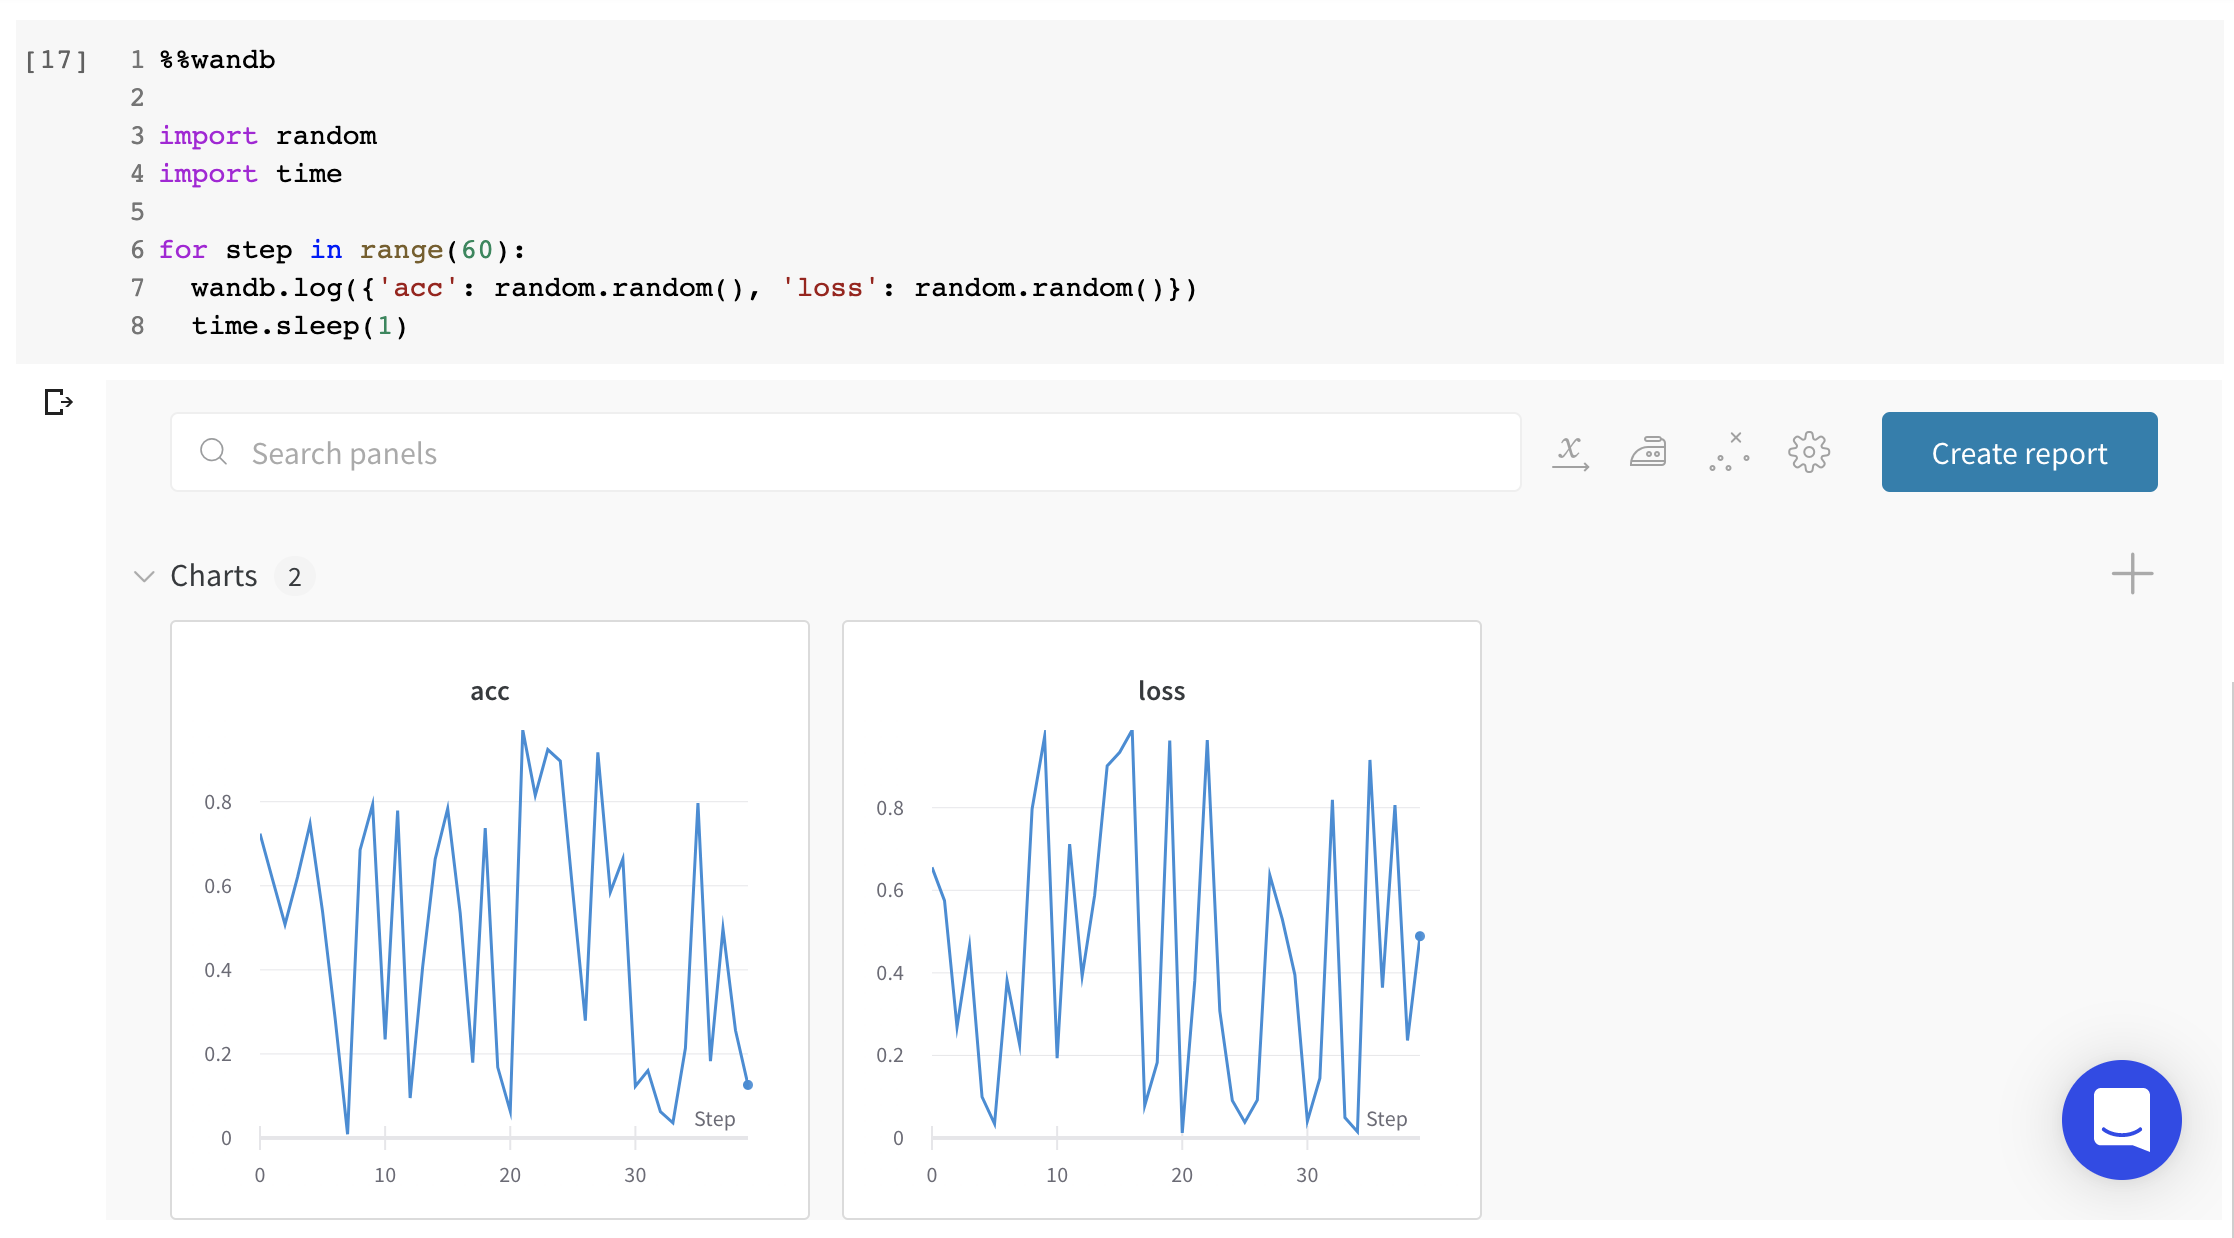
After running `wandb.init()` , start a new cell with `%%wandb` to see live graphs in the notebook. If you run this cell multiple times, data will be appended to the run.
```notebook theme={null}
%%wandb
# Your training loop here
```
Try it for yourself in this [example notebook](https://wandb.me/jupyter-interact-colab).
 ### Rendering live W\&B interfaces directly in your notebooks
You can also display any existing dashboards, sweeps, or reports directly in your notebook using the `%wandb` magic:
```notebook theme={null}
# Display a project workspace
%wandb USERNAME/PROJECT
# Display a single run
%wandb USERNAME/PROJECT/runs/RUN_ID
# Display a sweep
%wandb USERNAME/PROJECT/sweeps/SWEEP_ID
# Display a report
%wandb USERNAME/PROJECT/reports/REPORT_ID
# Specify the height of embedded iframe
%wandb USERNAME/PROJECT -h 2048
```
As an alternative to the `%%wandb` or `%wandb` magics, after running `wandb.init()` you can end any cell with `wandb.Run.finish()` to show in-line graphs, or call `ipython.display(...)` on any report, sweep, or run object returned from our apis.
```python theme={null}
import wandb
from IPython.display import display
# Initialize a run
run = wandb.init()
# If cell outputs run.finish(), you'll see live graphs
run.finish()
```
Want to know more about what you can do with W\&B? Check out our [guide to logging data and media](/models/track/log/), learn [how to integrate us with your favorite ML toolkits](/models/integrations), or just dive straight into the [reference docs](/models/ref/python/) or our [repo of examples](https://github.com/wandb/examples).
## Additional Jupyter features in W\&B
1. **Easy authentication in Colab**: When you call `wandb.init()` for the first time in a Colab, we automatically authenticate your runtime if you're currently logged in to W\&B in your browser. On the overview tab of your run page, you'll see a link to the Colab.
2. **Jupyter Magic:** Display dashboards, sweeps and reports directly in your notebooks. The `%wandb` magic accepts a path to your project, sweeps or reports and will render the W\&B interface directly in the notebook.
3. **Launch dockerized Jupyter**: Call `wandb docker --jupyter` to launch a docker container, mount your code in it, ensure Jupyter is installed, and launch on port 8888.
4. **Run cells in arbitrary order without fear**: By default, we wait until the next time `wandb.init()` is called to mark a run as `finished`. That allows you to run multiple cells (say, one to set up data, one to train, one to test) in whatever order you like and have them all log to the same run. If you turn on code saving in [User Settings](https://wandb.ai/settings), you'll also log the cells that were executed, in order and in the state in which they were run, enabling you to reproduce even the most non-linear of pipelines. To mark a run as complete manually in a Jupyter notebook, call `wandb.Run.finish()`.
```python theme={null}
import wandb
run = wandb.init()
# training script and logging goes here
run.finish()
```
### Rendering live W\&B interfaces directly in your notebooks
You can also display any existing dashboards, sweeps, or reports directly in your notebook using the `%wandb` magic:
```notebook theme={null}
# Display a project workspace
%wandb USERNAME/PROJECT
# Display a single run
%wandb USERNAME/PROJECT/runs/RUN_ID
# Display a sweep
%wandb USERNAME/PROJECT/sweeps/SWEEP_ID
# Display a report
%wandb USERNAME/PROJECT/reports/REPORT_ID
# Specify the height of embedded iframe
%wandb USERNAME/PROJECT -h 2048
```
As an alternative to the `%%wandb` or `%wandb` magics, after running `wandb.init()` you can end any cell with `wandb.Run.finish()` to show in-line graphs, or call `ipython.display(...)` on any report, sweep, or run object returned from our apis.
```python theme={null}
import wandb
from IPython.display import display
# Initialize a run
run = wandb.init()
# If cell outputs run.finish(), you'll see live graphs
run.finish()
```
Want to know more about what you can do with W\&B? Check out our [guide to logging data and media](/models/track/log/), learn [how to integrate us with your favorite ML toolkits](/models/integrations), or just dive straight into the [reference docs](/models/ref/python/) or our [repo of examples](https://github.com/wandb/examples).
## Additional Jupyter features in W\&B
1. **Easy authentication in Colab**: When you call `wandb.init()` for the first time in a Colab, we automatically authenticate your runtime if you're currently logged in to W\&B in your browser. On the overview tab of your run page, you'll see a link to the Colab.
2. **Jupyter Magic:** Display dashboards, sweeps and reports directly in your notebooks. The `%wandb` magic accepts a path to your project, sweeps or reports and will render the W\&B interface directly in the notebook.
3. **Launch dockerized Jupyter**: Call `wandb docker --jupyter` to launch a docker container, mount your code in it, ensure Jupyter is installed, and launch on port 8888.
4. **Run cells in arbitrary order without fear**: By default, we wait until the next time `wandb.init()` is called to mark a run as `finished`. That allows you to run multiple cells (say, one to set up data, one to train, one to test) in whatever order you like and have them all log to the same run. If you turn on code saving in [User Settings](https://wandb.ai/settings), you'll also log the cells that were executed, in order and in the state in which they were run, enabling you to reproduce even the most non-linear of pipelines. To mark a run as complete manually in a Jupyter notebook, call `wandb.Run.finish()`.
```python theme={null}
import wandb
run = wandb.init()
# training script and logging goes here
run.finish()
```