> ## Documentation Index
> Fetch the complete documentation index at: https://docs.wandb.ai/llms.txt
> Use this file to discover all available pages before exploring further.
# Customize log axes
> Use define_metric() to set a custom x-axis for logged metrics instead of the default W&B step counter.
Set a custom x-axis when you log metrics to W\&B. By default, W\&B logs metrics as *steps*. Each step corresponds to a `wandb.Run.log()` API call.
For example, the following script has a `for` loop that iterates 10 times. In each iteration, the script logs a metric called `validation_loss` and increments the step number by 1.
```python theme={null}
import wandb
with wandb.init() as run:
# range function creates a sequence of numbers from 0 to 9
for i in range(10):
log_dict = {
"validation_loss": 1/(i+1)
}
run.log(log_dict)
```
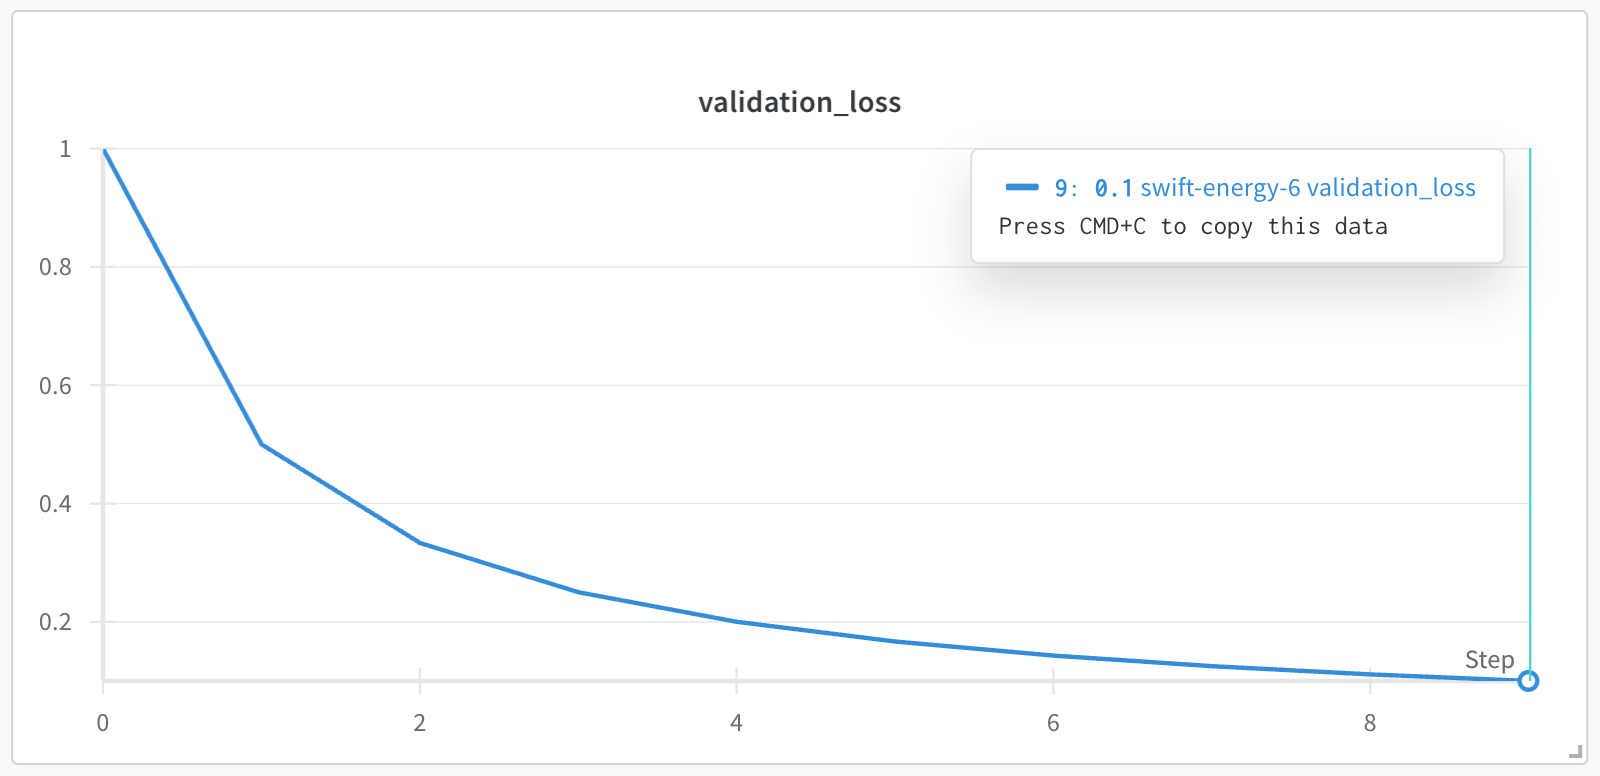
In the project's workspace, the `validation_loss` metric is plotted against the `step` x-axis, which increments by 1 each time `wandb.Run.log()` is called. From the previous code, the x-axis shows the step numbers 0, 1, 2, ..., 9.
 In certain situations, it makes more sense to log metrics against a different x-axis such as a logarithmic x-axis. Use the [`define_metric()`](/models/ref/python/experiments/run/#define_metric) method to use any metric you log as a custom x-axis.
Specify the metric that you want to appear as the y-axis with the `name` parameter. The `step_metric` parameter specifies the metric you want to use as the x-axis. When you log a custom metric, specify a value for both the x-axis and the y-axis as key-value pairs in a dictionary.
Copy and paste the following code snippet to set a custom x-axis metric. Replace the values within `<>` with your own values:
```python theme={null}
import wandb
custom_step = "" # Name of custom x-axis
metric_name = "" # Name of y-axis metric
with wandb.init() as run:
# Specify the step metric (x-axis) and the metric to log against it (y-axis)
run.define_metric(step_metric = custom_step, name = metric_name)
for i in range(10):
log_dict = {
custom_step : int, # Value of x-axis
metric_name : int, # Value of y-axis
}
run.log(log_dict)
```
As an example, the following code snippet creates a custom x-axis called `x_axis_squared`. The value of the custom x-axis is the square of the for loop index `i` (`i**2`). The y-axis consists of mock values for validation loss (`"validation_loss"`) using Python's built-in `random` module:
```python theme={null}
import wandb
import random
with wandb.init() as run:
run.define_metric(step_metric = "x_axis_squared", name = "validation_loss")
for i in range(10):
log_dict = {
"x_axis_squared": i**2,
"validation_loss": random.random(),
}
run.log(log_dict)
```
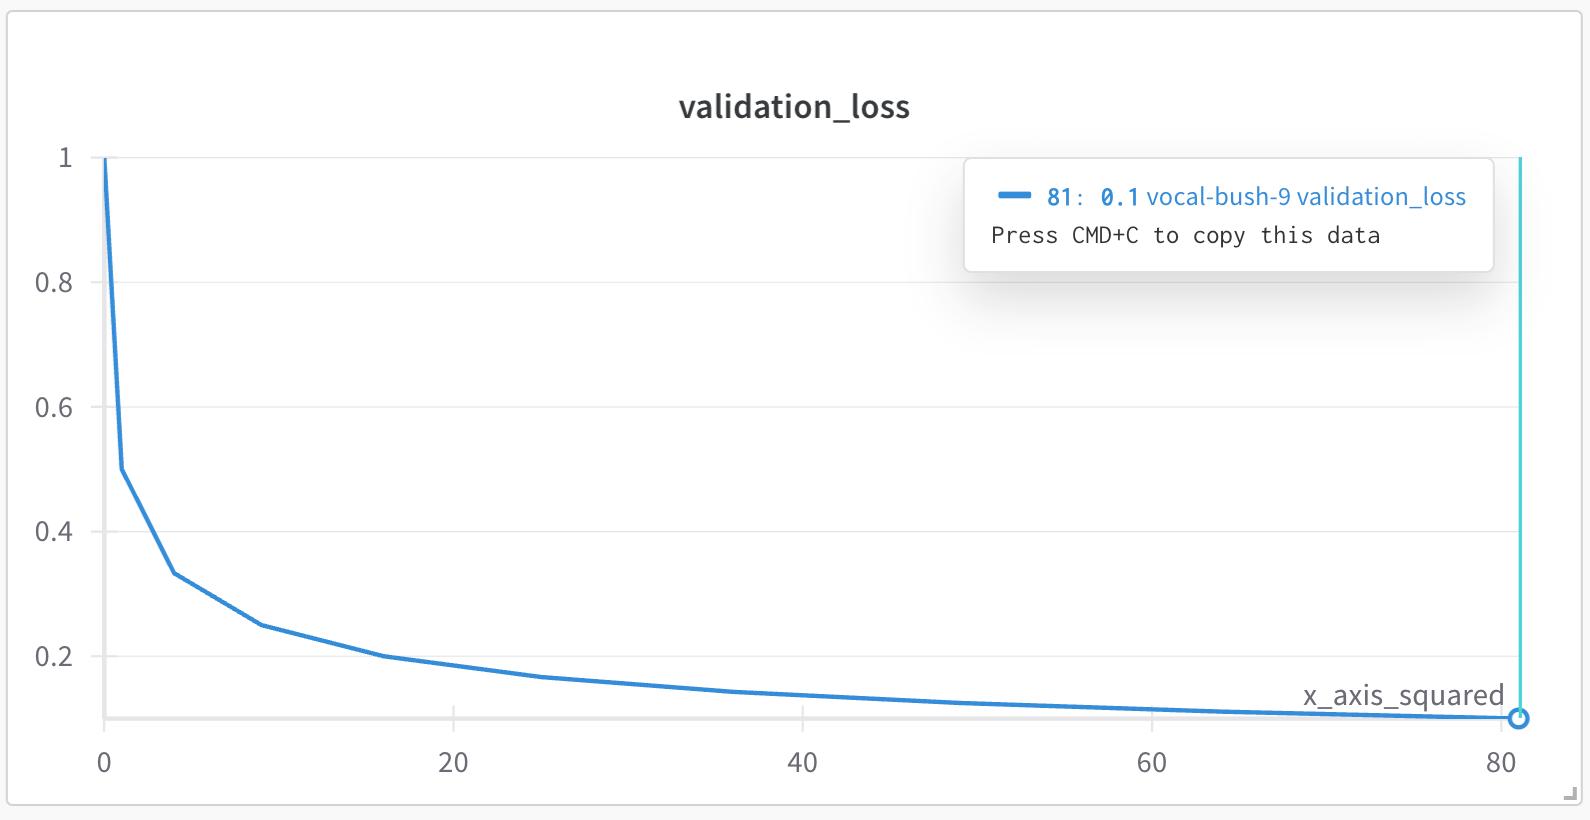
The following image shows the resulting plot in the W\&B App UI. The `validation_loss` metric is plotted against the custom x-axis `x_axis_squared`, which is the square of the for loop index `i`. Note that the x-axis values are `0, 1, 4, 9, 16, 25, 36, 49, 64, 81`, which correspond to the squares of `0, 1, 2, ..., 9` respectively.
In certain situations, it makes more sense to log metrics against a different x-axis such as a logarithmic x-axis. Use the [`define_metric()`](/models/ref/python/experiments/run/#define_metric) method to use any metric you log as a custom x-axis.
Specify the metric that you want to appear as the y-axis with the `name` parameter. The `step_metric` parameter specifies the metric you want to use as the x-axis. When you log a custom metric, specify a value for both the x-axis and the y-axis as key-value pairs in a dictionary.
Copy and paste the following code snippet to set a custom x-axis metric. Replace the values within `<>` with your own values:
```python theme={null}
import wandb
custom_step = "" # Name of custom x-axis
metric_name = "" # Name of y-axis metric
with wandb.init() as run:
# Specify the step metric (x-axis) and the metric to log against it (y-axis)
run.define_metric(step_metric = custom_step, name = metric_name)
for i in range(10):
log_dict = {
custom_step : int, # Value of x-axis
metric_name : int, # Value of y-axis
}
run.log(log_dict)
```
As an example, the following code snippet creates a custom x-axis called `x_axis_squared`. The value of the custom x-axis is the square of the for loop index `i` (`i**2`). The y-axis consists of mock values for validation loss (`"validation_loss"`) using Python's built-in `random` module:
```python theme={null}
import wandb
import random
with wandb.init() as run:
run.define_metric(step_metric = "x_axis_squared", name = "validation_loss")
for i in range(10):
log_dict = {
"x_axis_squared": i**2,
"validation_loss": random.random(),
}
run.log(log_dict)
```
The following image shows the resulting plot in the W\&B App UI. The `validation_loss` metric is plotted against the custom x-axis `x_axis_squared`, which is the square of the for loop index `i`. Note that the x-axis values are `0, 1, 4, 9, 16, 25, 36, 49, 64, 81`, which correspond to the squares of `0, 1, 2, ..., 9` respectively.
 You can set a custom x-axis for multiple metrics using `globs` with string prefixes. As an example, the following code snippet plots logged metrics with the prefix `train/*` to the x-axis `train/step`:
```python theme={null}
import wandb
with wandb.init() as run:
# set all other train/ metrics to use this step
run.define_metric("train/*", step_metric="train/step")
for i in range(10):
log_dict = {
"train/step": 2**i, # exponential growth w/ internal W&B step
"train/loss": 1 / (i + 1), # x-axis is train/step
"train/accuracy": 1 - (1 / (1 + i)), # x-axis is train/step
"val/loss": 1 / (1 + i), # x-axis is internal wandb step
}
run.log(log_dict)
```
You can set a custom x-axis for multiple metrics using `globs` with string prefixes. As an example, the following code snippet plots logged metrics with the prefix `train/*` to the x-axis `train/step`:
```python theme={null}
import wandb
with wandb.init() as run:
# set all other train/ metrics to use this step
run.define_metric("train/*", step_metric="train/step")
for i in range(10):
log_dict = {
"train/step": 2**i, # exponential growth w/ internal W&B step
"train/loss": 1 / (i + 1), # x-axis is train/step
"train/accuracy": 1 - (1 / (1 + i)), # x-axis is train/step
"val/loss": 1 / (1 + i), # x-axis is internal wandb step
}
run.log(log_dict)
```