> ## Documentation Index
> Fetch the complete documentation index at: https://docs.wandb.ai/llms.txt
> Use this file to discover all available pages before exploring further.
> Use W&B to log distributed training experiments with multiple GPUs.
# Log distributed training experiments
During a distributed training experiment, you train a model using multiple machines or clients in parallel. W\&B can help you track distributed training experiments. Based on your use case, track distributed training experiments using one of the following approaches:
* **Track a single process**: Track a rank 0 process (also known as a "leader" or "coordinator") with W\&B. This is a common solution for logging distributed training experiments with the [PyTorch Distributed Data Parallel](https://pytorch.org/docs/stable/generated/torch.nn.parallel.DistributedDataParallel.html#torch.nn.parallel.DistributedDataParallel) (DDP) Class.
* **Track multiple processes**: For multiple processes, you can either:
* Track each process separately using one run per process. You can optionally group them together in the W\&B App UI.
* Track all processes to a single run.
**Concurrent connections**
Each concurrent connection takes compute, memory, and network resources. Even empty client connections that don't log metrics regularly push system metric updates, leading to slower performance when loading charts.
W\&B recommends that you limit the maximum number of concurrent client connections as appropriate for your workload and that you monitor resource usage over time. W\&B has tested with a hard limit of 300 concurrent client connections in **Dedicated Cloud**.
In **Multi-tenant Cloud** organizations, client connections for distributed training are subject to the same [rate limits](/models/track/limits#rate-limits) as regular training runs. Users on [Teams and Enterprise plans](https://wandb.ai/site/pricing) receive higher rate limits than those on the Free plan.
## Track a single process
This section describes how to track values and metrics available to your rank 0 process. Use this approach to track only metrics that are available from a single process. Typical metrics include GPU/CPU utilization, behavior on a shared validation set, gradients and parameters, and loss values on representative data examples.
Within the rank 0 process, initialize a W\&B run with [`wandb.init()`](/models/ref/python/functions/init) and log experiments ([`wandb.Run.log()`](/models/ref/python/experiments/run/#method-runlog)) to that run.
The following [sample Python script (`log-ddp.py`)](https://github.com/wandb/examples/blob/master/examples/pytorch/pytorch-ddp/log-ddp.py) demonstrates one way to track metrics on two GPUs on a single machine using PyTorch DDP. [PyTorch DDP](https://pytorch.org/tutorials/intermediate/ddp_tutorial.html) (`DistributedDataParallel` in`torch.nn`) is a popular library for distributed training. The basic principles apply to any distributed training setup, but the implementation may differ.
The Python script:
1. Starts multiple processes with `torch.distributed.launch`.
2. Checks the rank with the `--local_rank` command line argument.
3. If the rank is set to 0, sets up `wandb` logging conditionally in the [`train()`](https://github.com/wandb/examples/blob/master/examples/pytorch/pytorch-ddp/log-ddp.py#L24) function.
```python theme={null}
if __name__ == "__main__":
# Get args
args = parse_args()
if args.local_rank == 0: # only on main process
# Initialize wandb run
run = wandb.init(
entity=args.entity,
project=args.project,
)
# Train model with DDP
train(args, run)
else:
train(args)
```
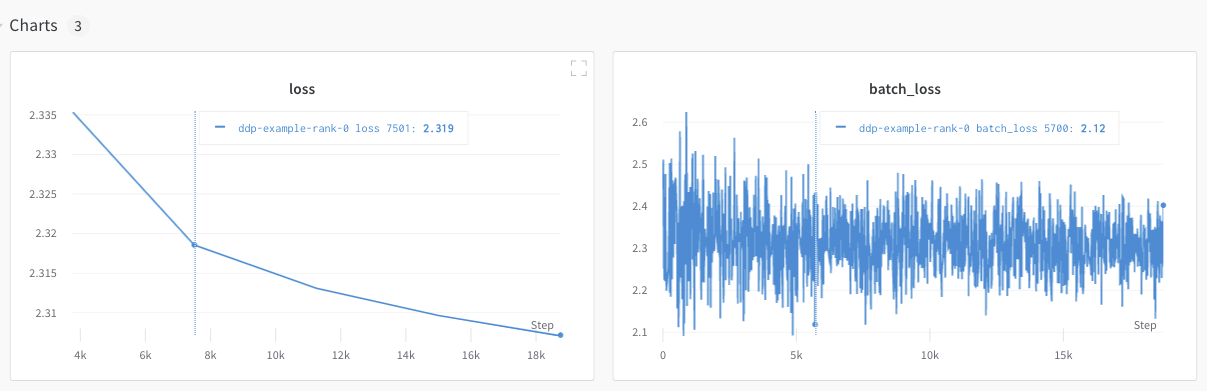
Explore an [example dashboard showing metrics tracked from a single process](https://wandb.ai/ayush-thakur/DDP/runs/1s56u3hc/system).
The dashboard displays system metrics for both GPUs, such as temperature and utilization.
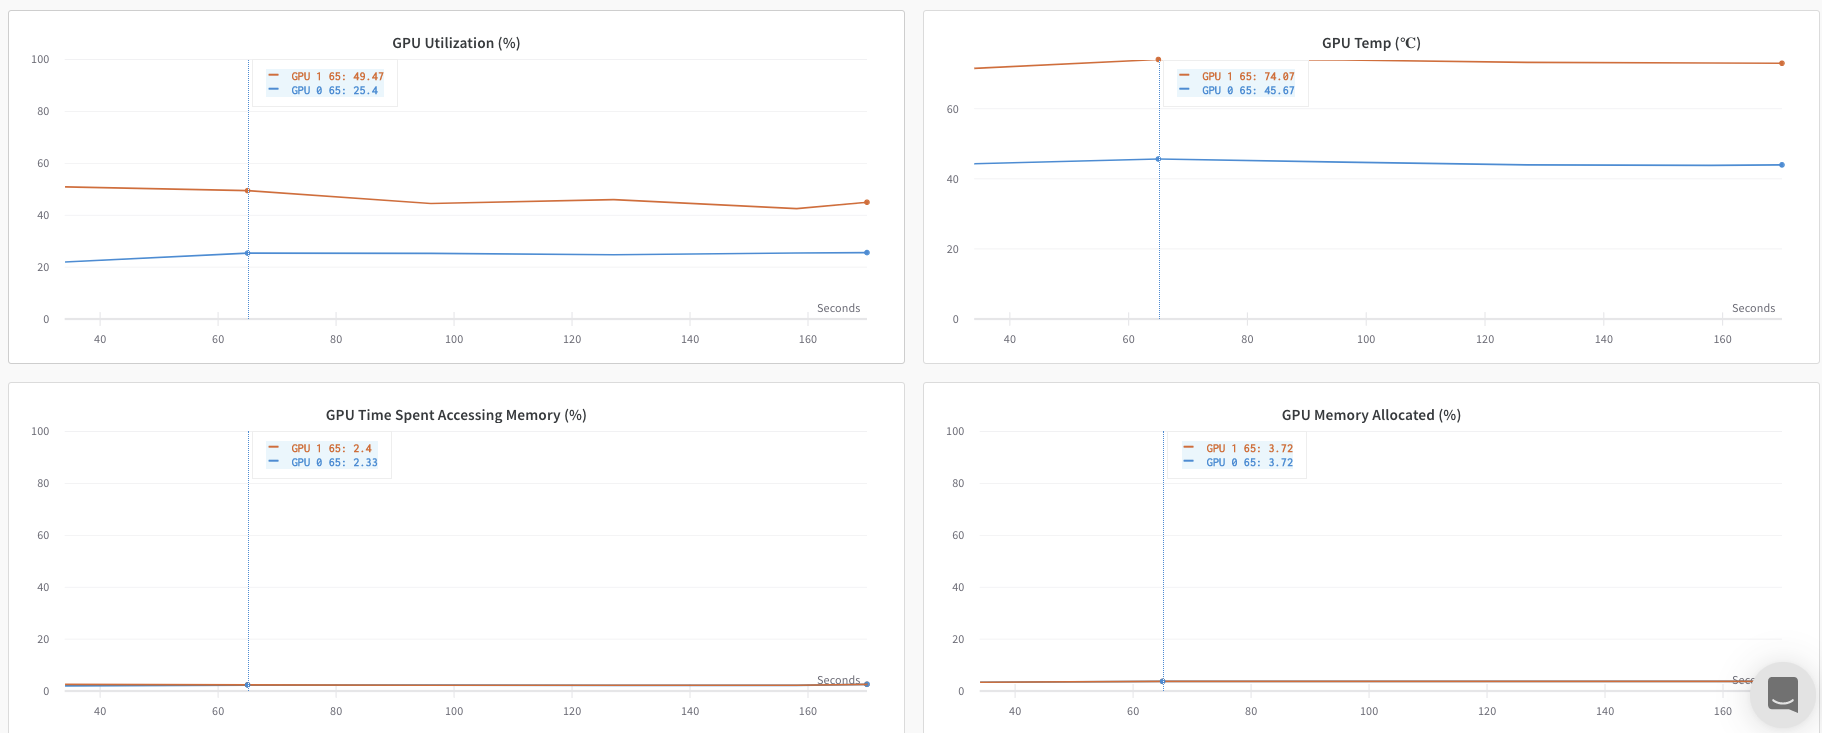 However, the loss values as a function epoch and batch size were only logged from a single GPU.
 ## Track multiple processes
Track multiple processes with W\&B with one of the following approaches:
* [Tracking each process separately](/models/track/log/distributed-training/#track-each-process-separately) by creating a run for each process.
* [Tracking all processes to a single run](/models/track/log/distributed-training/#track-all-processes-to-a-single-run).
### Track each process separately
This section describes how to track each process separately by creating a run for each process. Within each run you log metrics, artifacts, and forth to their respective run. Call `wandb.Run.finish()` at the end of training, to mark that the run has completed so that all processes exit properly.
You might find it difficult to keep track of runs across multiple experiments. To mitigate this, provide a value to the `group` parameter when you initialize W\&B (`wandb.init(group='group-name')`) to keep track of which run belongs to a given experiment. For more information about how to keep track of training and evaluation W\&B Runs in experiments, see [Group Runs](/models/runs/grouping/).
**Use this approach if you want to track metrics from individual processes**. Typical examples include the data and predictions on each node (for debugging data distribution) and metrics on individual batches outside of the main node. This approach is not necessary to get system metrics from all nodes nor to get summary statistics available on the main node.
The following Python code snippet demonstrates how to set the group parameter when you initialize W\&B:
```python theme={null}
if __name__ == "__main__":
# Get args
args = parse_args()
# Initialize run
run = wandb.init(
entity=args.entity,
project=args.project,
group="DDP", # all runs for the experiment in one group
)
# Train model with DDP
train(args, run)
run.finish() # mark the run as finished
```
Explore the W\&B App UI to view an [example dashboard](https://wandb.ai/ayush-thakur/DDP?workspace=user-noahluna) of metrics tracked from multiple processes. Note that there are two W\&B Runs grouped together in the left sidebar. Click on a group to view the dedicated group page for the experiment. The dedicated group page displays metrics from each process separately.
## Track multiple processes
Track multiple processes with W\&B with one of the following approaches:
* [Tracking each process separately](/models/track/log/distributed-training/#track-each-process-separately) by creating a run for each process.
* [Tracking all processes to a single run](/models/track/log/distributed-training/#track-all-processes-to-a-single-run).
### Track each process separately
This section describes how to track each process separately by creating a run for each process. Within each run you log metrics, artifacts, and forth to their respective run. Call `wandb.Run.finish()` at the end of training, to mark that the run has completed so that all processes exit properly.
You might find it difficult to keep track of runs across multiple experiments. To mitigate this, provide a value to the `group` parameter when you initialize W\&B (`wandb.init(group='group-name')`) to keep track of which run belongs to a given experiment. For more information about how to keep track of training and evaluation W\&B Runs in experiments, see [Group Runs](/models/runs/grouping/).
**Use this approach if you want to track metrics from individual processes**. Typical examples include the data and predictions on each node (for debugging data distribution) and metrics on individual batches outside of the main node. This approach is not necessary to get system metrics from all nodes nor to get summary statistics available on the main node.
The following Python code snippet demonstrates how to set the group parameter when you initialize W\&B:
```python theme={null}
if __name__ == "__main__":
# Get args
args = parse_args()
# Initialize run
run = wandb.init(
entity=args.entity,
project=args.project,
group="DDP", # all runs for the experiment in one group
)
# Train model with DDP
train(args, run)
run.finish() # mark the run as finished
```
Explore the W\&B App UI to view an [example dashboard](https://wandb.ai/ayush-thakur/DDP?workspace=user-noahluna) of metrics tracked from multiple processes. Note that there are two W\&B Runs grouped together in the left sidebar. Click on a group to view the dedicated group page for the experiment. The dedicated group page displays metrics from each process separately.
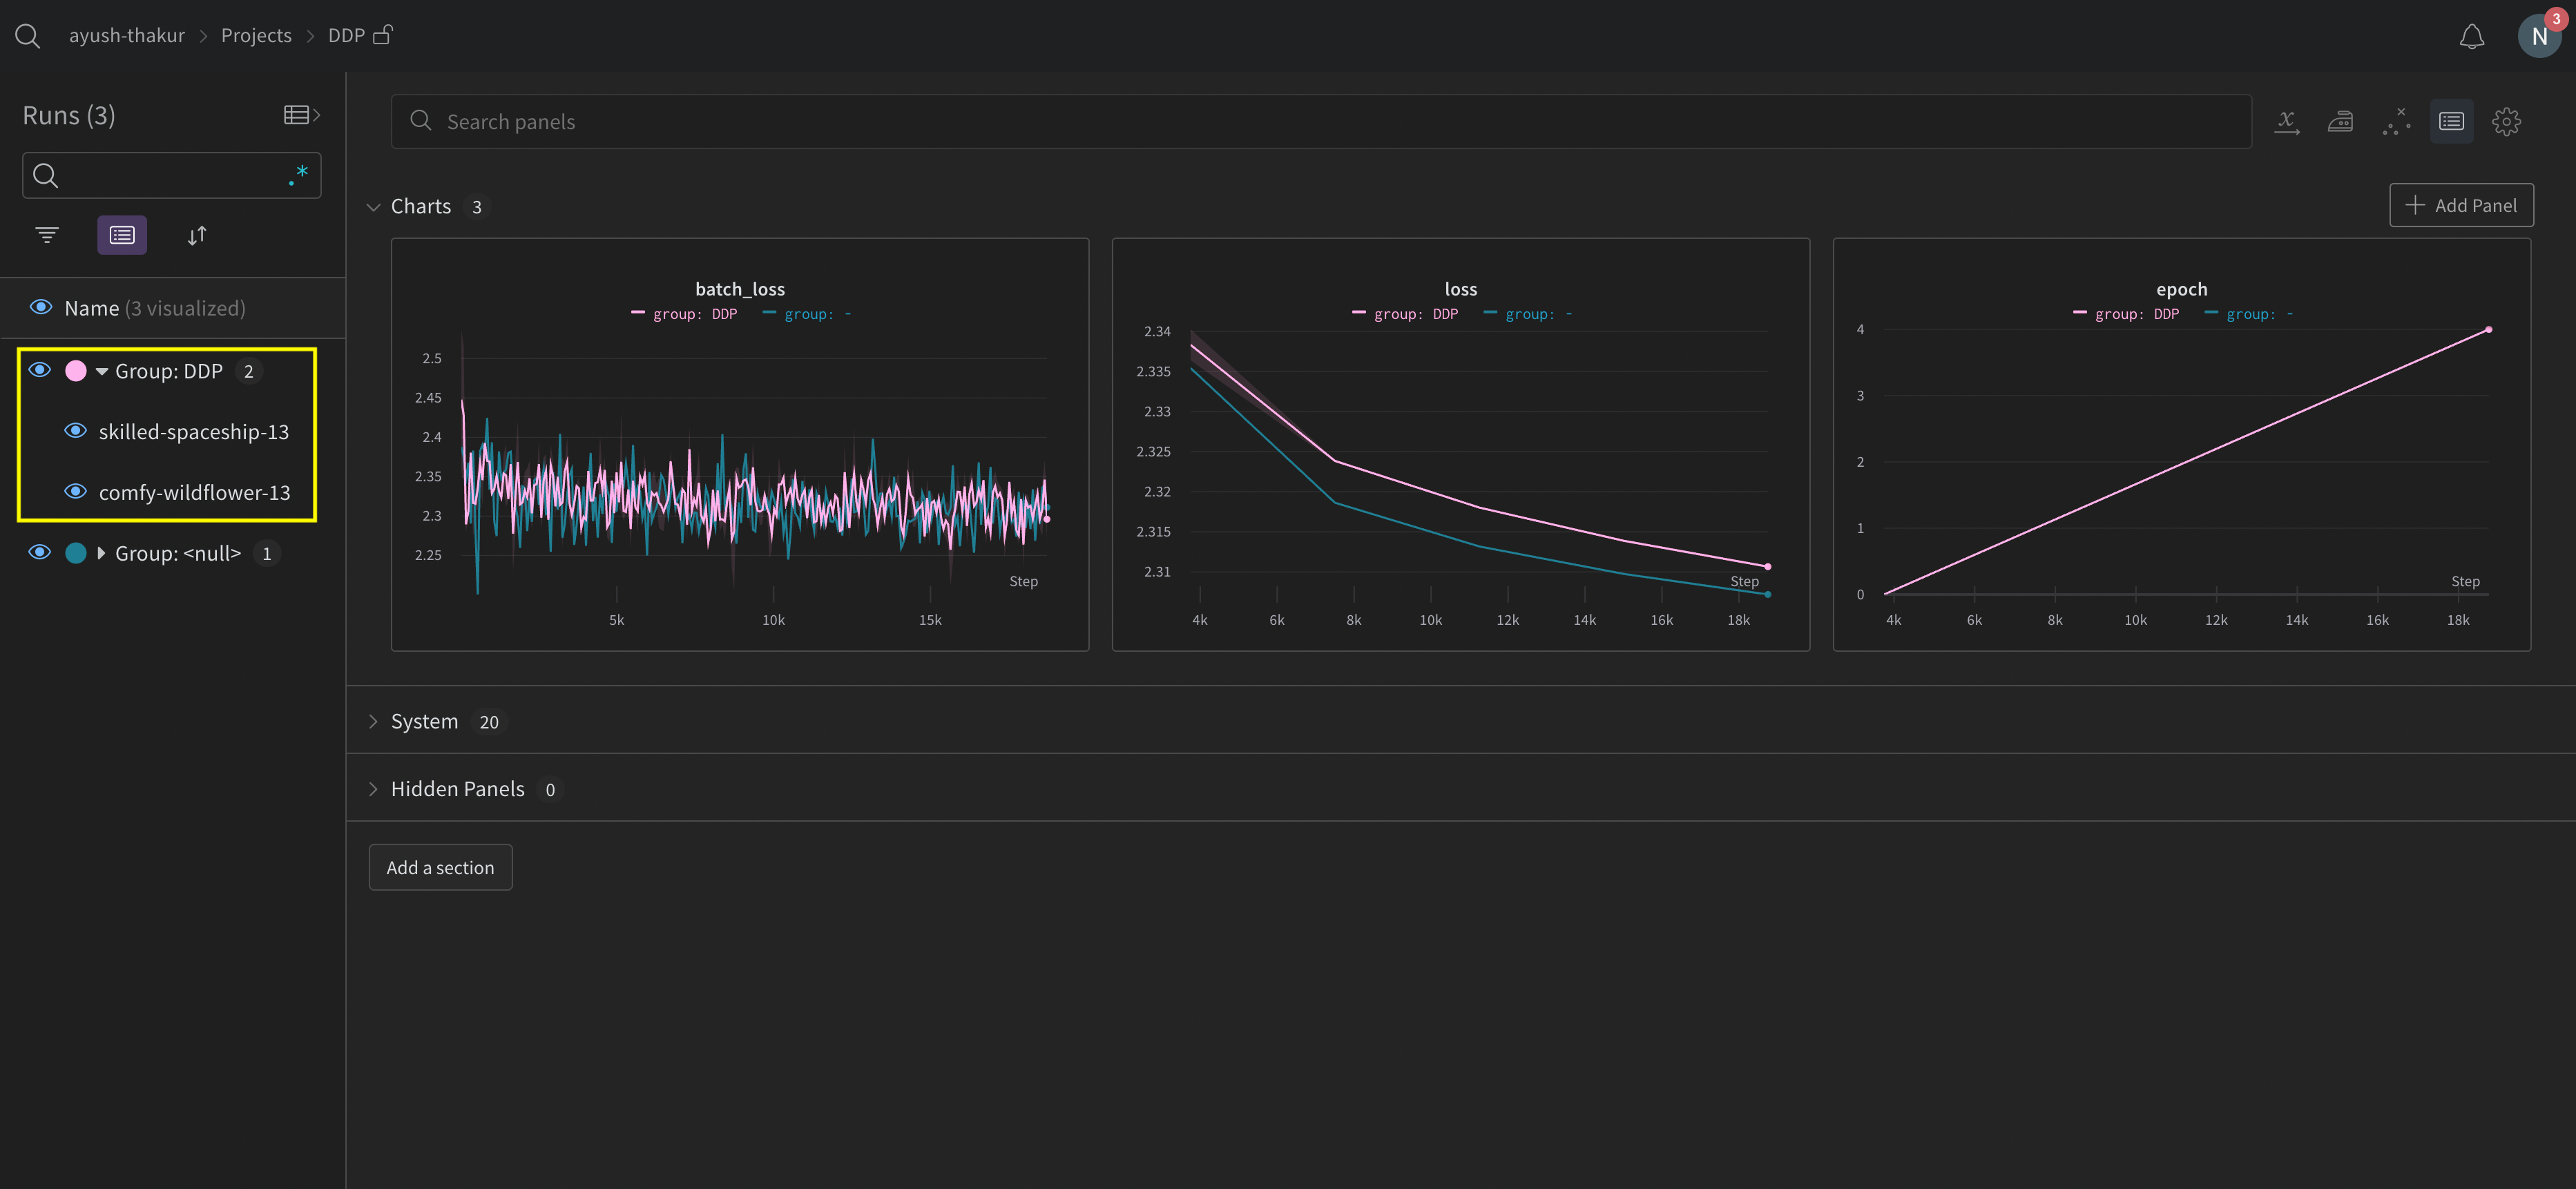 The preceding image demonstrates the W\&B App UI dashboard. On the sidebar we see two experiments. One labeled 'null' and a second (bound by a yellow box) called 'DPP'. If you expand the group (select the Group dropdown) you will see the W\&B Runs that are associated to that experiment.
### Organize distributed runs
Set the `job_type` parameter when you initialize W\&B (`wandb.init(job_type='type-name')`) to categorize your nodes based on their function. For example, you might have a main coordinating node and several reporting worker nodes. You can set `job_type` to `main` for the main coordinating node and `worker` for the reporting worker nodes:
```python theme={null}
# Main coordinating node
with wandb.init(project="", job_type="main", group="experiment_1") as run:
# Training code
# Reporting worker nodes
with wandb.init(project="", job_type="worker", group="experiment_1") as run:
# Training code
```
Once you have set the `job_type` for your nodes, you can create [saved views](/models/track/workspaces/#create-a-new-saved-workspace-view) in your workspace to organize your runs. Click the **action ()** menu at the top right and click **Save as new view**.
For example, you could create the following saved views:
* **Default view**: Filter out worker nodes to reduce noise
* Click **Filter**, then set **Job Type** to `worker`.
* Shows only your reporting nodes
* **Debug view**: Focus on worker nodes for troubleshooting
* Click **Filter**, then set **Job Type** `==` `worker` and set **State** to `IN` `crashed`.
* Shows only worker nodes that have crashed or are in error states
* **All nodes view**: See everything together
* No filter
* Useful for comprehensive monitoring
To open a saved view, click **Workspaces** in the project sidebar, then click the menu. Workspaces appear at the top of the list and saved views appear at the bottom.
### Track all processes to a single run
Parameters prefixed by `x_` (such as `x_label`) are in public preview. Create a [GitHub issue in the W\&B repository](https://github.com/wandb/wandb) to provide feedback.
**Requirements**
To track multiple processes to a single run, you must have:
* W\&B Python SDK version `v0.19.9` or newer.
* W\&B Server v0.68 or newer.
In this approach you use a primary node and one or more worker nodes. Within the primary node you initialize a W\&B run. For each worker node, initialize a run using the run ID used by the primary node. During training each worker node logs to the same run ID as the primary node. W\&B aggregates metrics from all nodes and displays them in the W\&B App UI.
Within the primary node, initialize a W\&B run with [`wandb.init()`](/models/ref/python/functions/init). Pass in a `wandb.Settings` object to the `settings` parameter (`wandb.init(settings=wandb.Settings()`) with the following:
1. The `mode` parameter set to `"shared"` to enable shared mode.
2. A unique label for [`x_label`](https://github.com/wandb/wandb/blob/main/wandb/sdk/wandb_settings.py#L638). You use the value you specify for `x_label` to identify which node the data is coming from in logs and system metrics in the W\&B App UI. If left unspecified, W\&B creates a label for you using the hostname and a random hash.
3. Set the [`x_primary`](https://github.com/wandb/wandb/blob/main/wandb/sdk/wandb_settings.py#L660) parameter to `True` to indicate that this is the primary node.
4. Optionally provide a list of GPU indexes (\[0,1,2]) to `x_stats_gpu_device_ids` to specify which GPUs W\&B tracks metrics for. If you do not provide a list, W\&B tracks metrics for all GPUs on the machine.
Make note of the run ID of the primary node. Each worker node needs the run ID of the primary node.
`x_primary=True` distinguishes a primary node from worker nodes. Primary nodes are the only nodes that upload files shared across nodes such as configuration files, telemetry and more. Worker nodes do not upload these files.
For each worker node, initialize a W\&B run with [`wandb.init()`](/models/ref/python/functions/init) and provide the following:
1. A `wandb.Settings` object to the `settings` parameter (`wandb.init(settings=wandb.Settings()`) with:
* The `mode` parameter set to `"shared"` to enable shared mode.
* A unique label for `x_label`. You use the value you specify for `x_label` to identify which node the data is coming from in logs and system metrics in the W\&B App UI. If left unspecified, W\&B creates a label for you using the hostname and a random hash.
* Set the `x_primary` parameter to `False` to indicate that this is a worker node.
2. Pass the run ID used by the primary node to the `id` parameter.
3. Optionally set [`x_update_finish_state`](https://github.com/wandb/wandb/blob/main/wandb/sdk/wandb_settings.py#L772) to `False`. This prevents non-primary nodes from updating the [run's state](/models/runs/run-states#run-states) to `finished` prematurely, ensuring the run state remains consistent and managed by the primary node.
* Use the same entity and project for all nodes. This helps ensure the correct run ID is found.
* Consider defining an environment variable on each worker node to set the run ID of the primary node.
The following sample code demonstrates the high level requirements for tracking multiple processes to a single run:
```python theme={null}
import wandb
entity = ""
project = ""
# Initialize a run in the primary node
run = wandb.init(
entity=entity,
project=project,
settings=wandb.Settings(
x_label="rank_0",
mode="shared",
x_primary=True,
x_stats_gpu_device_ids=[0, 1], # (Optional) Only track metrics for GPU 0 and 1
)
)
# Note the run ID of the primary node.
# Each worker node needs this run ID.
run_id = run.id
# Initialize a run in a worker node using the run ID of the primary node
run = wandb.init(
entity=entity, # Use the same entity as the primary node
project=project, # Use the same project as the primary node
settings=wandb.Settings(x_label="rank_1", mode="shared", x_primary=False),
id=run_id,
)
# Initialize a run in a worker node using the run ID of the primary node
run = wandb.init(
entity=entity, # Use the same entity as the primary node
project=project, # Use the same project as the primary node
settings=wandb.Settings(x_label="rank_2", mode="shared", x_primary=False),
id=run_id,
)
```
In a real world example, each worker node might be on a separate machine.
See the [Distributed Training with Shared Mode](https://wandb.ai/dimaduev/simple-cnn-ddp/reports/Distributed-Training-with-Shared-Mode--VmlldzoxMTI0NTE1NA) report for an end-to-end example on how to train a model on a multi-node and multi-GPU Kubernetes cluster in GKE.
View console logs from multi node processes in the project that the run logs to:
1. Navigate to the project that contains the run.
2. Click on the **Runs** tab in the project sidebar.
3. Click on the run you want to view.
4. Click on the **Logs** tab in the project sidebar.
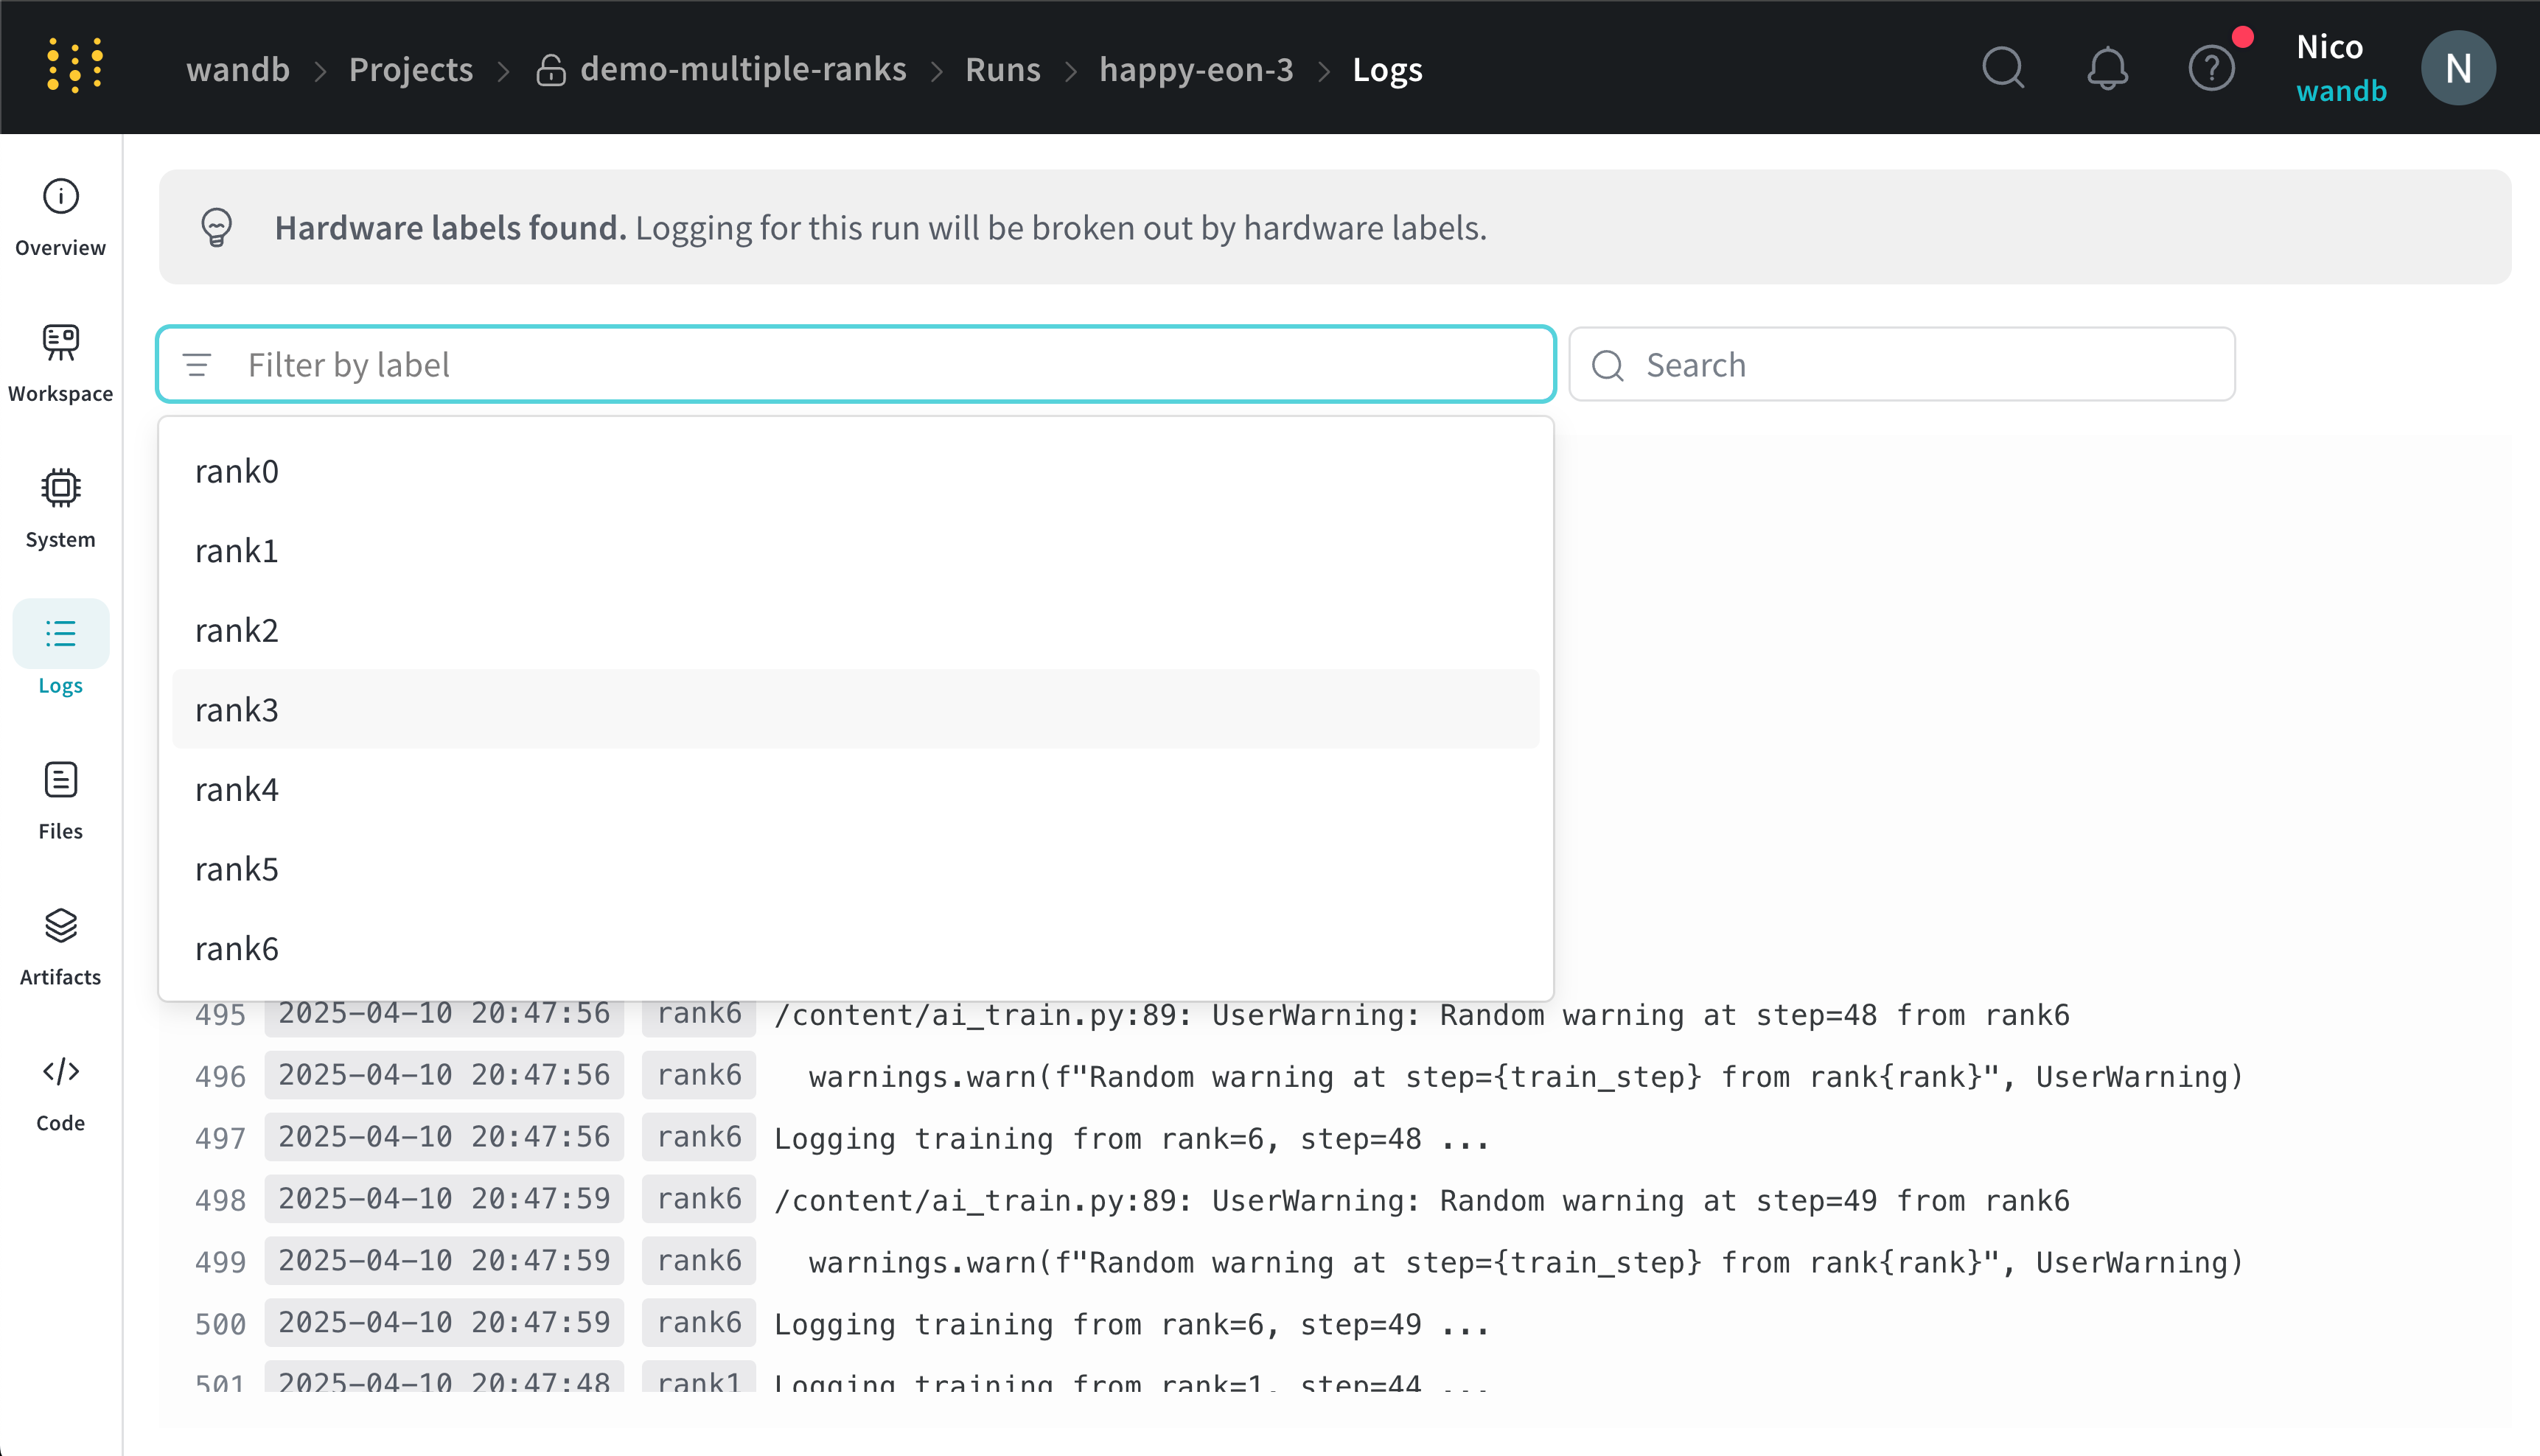
You can filter console logs based on the labels you provide for `x_label` in the UI search bar located at the top of the console log page. For example, the following image shows which options are available to filter the console log by if values `rank0`, `rank1`, `rank2`, `rank3`, `rank4`, `rank5`, and `rank6` are provided to `x_label`.\`
The preceding image demonstrates the W\&B App UI dashboard. On the sidebar we see two experiments. One labeled 'null' and a second (bound by a yellow box) called 'DPP'. If you expand the group (select the Group dropdown) you will see the W\&B Runs that are associated to that experiment.
### Organize distributed runs
Set the `job_type` parameter when you initialize W\&B (`wandb.init(job_type='type-name')`) to categorize your nodes based on their function. For example, you might have a main coordinating node and several reporting worker nodes. You can set `job_type` to `main` for the main coordinating node and `worker` for the reporting worker nodes:
```python theme={null}
# Main coordinating node
with wandb.init(project="", job_type="main", group="experiment_1") as run:
# Training code
# Reporting worker nodes
with wandb.init(project="", job_type="worker", group="experiment_1") as run:
# Training code
```
Once you have set the `job_type` for your nodes, you can create [saved views](/models/track/workspaces/#create-a-new-saved-workspace-view) in your workspace to organize your runs. Click the **action ()** menu at the top right and click **Save as new view**.
For example, you could create the following saved views:
* **Default view**: Filter out worker nodes to reduce noise
* Click **Filter**, then set **Job Type** to `worker`.
* Shows only your reporting nodes
* **Debug view**: Focus on worker nodes for troubleshooting
* Click **Filter**, then set **Job Type** `==` `worker` and set **State** to `IN` `crashed`.
* Shows only worker nodes that have crashed or are in error states
* **All nodes view**: See everything together
* No filter
* Useful for comprehensive monitoring
To open a saved view, click **Workspaces** in the project sidebar, then click the menu. Workspaces appear at the top of the list and saved views appear at the bottom.
### Track all processes to a single run
Parameters prefixed by `x_` (such as `x_label`) are in public preview. Create a [GitHub issue in the W\&B repository](https://github.com/wandb/wandb) to provide feedback.
**Requirements**
To track multiple processes to a single run, you must have:
* W\&B Python SDK version `v0.19.9` or newer.
* W\&B Server v0.68 or newer.
In this approach you use a primary node and one or more worker nodes. Within the primary node you initialize a W\&B run. For each worker node, initialize a run using the run ID used by the primary node. During training each worker node logs to the same run ID as the primary node. W\&B aggregates metrics from all nodes and displays them in the W\&B App UI.
Within the primary node, initialize a W\&B run with [`wandb.init()`](/models/ref/python/functions/init). Pass in a `wandb.Settings` object to the `settings` parameter (`wandb.init(settings=wandb.Settings()`) with the following:
1. The `mode` parameter set to `"shared"` to enable shared mode.
2. A unique label for [`x_label`](https://github.com/wandb/wandb/blob/main/wandb/sdk/wandb_settings.py#L638). You use the value you specify for `x_label` to identify which node the data is coming from in logs and system metrics in the W\&B App UI. If left unspecified, W\&B creates a label for you using the hostname and a random hash.
3. Set the [`x_primary`](https://github.com/wandb/wandb/blob/main/wandb/sdk/wandb_settings.py#L660) parameter to `True` to indicate that this is the primary node.
4. Optionally provide a list of GPU indexes (\[0,1,2]) to `x_stats_gpu_device_ids` to specify which GPUs W\&B tracks metrics for. If you do not provide a list, W\&B tracks metrics for all GPUs on the machine.
Make note of the run ID of the primary node. Each worker node needs the run ID of the primary node.
`x_primary=True` distinguishes a primary node from worker nodes. Primary nodes are the only nodes that upload files shared across nodes such as configuration files, telemetry and more. Worker nodes do not upload these files.
For each worker node, initialize a W\&B run with [`wandb.init()`](/models/ref/python/functions/init) and provide the following:
1. A `wandb.Settings` object to the `settings` parameter (`wandb.init(settings=wandb.Settings()`) with:
* The `mode` parameter set to `"shared"` to enable shared mode.
* A unique label for `x_label`. You use the value you specify for `x_label` to identify which node the data is coming from in logs and system metrics in the W\&B App UI. If left unspecified, W\&B creates a label for you using the hostname and a random hash.
* Set the `x_primary` parameter to `False` to indicate that this is a worker node.
2. Pass the run ID used by the primary node to the `id` parameter.
3. Optionally set [`x_update_finish_state`](https://github.com/wandb/wandb/blob/main/wandb/sdk/wandb_settings.py#L772) to `False`. This prevents non-primary nodes from updating the [run's state](/models/runs/run-states#run-states) to `finished` prematurely, ensuring the run state remains consistent and managed by the primary node.
* Use the same entity and project for all nodes. This helps ensure the correct run ID is found.
* Consider defining an environment variable on each worker node to set the run ID of the primary node.
The following sample code demonstrates the high level requirements for tracking multiple processes to a single run:
```python theme={null}
import wandb
entity = ""
project = ""
# Initialize a run in the primary node
run = wandb.init(
entity=entity,
project=project,
settings=wandb.Settings(
x_label="rank_0",
mode="shared",
x_primary=True,
x_stats_gpu_device_ids=[0, 1], # (Optional) Only track metrics for GPU 0 and 1
)
)
# Note the run ID of the primary node.
# Each worker node needs this run ID.
run_id = run.id
# Initialize a run in a worker node using the run ID of the primary node
run = wandb.init(
entity=entity, # Use the same entity as the primary node
project=project, # Use the same project as the primary node
settings=wandb.Settings(x_label="rank_1", mode="shared", x_primary=False),
id=run_id,
)
# Initialize a run in a worker node using the run ID of the primary node
run = wandb.init(
entity=entity, # Use the same entity as the primary node
project=project, # Use the same project as the primary node
settings=wandb.Settings(x_label="rank_2", mode="shared", x_primary=False),
id=run_id,
)
```
In a real world example, each worker node might be on a separate machine.
See the [Distributed Training with Shared Mode](https://wandb.ai/dimaduev/simple-cnn-ddp/reports/Distributed-Training-with-Shared-Mode--VmlldzoxMTI0NTE1NA) report for an end-to-end example on how to train a model on a multi-node and multi-GPU Kubernetes cluster in GKE.
View console logs from multi node processes in the project that the run logs to:
1. Navigate to the project that contains the run.
2. Click on the **Runs** tab in the project sidebar.
3. Click on the run you want to view.
4. Click on the **Logs** tab in the project sidebar.
You can filter console logs based on the labels you provide for `x_label` in the UI search bar located at the top of the console log page. For example, the following image shows which options are available to filter the console log by if values `rank0`, `rank1`, `rank2`, `rank3`, `rank4`, `rank5`, and `rank6` are provided to `x_label`.\`
 See [Console logs](/models/app/console-logs/) for more information.
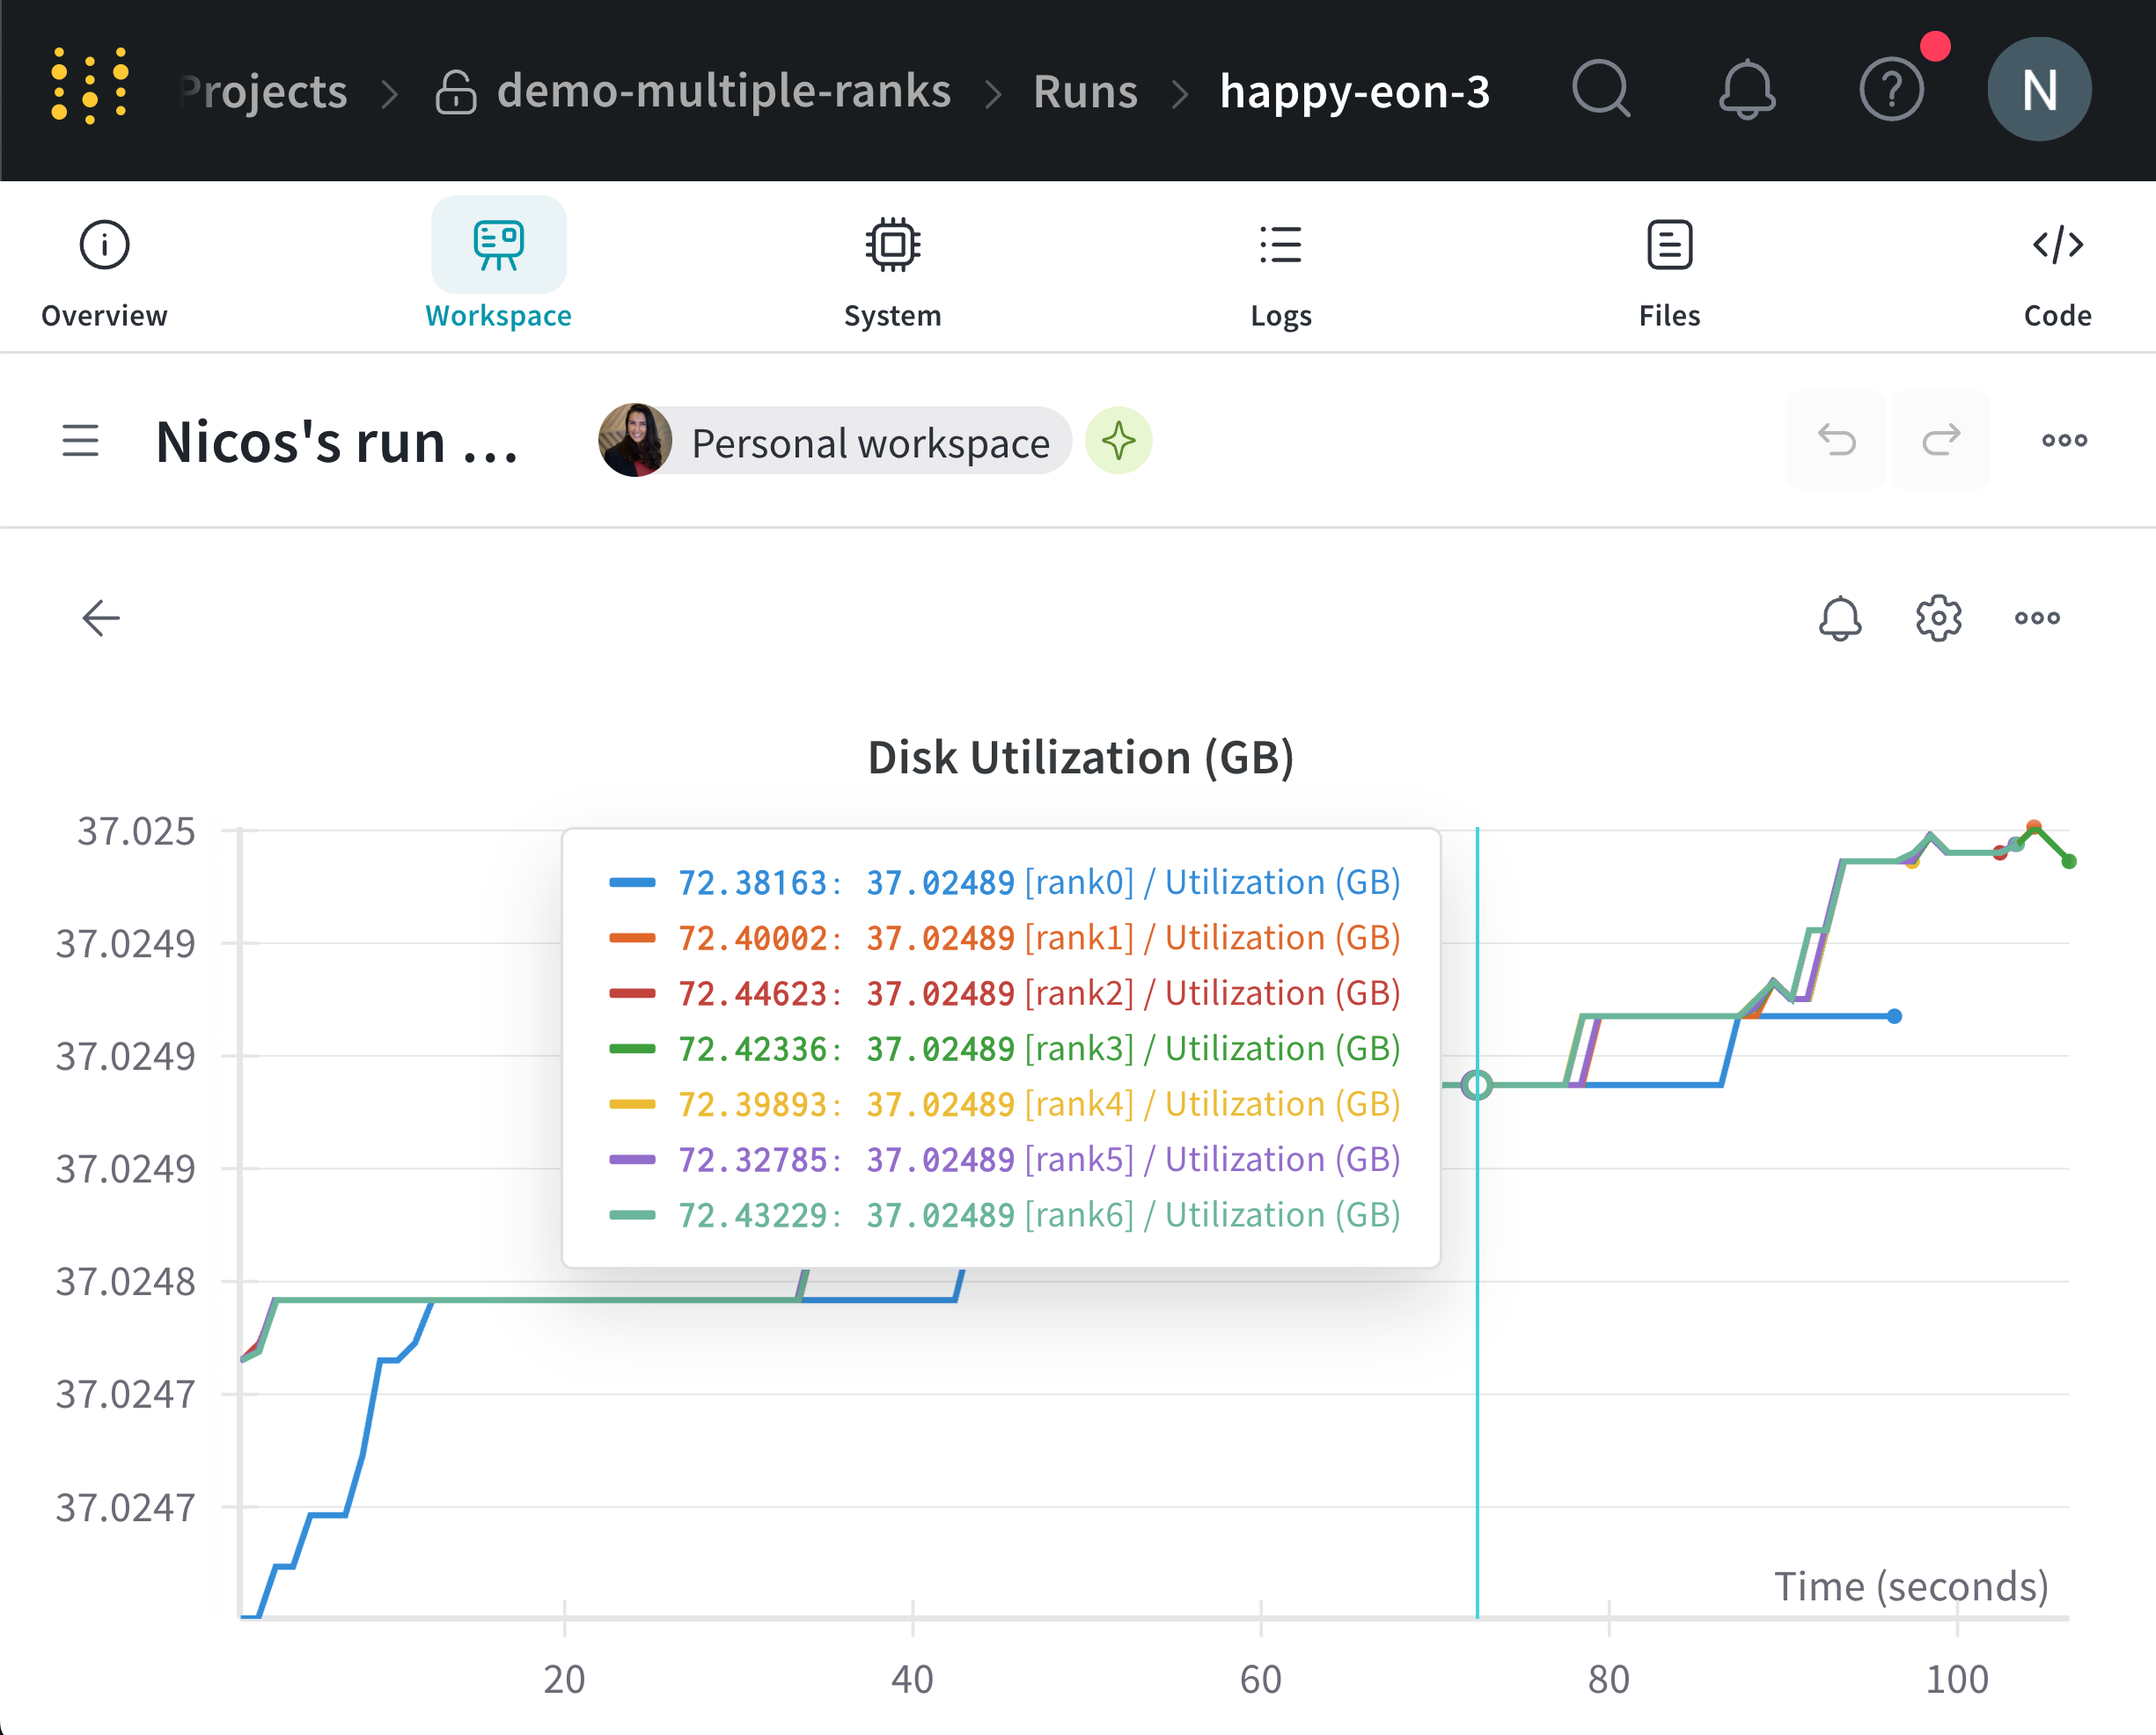
W\&B aggregates system metrics from all nodes and displays them in the W\&B App UI. For example, the following image shows a sample dashboard with system metrics from multiple nodes. Each node possesses a unique label (`rank_0`, `rank_1`, `rank_2`) that you specify in the `x_label` parameter.
See [Console logs](/models/app/console-logs/) for more information.
W\&B aggregates system metrics from all nodes and displays them in the W\&B App UI. For example, the following image shows a sample dashboard with system metrics from multiple nodes. Each node possesses a unique label (`rank_0`, `rank_1`, `rank_2`) that you specify in the `x_label` parameter.
 See [Line plots](/models/app/features/panels/line-plot/) for information on how to customize line plot panels.
## Example use cases
The following code snippets demonstrate common scenarios for advanced distributed use cases.
### Spawn process
Use the `wandb.setup()`method in your main function if you initiate a run in a spawned process:
```python theme={null}
import multiprocessing as mp
def do_work(n):
with wandb.init(config=dict(n=n)) as run:
run.log(dict(this=n * n))
def main():
wandb.setup()
pool = mp.Pool(processes=4)
pool.map(do_work, range(4))
if __name__ == "__main__":
main()
```
### Share a run
Pass a run object as an argument to share runs between processes:
```python theme={null}
def do_work(run):
with wandb.init() as run:
run.log(dict(this=1))
def main():
run = wandb.init()
p = mp.Process(target=do_work, kwargs=dict(run=run))
p.start()
p.join()
run.finish() # mark the run as finished
if __name__ == "__main__":
main()
```
W\&B can not guarantee the logging order. Synchronization should be done by the author of the script.
## Troubleshooting
There are two common issues you might encounter when using W\&B and distributed training:
1. **Hanging at the beginning of training** - A `wandb` process can hang if the `wandb` multiprocessing interferes with the multiprocessing from distributed training.
2. **Hanging at the end of training** - A training job might hang if the `wandb` process does not know when it needs to exit. Call the `wandb.Run.finish()` API at the end of your Python script to tell W\&B that the run finished. The `wandb.Run.finish()` API will finish uploading data and will cause W\&B to exit.
W\&B recommends using `wandb service` command to improve the reliability of your distributed jobs. Both of the preceding training issues are commonly found in versions of the W\&B SDK where wandb service is unavailable.
### Enable W\&B Service
Depending on your version of the W\&B SDK, you might already have W\&B Service enabled by default.
#### W\&B SDK 0.13.0 and above
W\&B Service is enabled by default for versions of the W\&B SDK `0.13.0` and above.
#### W\&B SDK 0.12.5 and above
Modify your Python script to enable W\&B Service for W\&B SDK version 0.12.5 and above. Use the `wandb.require()` method and pass the string `"service"` within your main function:
```python theme={null}
if __name__ == "__main__":
main()
def main():
wandb.require("service")
# rest-of-your-script-goes-here
```
For optimal experience we do recommend you upgrade to the latest version.
**W\&B SDK 0.12.4 and below**
Set the `WANDB_START_METHOD` environment variable to `"thread"` to use multithreading instead if you use a W\&B SDK version 0.12.4 and below.
See [Line plots](/models/app/features/panels/line-plot/) for information on how to customize line plot panels.
## Example use cases
The following code snippets demonstrate common scenarios for advanced distributed use cases.
### Spawn process
Use the `wandb.setup()`method in your main function if you initiate a run in a spawned process:
```python theme={null}
import multiprocessing as mp
def do_work(n):
with wandb.init(config=dict(n=n)) as run:
run.log(dict(this=n * n))
def main():
wandb.setup()
pool = mp.Pool(processes=4)
pool.map(do_work, range(4))
if __name__ == "__main__":
main()
```
### Share a run
Pass a run object as an argument to share runs between processes:
```python theme={null}
def do_work(run):
with wandb.init() as run:
run.log(dict(this=1))
def main():
run = wandb.init()
p = mp.Process(target=do_work, kwargs=dict(run=run))
p.start()
p.join()
run.finish() # mark the run as finished
if __name__ == "__main__":
main()
```
W\&B can not guarantee the logging order. Synchronization should be done by the author of the script.
## Troubleshooting
There are two common issues you might encounter when using W\&B and distributed training:
1. **Hanging at the beginning of training** - A `wandb` process can hang if the `wandb` multiprocessing interferes with the multiprocessing from distributed training.
2. **Hanging at the end of training** - A training job might hang if the `wandb` process does not know when it needs to exit. Call the `wandb.Run.finish()` API at the end of your Python script to tell W\&B that the run finished. The `wandb.Run.finish()` API will finish uploading data and will cause W\&B to exit.
W\&B recommends using `wandb service` command to improve the reliability of your distributed jobs. Both of the preceding training issues are commonly found in versions of the W\&B SDK where wandb service is unavailable.
### Enable W\&B Service
Depending on your version of the W\&B SDK, you might already have W\&B Service enabled by default.
#### W\&B SDK 0.13.0 and above
W\&B Service is enabled by default for versions of the W\&B SDK `0.13.0` and above.
#### W\&B SDK 0.12.5 and above
Modify your Python script to enable W\&B Service for W\&B SDK version 0.12.5 and above. Use the `wandb.require()` method and pass the string `"service"` within your main function:
```python theme={null}
if __name__ == "__main__":
main()
def main():
wandb.require("service")
# rest-of-your-script-goes-here
```
For optimal experience we do recommend you upgrade to the latest version.
**W\&B SDK 0.12.4 and below**
Set the `WANDB_START_METHOD` environment variable to `"thread"` to use multithreading instead if you use a W\&B SDK version 0.12.4 and below.