> ## Documentation Index
> Fetch the complete documentation index at: https://docs.wandb.ai/llms.txt
> Use this file to discover all available pages before exploring further.
> Compare versions of your model, explore results in a scratch workspace, and export findings to a report to save notes and visualizations
# Projects
A *project* is a central location where you visualize results, compare experiments, view and download artifacts, create an automation, and more.
Each project has a visibility setting that determines who can access it. For more information about who can access a project, see [Project visibility](/platform/hosting/iam/access-management/restricted-projects).
Each project contains the following tabs:
* [Overview](/models/track/project-page/#overview-tab): snapshot of your project
* [Workspace](/models/track/project-page/#workspace-tab): personal visualization sandbox
* [Runs](#runs-tab): A table that lists all the runs in your project
* [Automations](#automations-tab): Automations configured in your project
* [Sweeps](/models/sweeps): automated exploration and optimization
* [Reports](/models/track/project-page/#reports-tab): saved snapshots of notes, runs, and graphs
* [Artifacts](#artifacts-tab): Contains all runs and the artifacts associated with that run
## Overview tab
W\&B creates a project for you when you initialize a run with the name you provide for the project field.
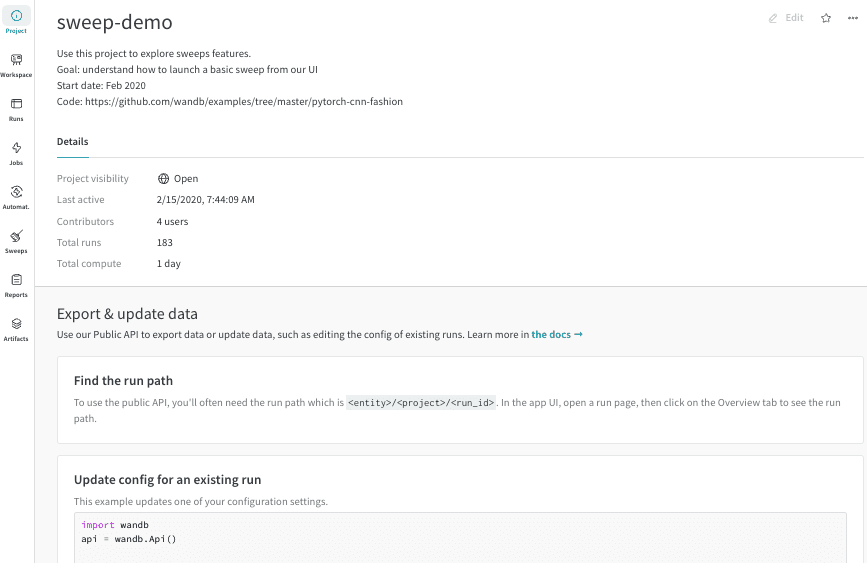
From the **Overview** tab, you can find the project name and manage the project.
* To change the project's name, description, or team, click **Edit** in the upper right corner.
* To undelete recently deleted runs, click the **action ()** menu in the upper right corner, then click **Undelete recently deleted runs**.
* To delete the project, click the **action ()** menu in the upper right corner, then click **Delete project**. Read the confirmation dialog and follow the instructions. Deleting a project is not reversible.
The rest of the **Overview** page is divided into **Details** and **Project roles** tabs.
### Details
Details about the project include:
* **Project visibility**: The visibility of the project. The visibility setting that determines who can access it. See [Project visibility](/platform/hosting/iam/access-management/restricted-projects) for more information.
* **Last active**: Timestamp of the last time data is logged to this project
* **Contributors**: The number of users that contribute to this project
* **Total runs**: The total number of runs in this project
* **Total compute**: we add up all the run times in your project to get this total
The **Details** tab also includes instructions for accessing and exporting the project's data and metrics, downloading the best model from a sweep, and more.
[View a live example project](https://wandb.ai/example-team/sweep-demo/overview)
 To change a project's privacy from the **Overview** tab:
1. In the W\&B App, from any page in the project, click **Overview** in the left navigation.
2. At the top right, click **Edit**.
3. Choose a new value for **Project visibility**:
* **Team** (default): Only your team can view and edit the project.
* **Restricted**: Only invited members can access the project, and public access is turned off.
* **Open**: Anyone can submit runs or create reports, but only your team can edit it. Appropriate only for classroom settings, public benchmark competitions, or other non-durable contexts.
* **Public**: Anyone can view the project, but only your team can edit it.
If your W\&B admins have turned off **Public** visibility, you cannot choose it. Instead, you can share a view-only [W\&B Report](/models/reports/collaborate-on-reports#share-a-report), or contact your W\&B organization's admins for assistance.
4. Click **Save**.
If you update a project to a more strict privacy setting, you may need to re-invite individual users to restore their ability to access the project.
### Project roles
The **Project roles** tab is visible only to the project owner and those with the **Admin** role. List and search for users with access to the project or change a member's role.
## Workspace tab
A project's *workspace* gives you a personal sandbox to compare experiments. Use projects to organize models that can be compared, working on the same problem with different architectures, hyperparameters, datasets, preprocessing etc.
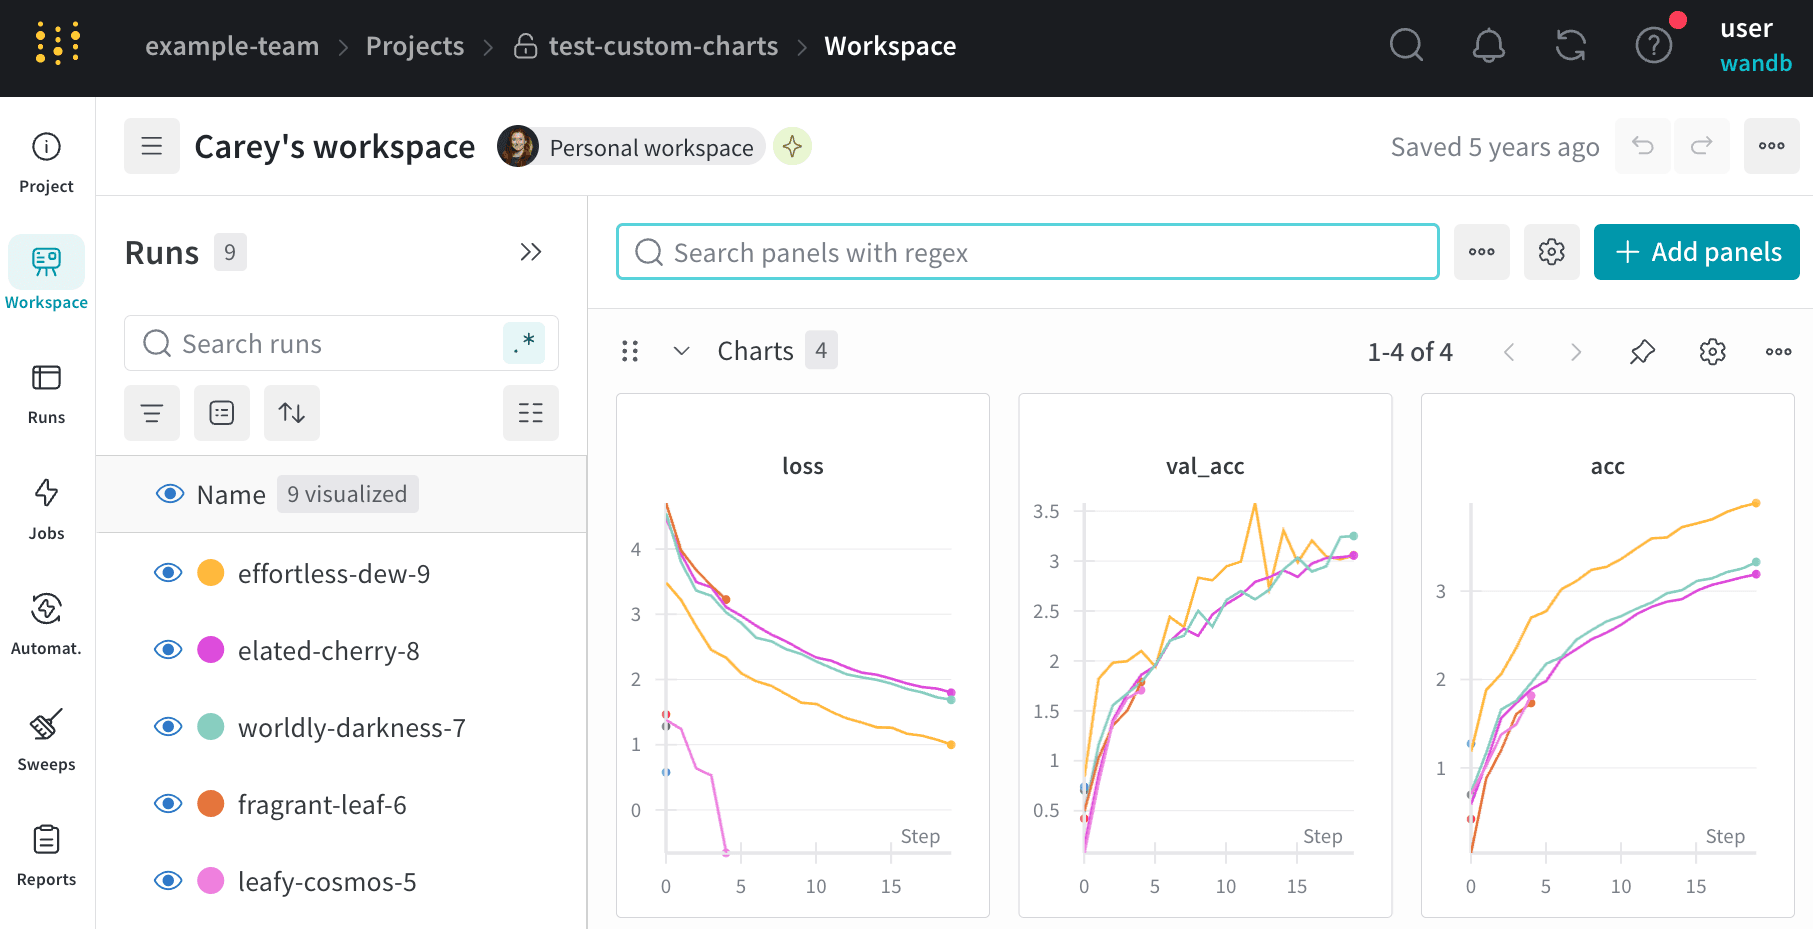
**Runs sidebar**: list of all the runs in your project.
* **action ()** menu: Hover over a row in the sidebar to see the menu appear on the left side. Use this menu to rename a run, delete a run, or stop and active run.
* **Visibility icon**: click the eye to turn on and off runs on graphs
* **Color**: change the run color to another one of our presets or a custom color
* **Search**: search runs by name. This also filters visible runs in the plots.
* **Filter**: use the sidebar filter to narrow down the set of runs visible
* **Group**: select a config column to dynamically group your runs, for example by architecture. Grouping makes plots show up with a line along the mean value, and a shaded region for the variance of points on the graph.
* **Sort**: pick a value to sort your runs by, for example runs with the lowest loss or highest accuracy. Sorting will affect which runs show up on the graphs.
* **Expand button**: expand the sidebar into the full table
* **Minimize**: press **Cmd+.** (macOS) or **Ctrl+.** (Windows/Linux) to collapse or restore the Runs selector. See [Keyboard shortcuts](/models/app/keyboard-shortcuts) for details.
* **Run count**: the number in parentheses at the top is the total number of runs in the project. The number (N visualized) is the number of runs that have the eye turned on and are available to be visualized in each plot. In the example below, the graphs are only showing the first 10 of 183 runs. Edit a graph to increase the max number of runs visible.
If you pin, hide, or change the order of columns in the [Runs tab](#runs-tab), the Runs sidebar reflects these customizations.
**Panels layout**: use this scratch space to explore results, add and remove charts, and compare versions of your models based on different metrics
[View a live example](https://wandb.ai/example-team/sweep-demo)
To change a project's privacy from the **Overview** tab:
1. In the W\&B App, from any page in the project, click **Overview** in the left navigation.
2. At the top right, click **Edit**.
3. Choose a new value for **Project visibility**:
* **Team** (default): Only your team can view and edit the project.
* **Restricted**: Only invited members can access the project, and public access is turned off.
* **Open**: Anyone can submit runs or create reports, but only your team can edit it. Appropriate only for classroom settings, public benchmark competitions, or other non-durable contexts.
* **Public**: Anyone can view the project, but only your team can edit it.
If your W\&B admins have turned off **Public** visibility, you cannot choose it. Instead, you can share a view-only [W\&B Report](/models/reports/collaborate-on-reports#share-a-report), or contact your W\&B organization's admins for assistance.
4. Click **Save**.
If you update a project to a more strict privacy setting, you may need to re-invite individual users to restore their ability to access the project.
### Project roles
The **Project roles** tab is visible only to the project owner and those with the **Admin** role. List and search for users with access to the project or change a member's role.
## Workspace tab
A project's *workspace* gives you a personal sandbox to compare experiments. Use projects to organize models that can be compared, working on the same problem with different architectures, hyperparameters, datasets, preprocessing etc.
**Runs sidebar**: list of all the runs in your project.
* **action ()** menu: Hover over a row in the sidebar to see the menu appear on the left side. Use this menu to rename a run, delete a run, or stop and active run.
* **Visibility icon**: click the eye to turn on and off runs on graphs
* **Color**: change the run color to another one of our presets or a custom color
* **Search**: search runs by name. This also filters visible runs in the plots.
* **Filter**: use the sidebar filter to narrow down the set of runs visible
* **Group**: select a config column to dynamically group your runs, for example by architecture. Grouping makes plots show up with a line along the mean value, and a shaded region for the variance of points on the graph.
* **Sort**: pick a value to sort your runs by, for example runs with the lowest loss or highest accuracy. Sorting will affect which runs show up on the graphs.
* **Expand button**: expand the sidebar into the full table
* **Minimize**: press **Cmd+.** (macOS) or **Ctrl+.** (Windows/Linux) to collapse or restore the Runs selector. See [Keyboard shortcuts](/models/app/keyboard-shortcuts) for details.
* **Run count**: the number in parentheses at the top is the total number of runs in the project. The number (N visualized) is the number of runs that have the eye turned on and are available to be visualized in each plot. In the example below, the graphs are only showing the first 10 of 183 runs. Edit a graph to increase the max number of runs visible.
If you pin, hide, or change the order of columns in the [Runs tab](#runs-tab), the Runs sidebar reflects these customizations.
**Panels layout**: use this scratch space to explore results, add and remove charts, and compare versions of your models based on different metrics
[View a live example](https://wandb.ai/example-team/sweep-demo)
 ### Add a section of panels
Click the section dropdown menu and click **Add section** to create a new section for panels. You can rename sections, drag them to reorganize them, and expand and collapse sections.
Each section has options in the upper right corner:
* **Add section**: Add a section above or below from the dropdown menu, or click the button at the bottom of the page to add a new section.
* **Rename section**: Change the title for your section.
* **Export section to report**: Save this section of panels to a new report.
* **Delete section**: Remove the whole section and all the charts. This can be undone with the undo button at the bottom of the page in the workspace bar.
* **Add panel**: Click the plus button to add a panel to the section.
### Move panels between sections
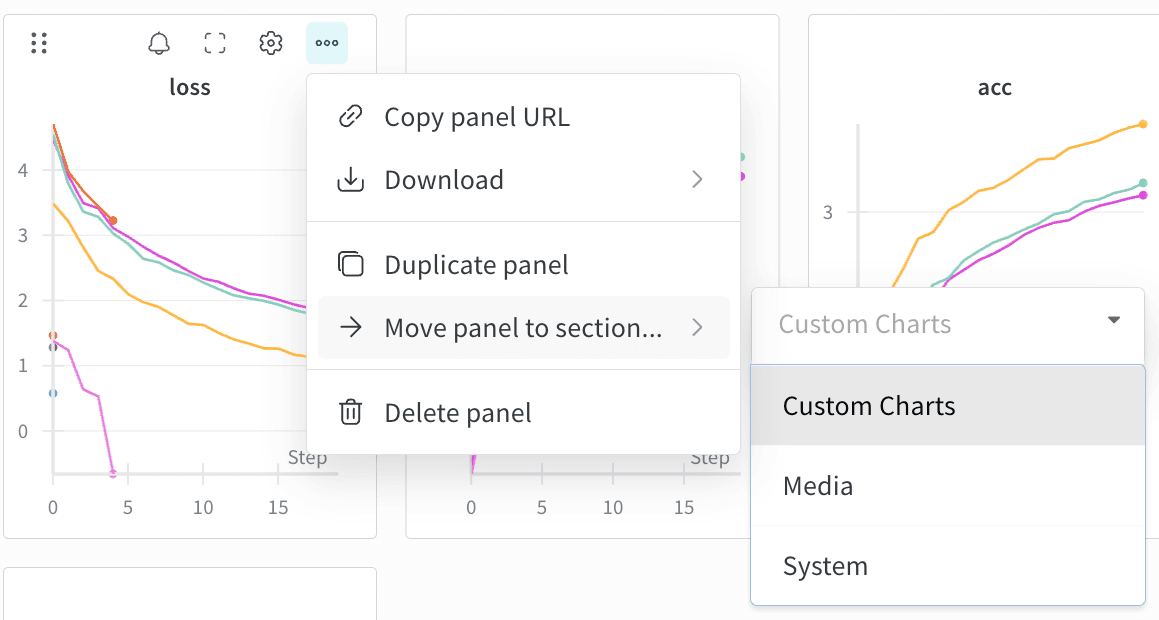
Drag and drop panels to reorder and organize into sections. You can also click the **Move** button in the upper right corner of a panel to select a section to move the panel to.
### Add a section of panels
Click the section dropdown menu and click **Add section** to create a new section for panels. You can rename sections, drag them to reorganize them, and expand and collapse sections.
Each section has options in the upper right corner:
* **Add section**: Add a section above or below from the dropdown menu, or click the button at the bottom of the page to add a new section.
* **Rename section**: Change the title for your section.
* **Export section to report**: Save this section of panels to a new report.
* **Delete section**: Remove the whole section and all the charts. This can be undone with the undo button at the bottom of the page in the workspace bar.
* **Add panel**: Click the plus button to add a panel to the section.
### Move panels between sections
Drag and drop panels to reorder and organize into sections. You can also click the **Move** button in the upper right corner of a panel to select a section to move the panel to.
 ### Resize panels
All panels maintain the same size, and there are pages of panels.
Resize the section by clicking and dragging the lower right corner of the section, which will display a corner icon when hovering.
### Resize panels
All panels maintain the same size, and there are pages of panels.
Resize the section by clicking and dragging the lower right corner of the section, which will display a corner icon when hovering.
 ### Search for metrics
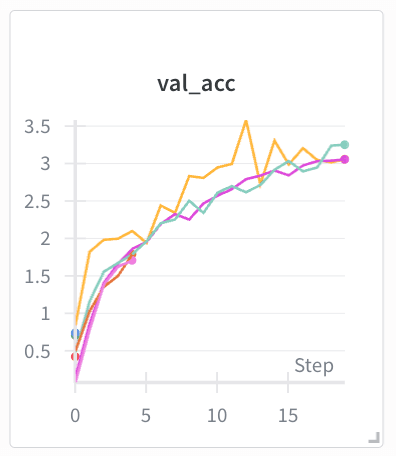
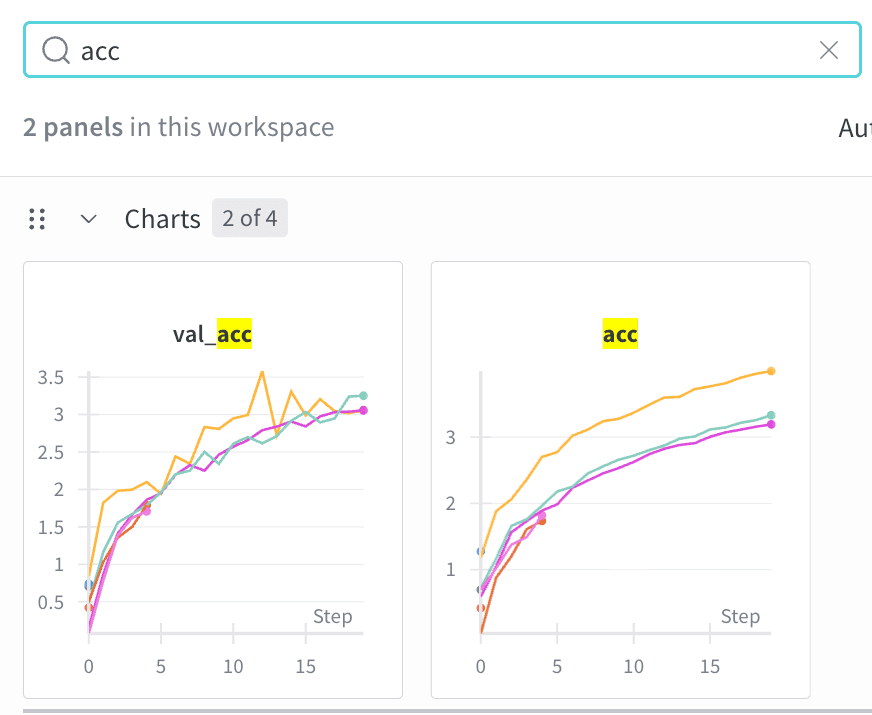
Use the search box in the workspace to filter down the panels. This search matches the panel titles, which are by default the name of the metrics visualized.
### Search for metrics
Use the search box in the workspace to filter down the panels. This search matches the panel titles, which are by default the name of the metrics visualized.
 ## Runs tab
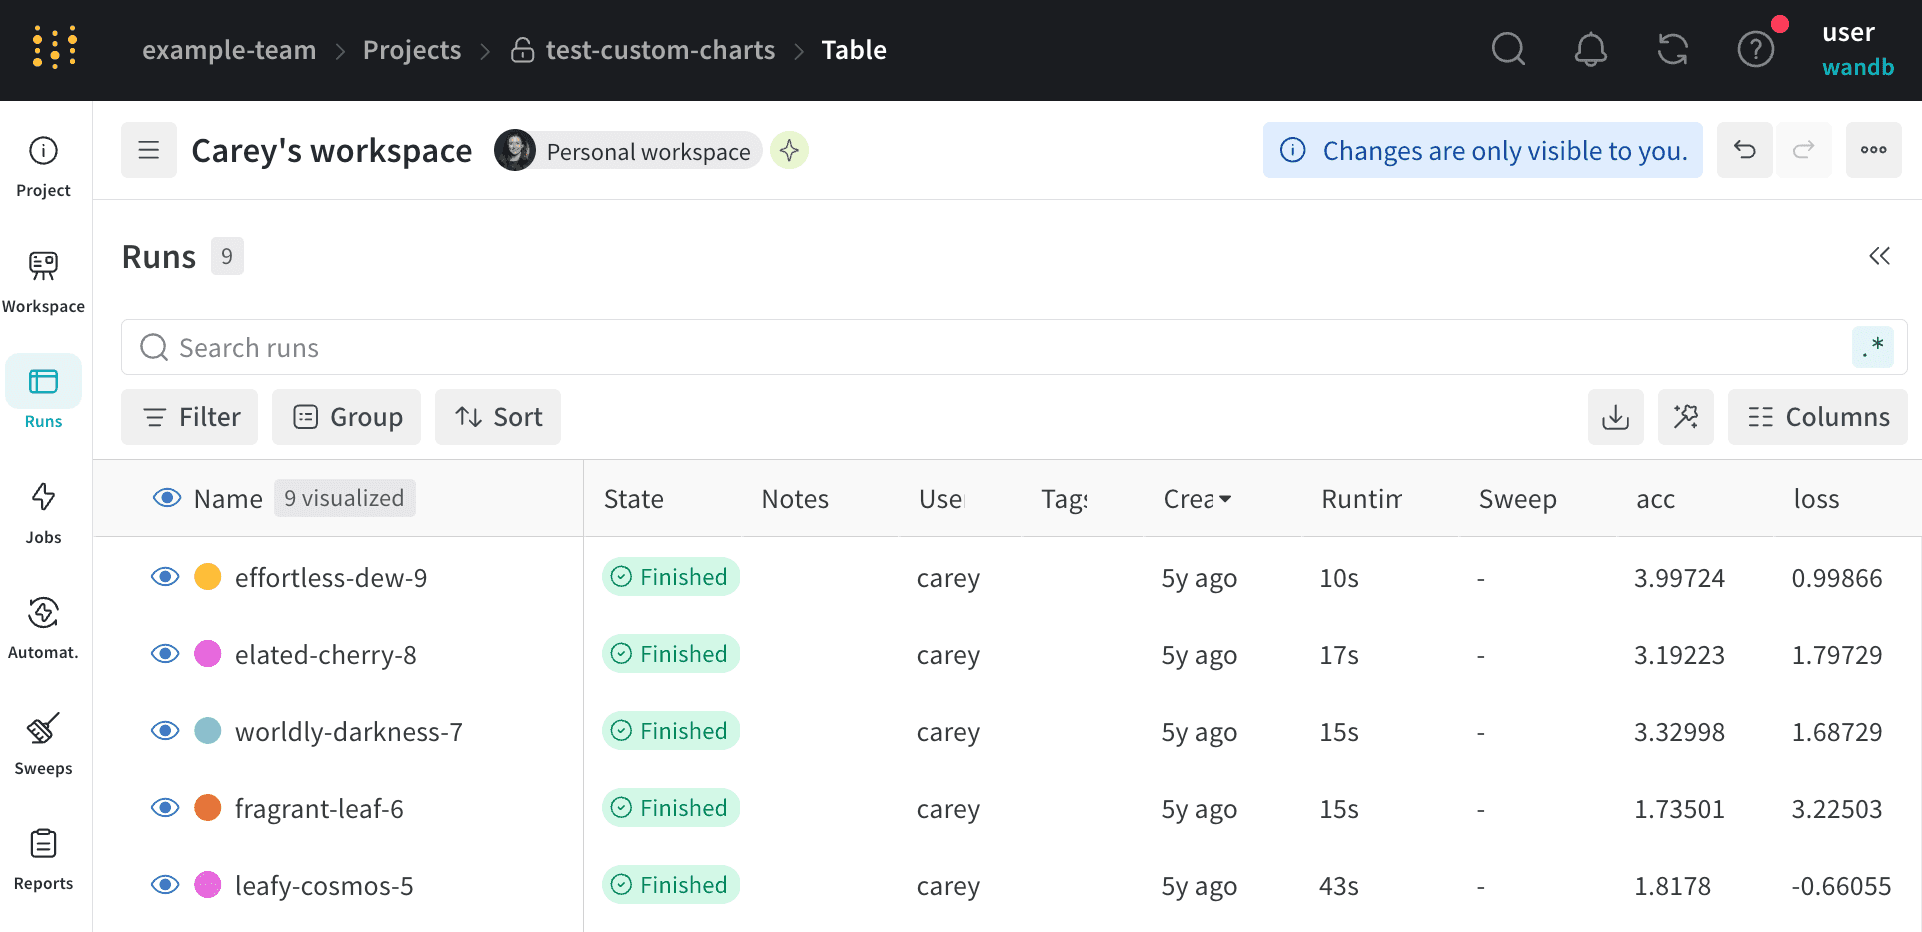
Use the Runs tab to filter, group, and sort your runs.
## Runs tab
Use the Runs tab to filter, group, and sort your runs.
 The following tabs demonstrate some common actions you can take in the Runs tab.
The Runs tab shows details about runs in the project. It shows a large number of columns by default.
When you customize the Runs tab, the customization is also reflected in the **Runs** selector of the [Workspace tab](#workspace-tab).
* To view all visible columns, scroll the page horizontally.
* To change the order of the columns, drag a column to the left or right.
* To pin a column, hover over the column name, click the **action ()** menu that appears, then click **Pin column**. Pinned columns appear near the left of the page, after the **Name** column. To unpin a pinned column, choose **Unpin column**.
* To hide a column, hover over the column name, click the **action ()** menu that appears, then click **Hide column**. To view all columns that are currently hidden, click **Columns**.
* To show, hide, pin, and unpin multiple columns at once, click **Columns**.
* Click the name of a hidden column to unhide it.
* Click the name of a visible column to hide it.
* Click the pin icon next to a visible column to pin it.
Sort all rows in a Table by the value in a given column using one of these options:
1. Click the **action ()** menu when hovering over any column header to quickly sort the table by that column's values.
2. Click the **Sort** button and select the desired columns from the drop-down. You can use this panel to sort by multiple columns in priority order.
The following tabs demonstrate some common actions you can take in the Runs tab.
The Runs tab shows details about runs in the project. It shows a large number of columns by default.
When you customize the Runs tab, the customization is also reflected in the **Runs** selector of the [Workspace tab](#workspace-tab).
* To view all visible columns, scroll the page horizontally.
* To change the order of the columns, drag a column to the left or right.
* To pin a column, hover over the column name, click the **action ()** menu that appears, then click **Pin column**. Pinned columns appear near the left of the page, after the **Name** column. To unpin a pinned column, choose **Unpin column**.
* To hide a column, hover over the column name, click the **action ()** menu that appears, then click **Hide column**. To view all columns that are currently hidden, click **Columns**.
* To show, hide, pin, and unpin multiple columns at once, click **Columns**.
* Click the name of a hidden column to unhide it.
* Click the name of a visible column to hide it.
* Click the pin icon next to a visible column to pin it.
Sort all rows in a Table by the value in a given column using one of these options:
1. Click the **action ()** menu when hovering over any column header to quickly sort the table by that column's values.
2. Click the **Sort** button and select the desired columns from the drop-down. You can use this panel to sort by multiple columns in priority order.
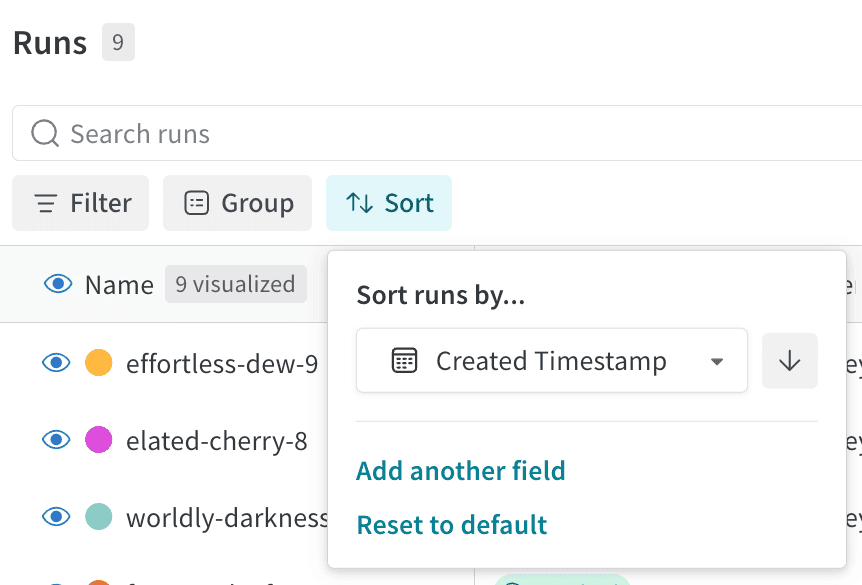 The preceding image demonstrates how to view sorting options for a Table column called `val_acc`.
Apply filter expressions to narrow down the runs you want to visualize.
The preceding image demonstrates how to view sorting options for a Table column called `val_acc`.
Apply filter expressions to narrow down the runs you want to visualize.
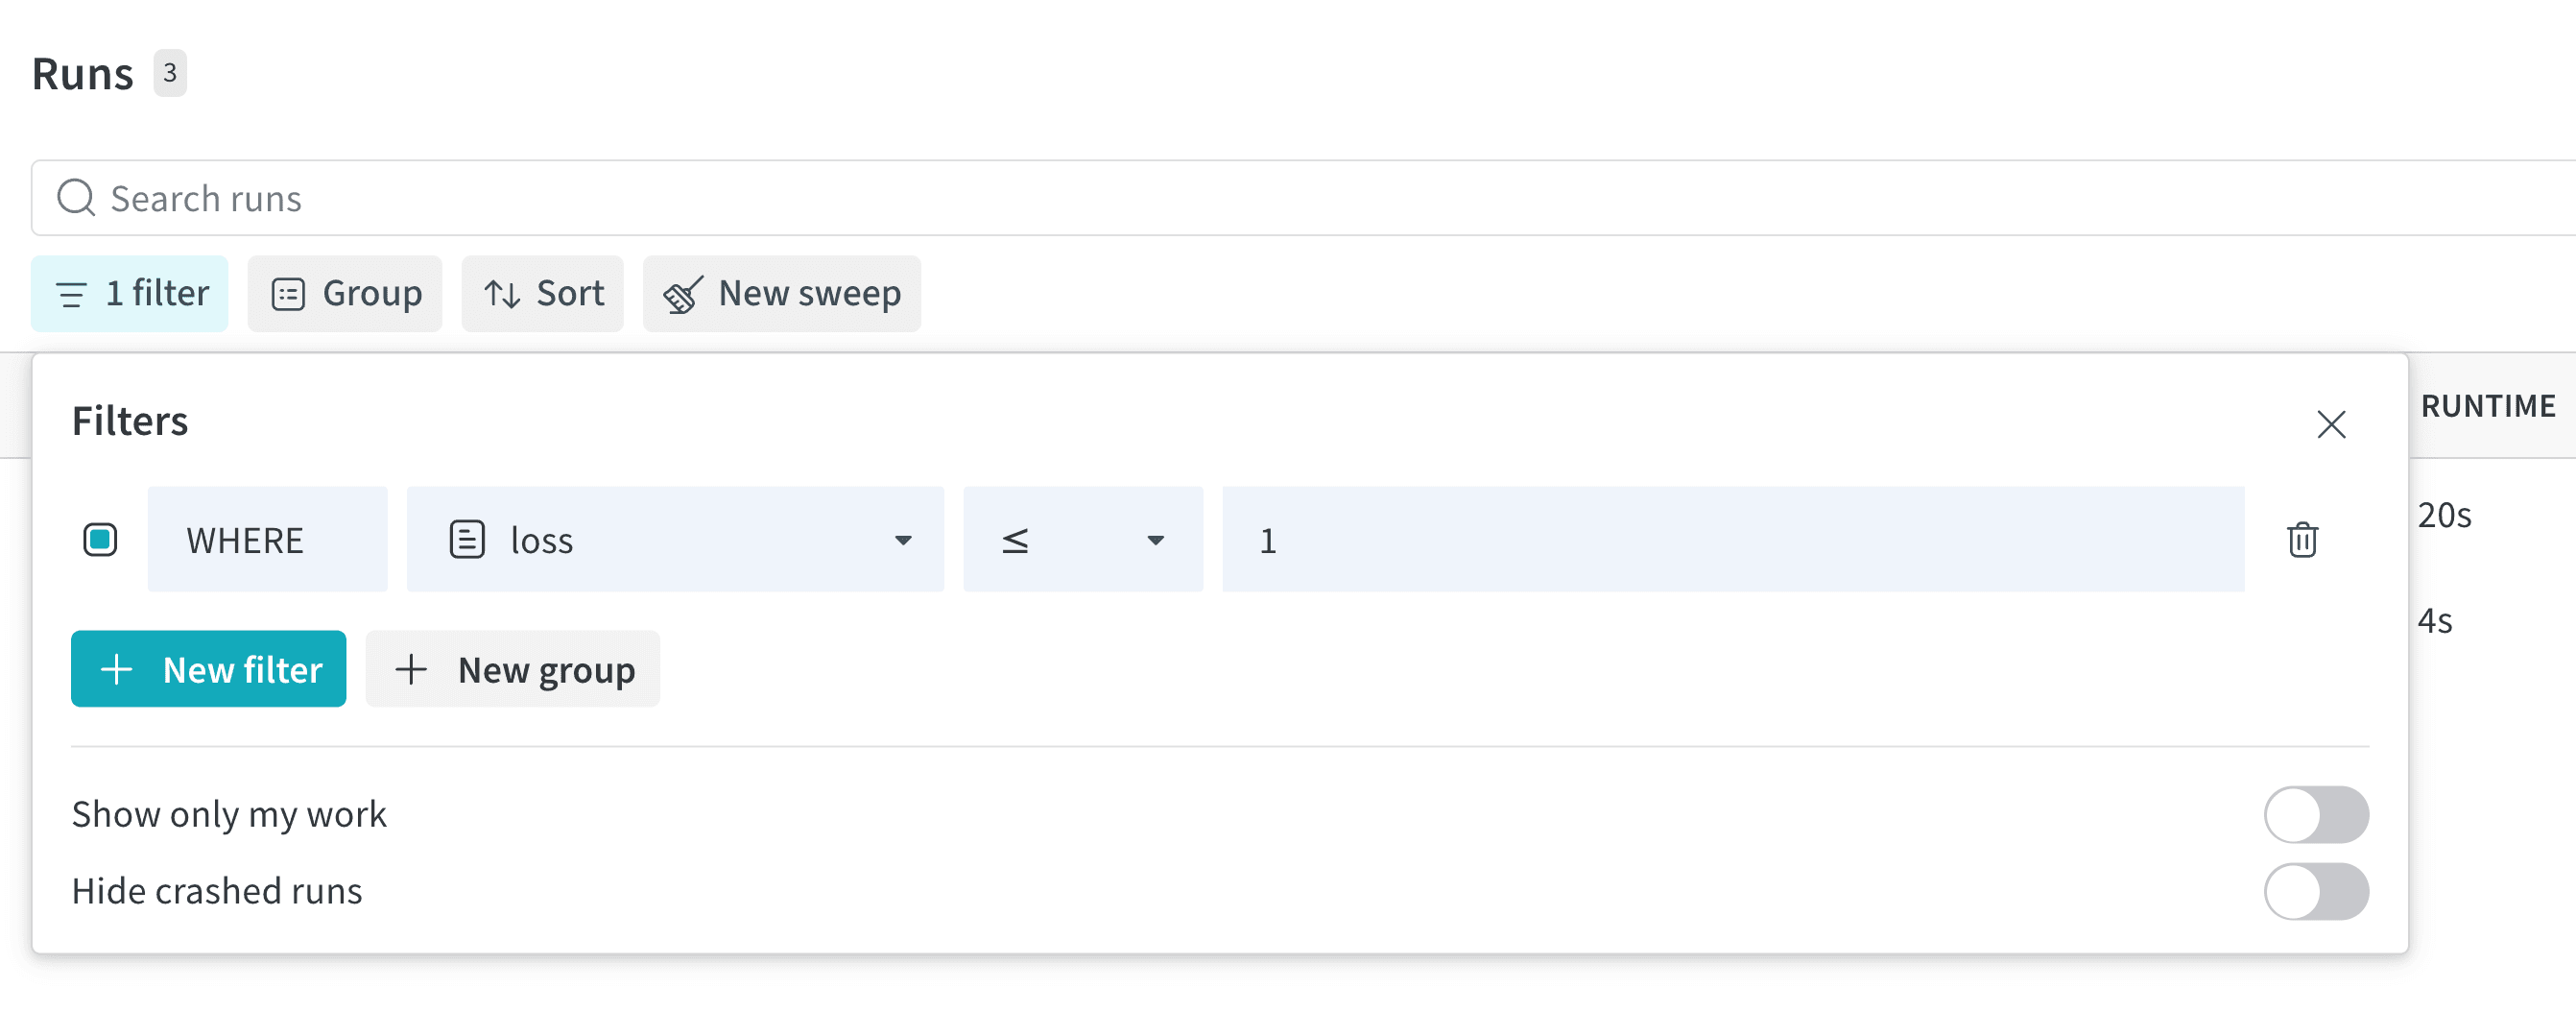 See [Create a filter expression](/models/runs/filter-runs#create-a-filter-expression) for more information on how to write filter expressions.
Click the **Group** button above the table to group all rows by the value in a particular column. For more information on how to group runs, see [Organize runs into groups](/models/runs/grouping).
## Automations tab
Automate downstream actions for versioning artifacts. To create an automation, define trigger events and resulting actions. Actions include executing a webhook or launching a W\&B job. For more information, see [Automations](/models/automations).
## Sweeps tab
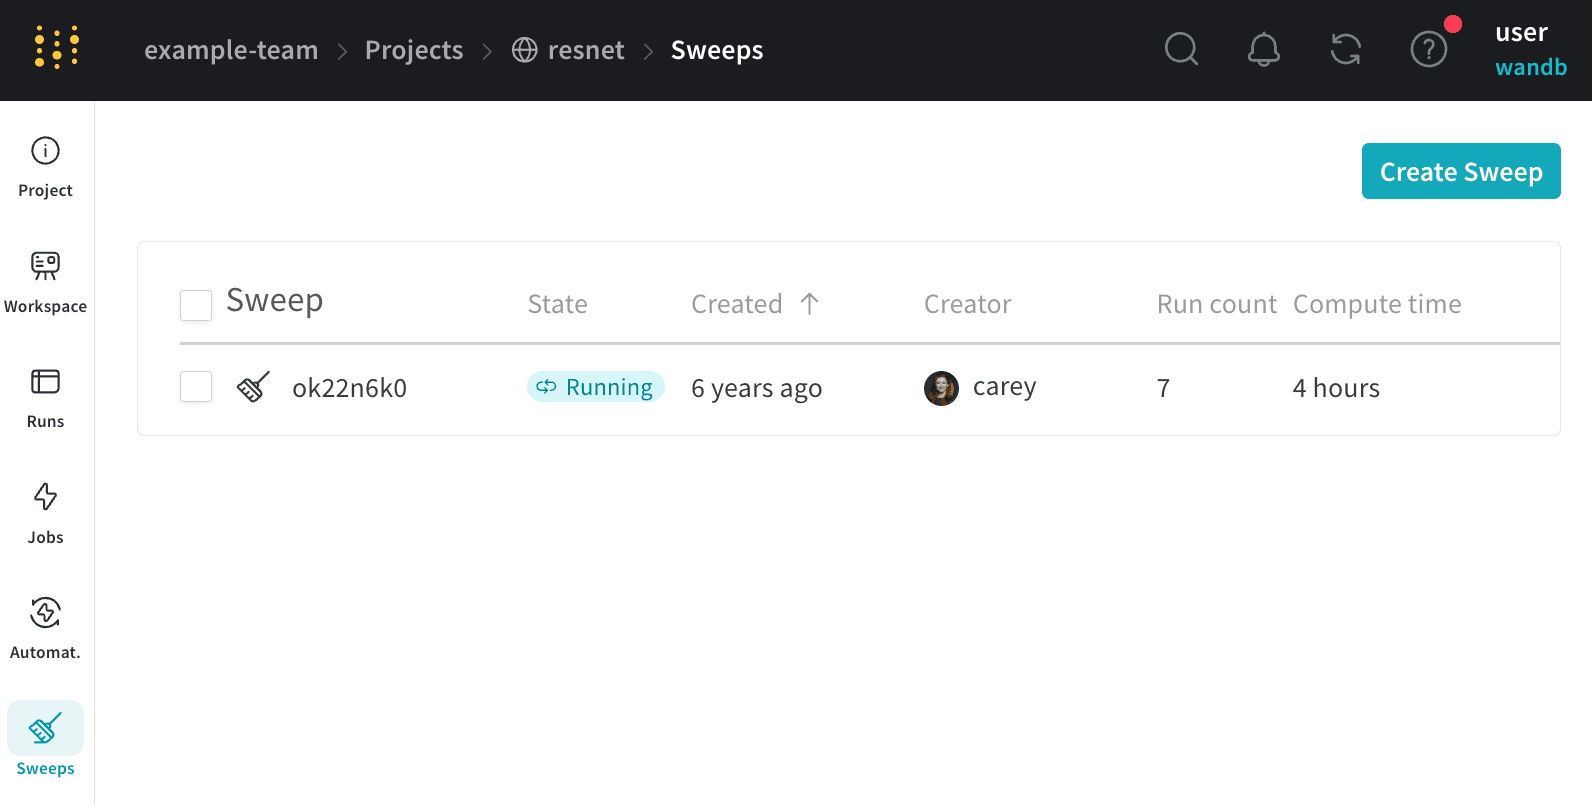
Start a new [sweep](/models/sweeps) from your project.
See [Create a filter expression](/models/runs/filter-runs#create-a-filter-expression) for more information on how to write filter expressions.
Click the **Group** button above the table to group all rows by the value in a particular column. For more information on how to group runs, see [Organize runs into groups](/models/runs/grouping).
## Automations tab
Automate downstream actions for versioning artifacts. To create an automation, define trigger events and resulting actions. Actions include executing a webhook or launching a W\&B job. For more information, see [Automations](/models/automations).
## Sweeps tab
Start a new [sweep](/models/sweeps) from your project.
 ## Reports tab
See all the snapshots of results in one place, and share findings with your team.
## Reports tab
See all the snapshots of results in one place, and share findings with your team.
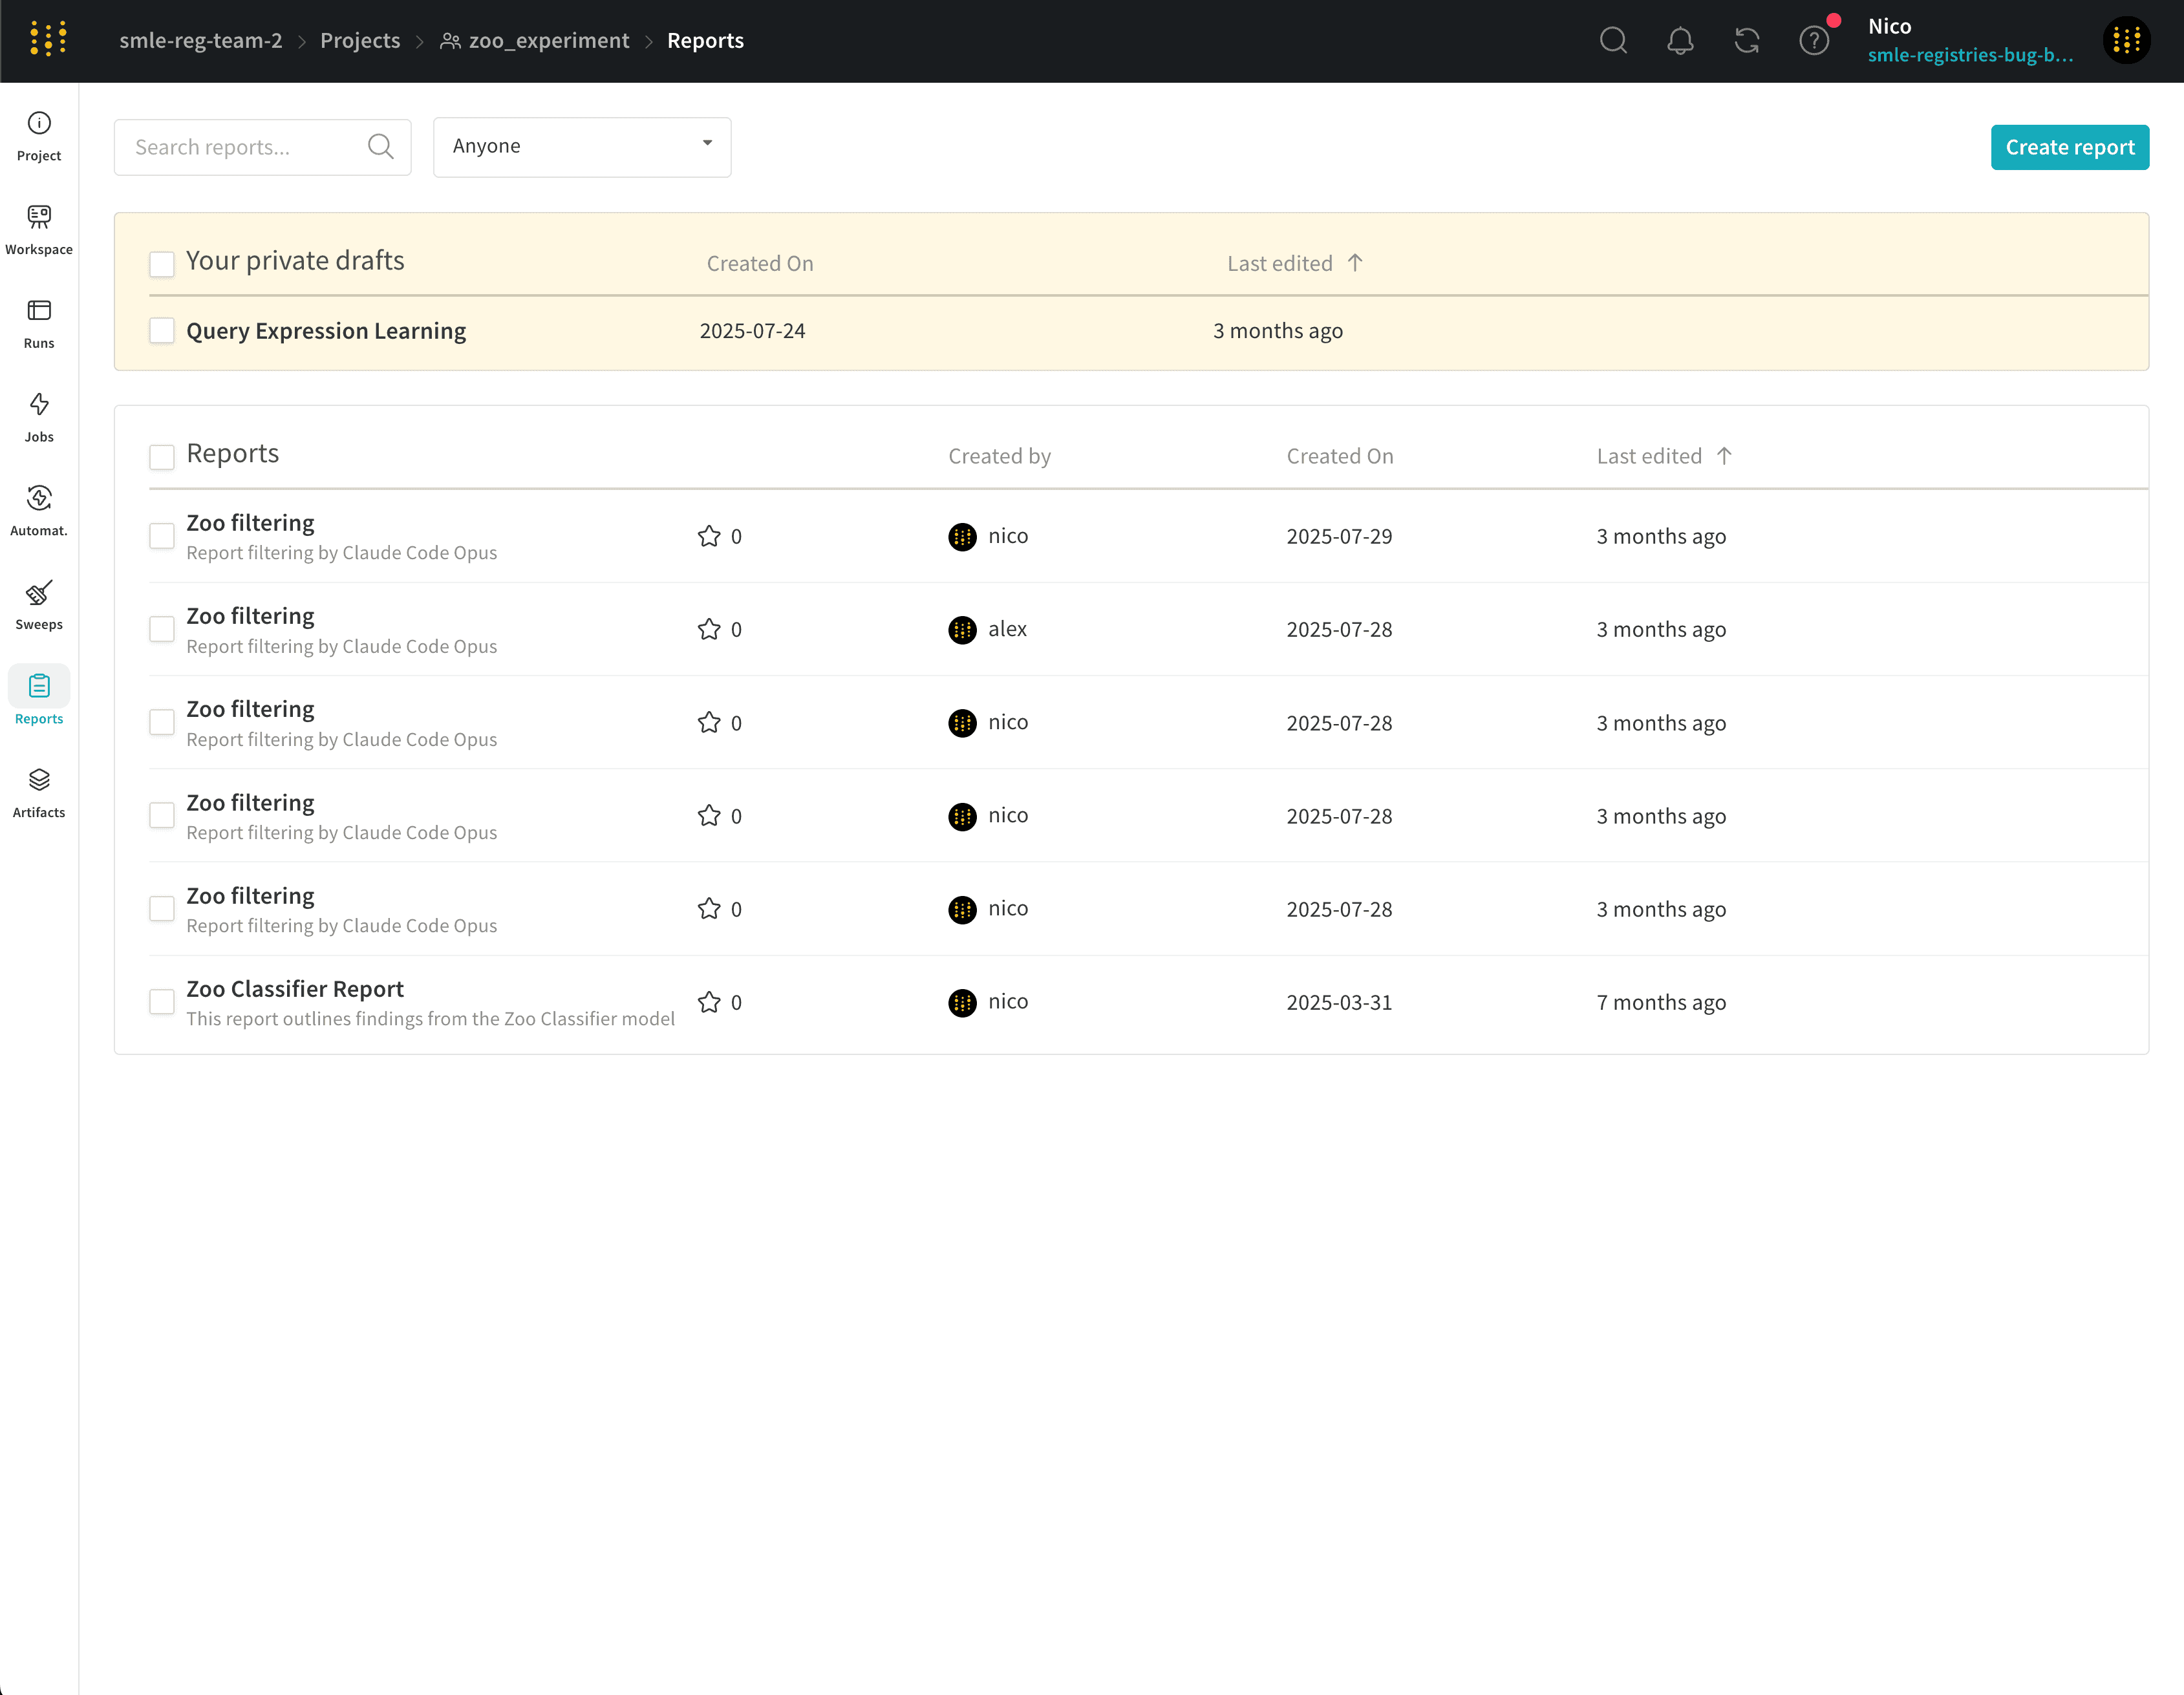 To view a report, select the **Reports** tab from the project sidebar, then select a report from the list.
## Artifacts tab
View all [artifacts](/models/artifacts) associated with a project, from training datasets and [fine-tuned models](/models/registry) to [tables of metrics and media](/models/tables/tables-walkthrough).
### Metadata panel
To view a report, select the **Reports** tab from the project sidebar, then select a report from the list.
## Artifacts tab
View all [artifacts](/models/artifacts) associated with a project, from training datasets and [fine-tuned models](/models/registry) to [tables of metrics and media](/models/tables/tables-walkthrough).
### Metadata panel
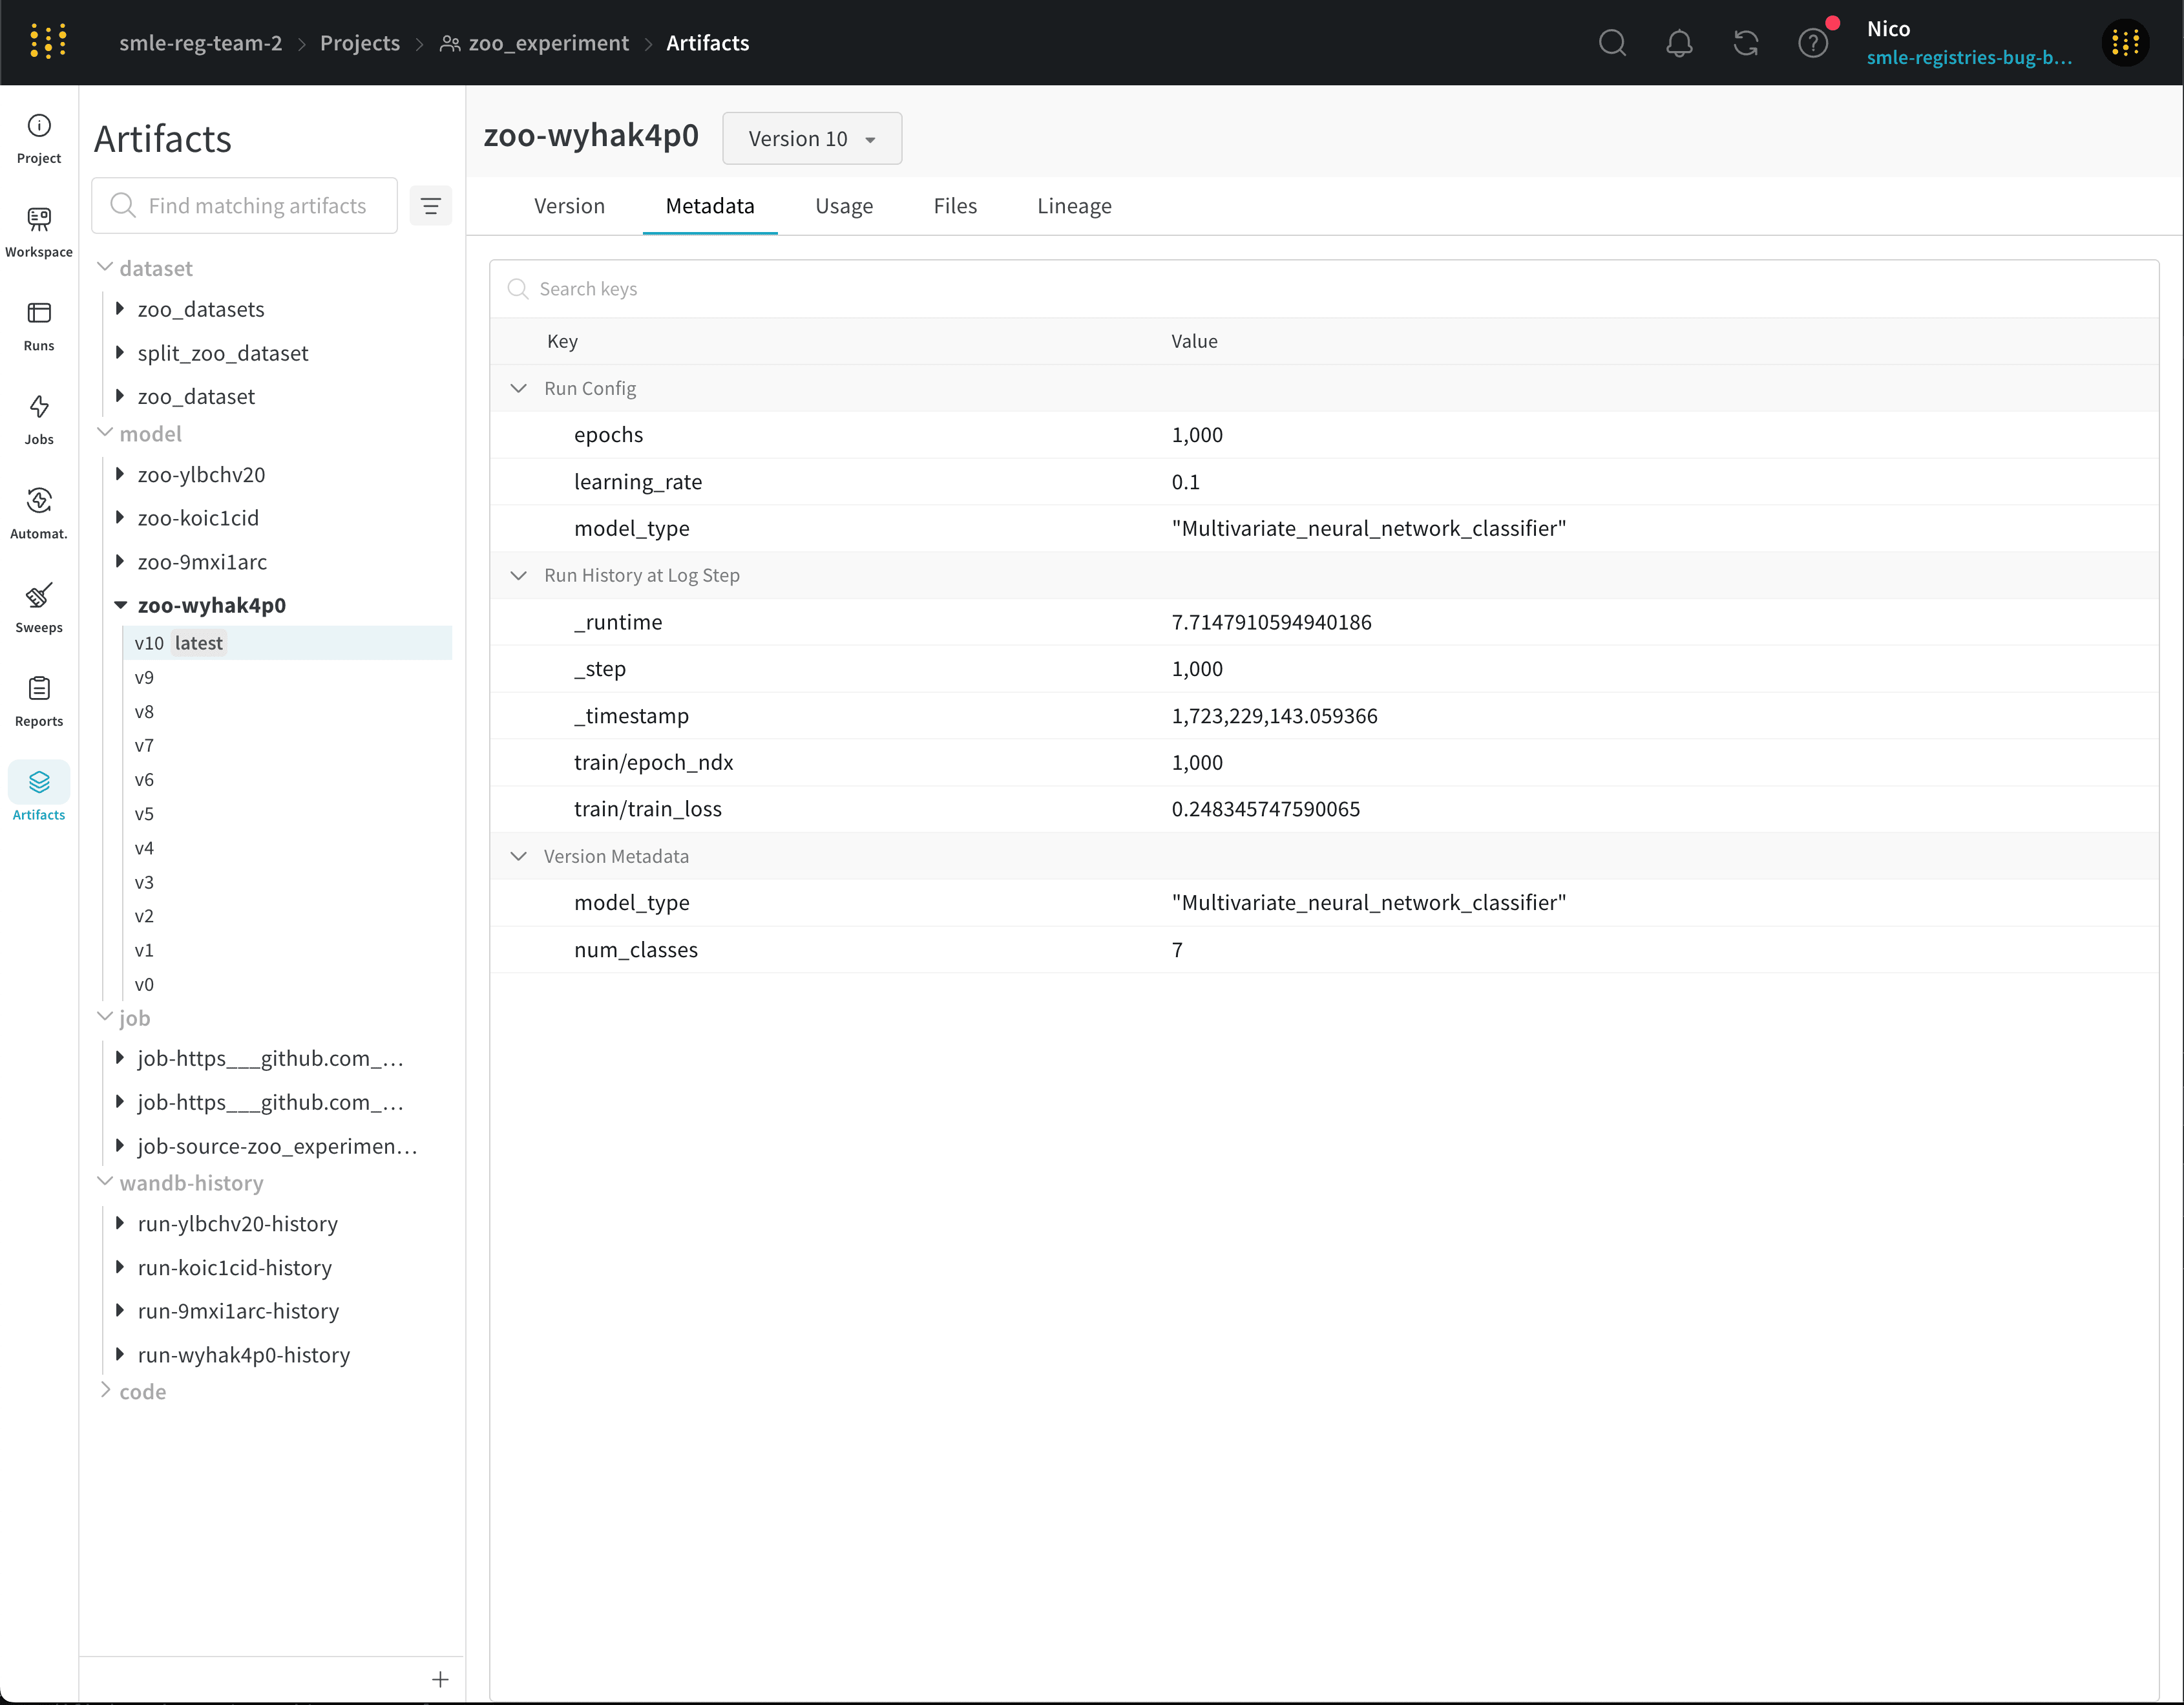 The metadata panel provides access to the artifact's metadata. This metadata might include configuration arguments required to reconstruct the artifact, URLs where more information can be found, or metrics produced during the run which logged the artifact.
View the configuration for the run that produced the artifact as well as history metrics.
To view an artifact's metadata:
1. Select the **Artifacts** tab from the project sidebar.
2. Select an artifact from the list to view the details page for the latest version of that artifact.
3. Select the **Metadata** tab to view the metadata associated with that artifact.
### Usage panel
The metadata panel provides access to the artifact's metadata. This metadata might include configuration arguments required to reconstruct the artifact, URLs where more information can be found, or metrics produced during the run which logged the artifact.
View the configuration for the run that produced the artifact as well as history metrics.
To view an artifact's metadata:
1. Select the **Artifacts** tab from the project sidebar.
2. Select an artifact from the list to view the details page for the latest version of that artifact.
3. Select the **Metadata** tab to view the metadata associated with that artifact.
### Usage panel
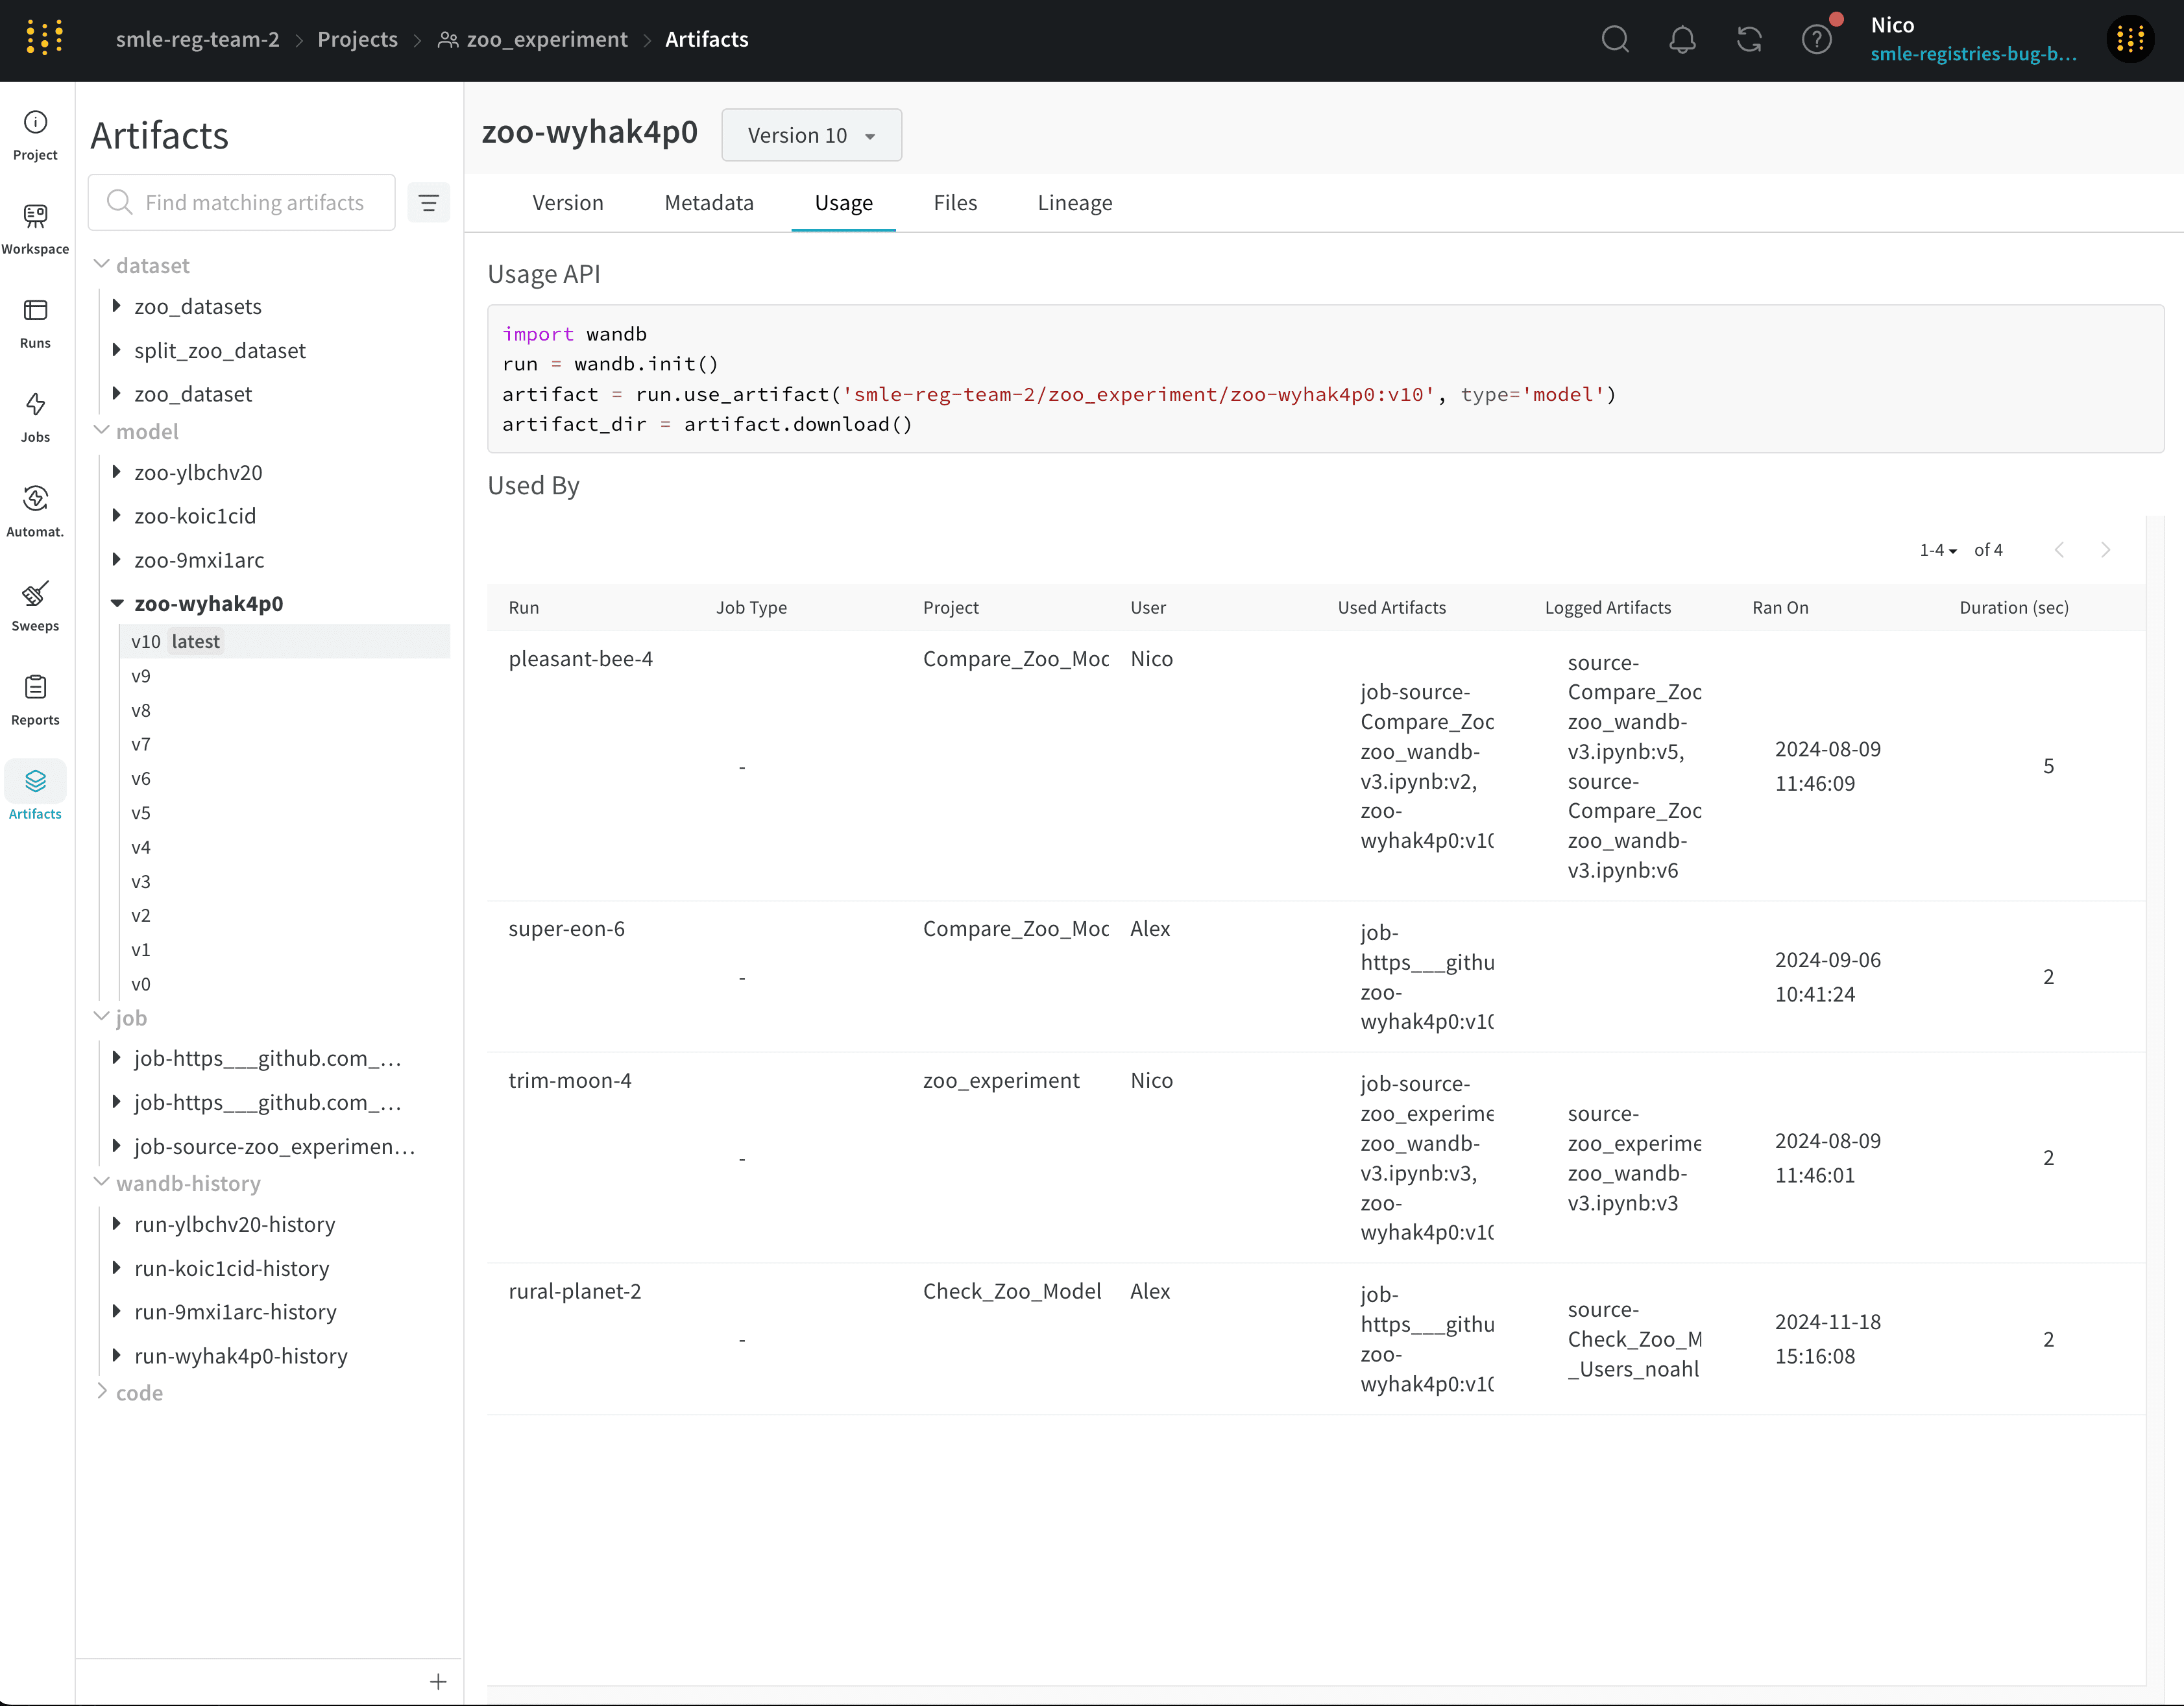 The usage panel provides a code snippet for downloading the artifact for use outside of the web app, for example on a local machine. This section also indicates and links to the run which output the artifact and any runs which use the artifact as an input.
To view the artifact usage:
1. Select the **Artifacts** tab from the project sidebar.
2. Select an artifact from the list to view the details page for the latest version of that artifact.
3. Select the **Usage** tab to view the code snippet and related runs.
### Files panel
The usage panel provides a code snippet for downloading the artifact for use outside of the web app, for example on a local machine. This section also indicates and links to the run which output the artifact and any runs which use the artifact as an input.
To view the artifact usage:
1. Select the **Artifacts** tab from the project sidebar.
2. Select an artifact from the list to view the details page for the latest version of that artifact.
3. Select the **Usage** tab to view the code snippet and related runs.
### Files panel
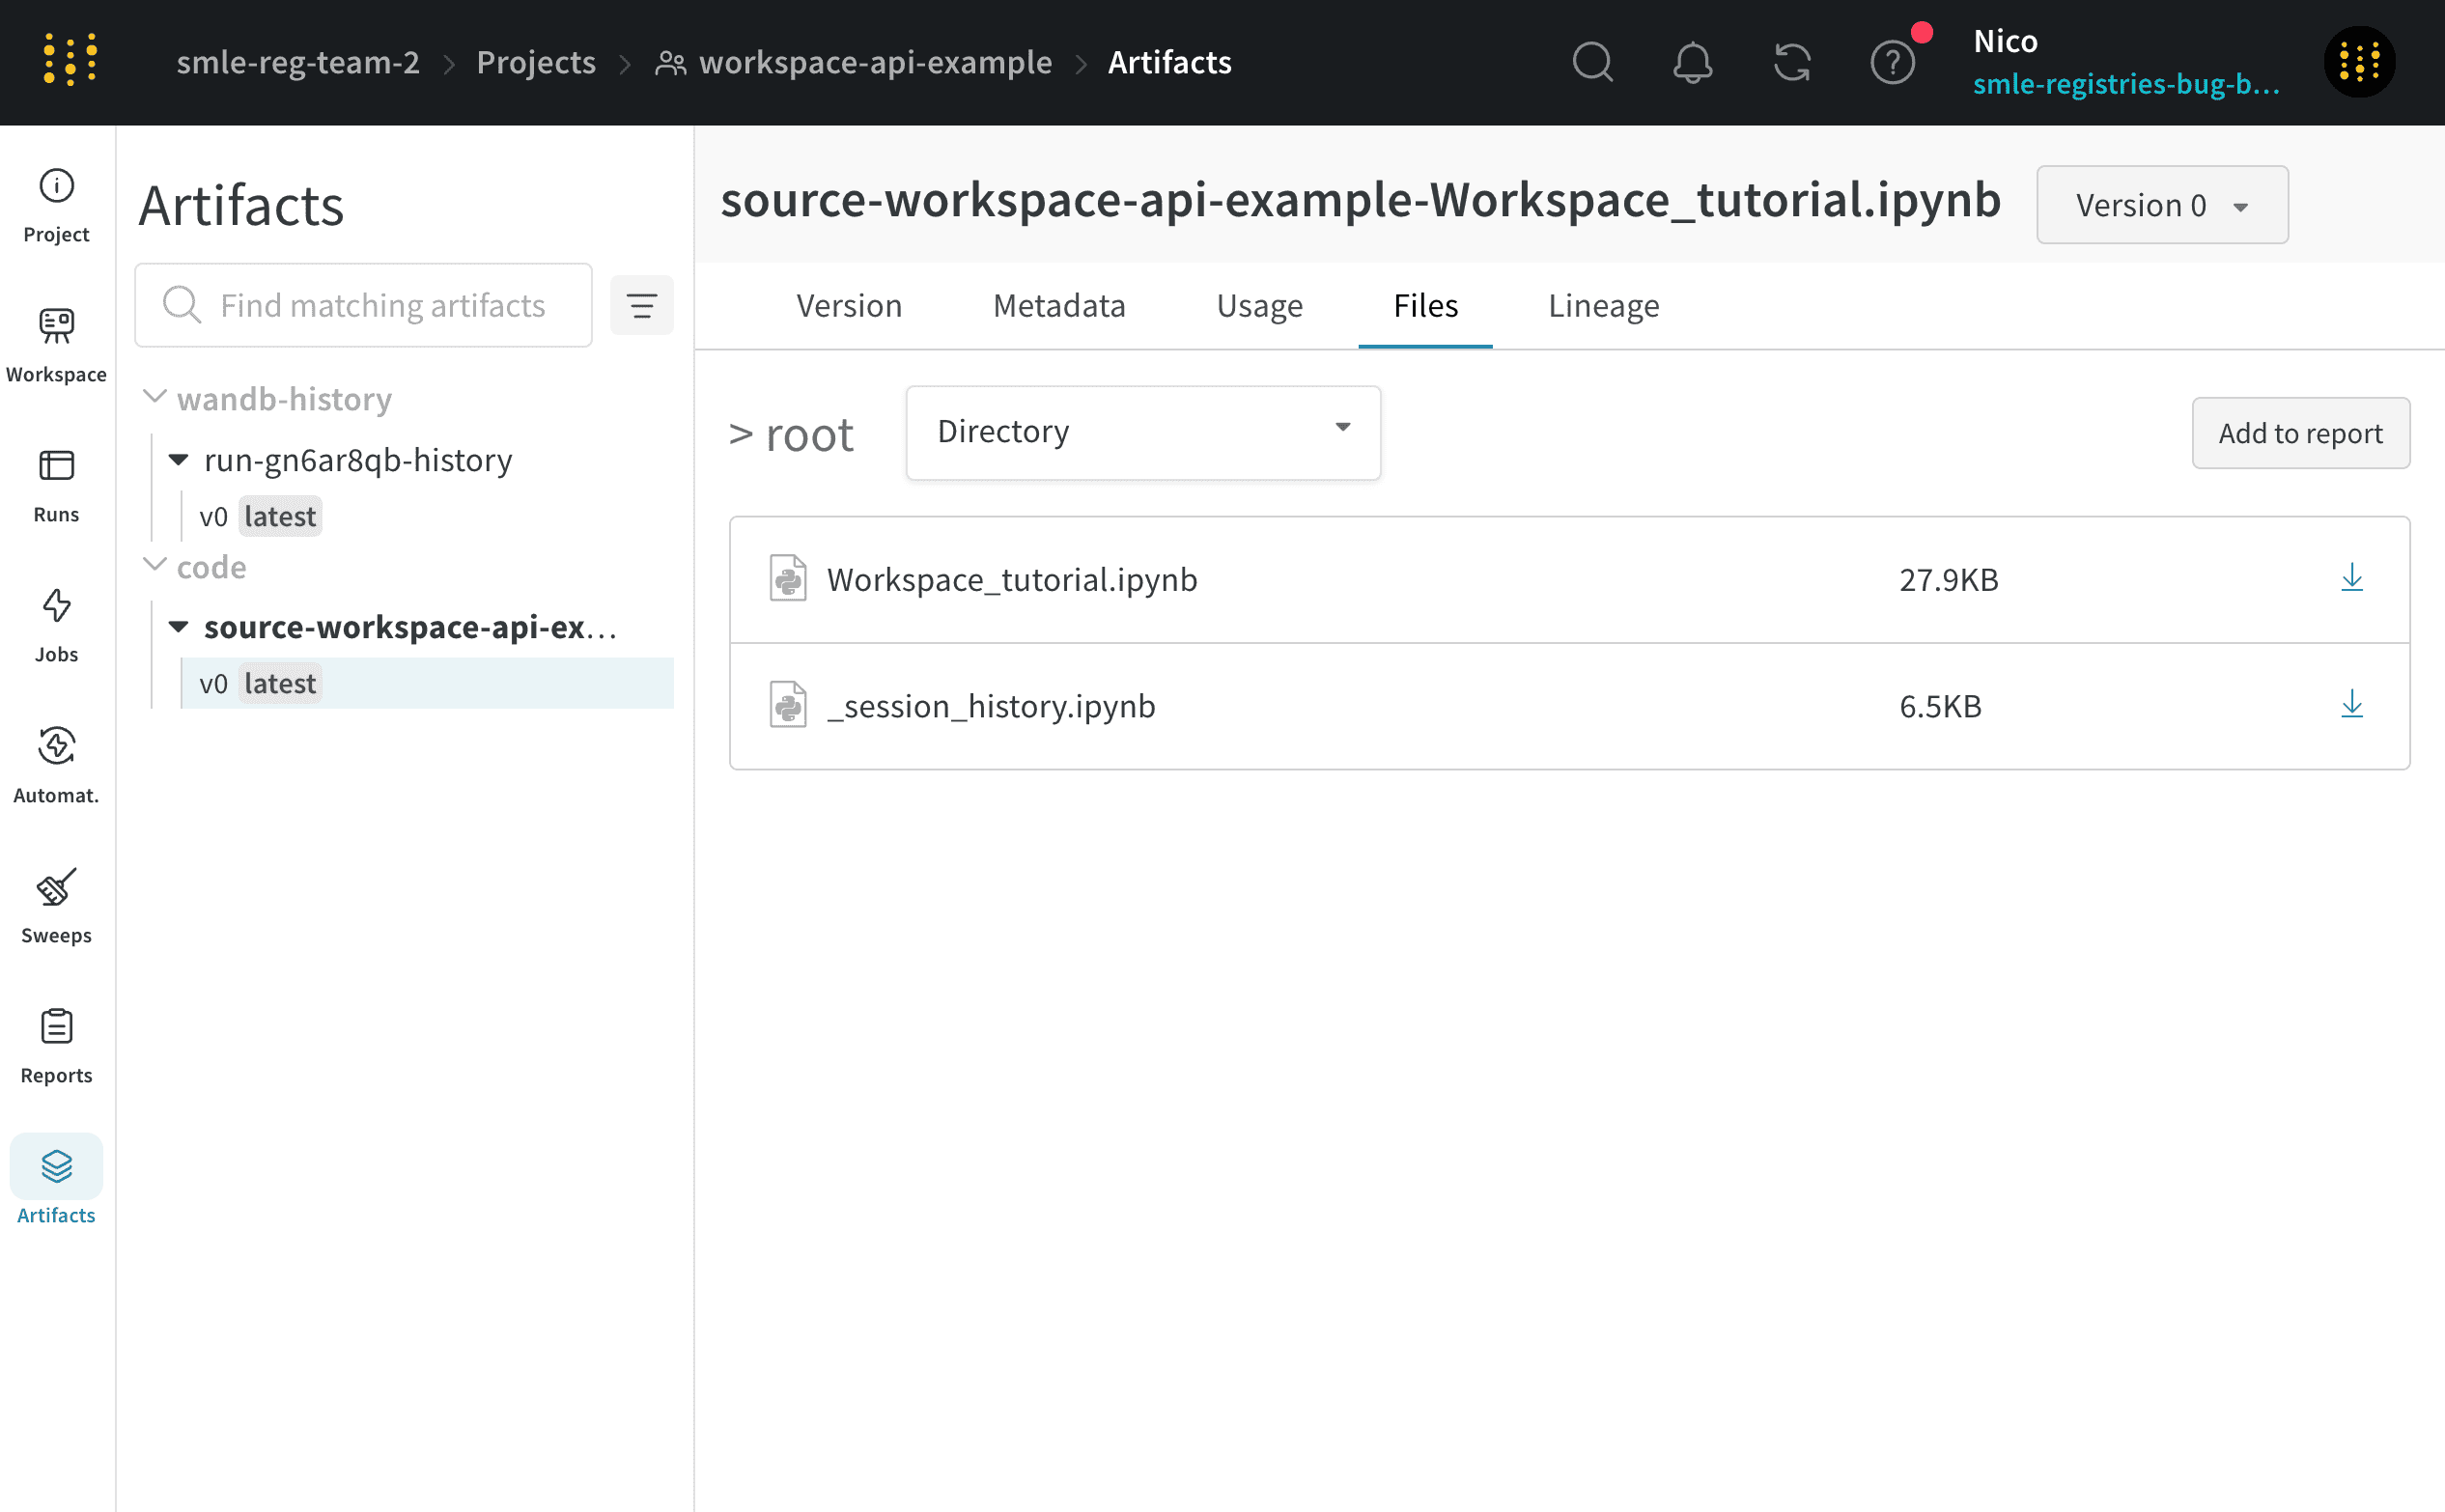 The files panel lists the files and folders associated with the artifact. W\&B uploads certain files for a run automatically. For example, `requirements.txt` shows the versions of each library the run used, and `wandb-metadata.json`, and `wandb-summary.json` include information about the run. Other files may be uploaded, such as artifacts or media, depending on the run's configuration.
To view files logged to an artifact:
1. Select the **Artifacts** tab from the project sidebar.
2. Select an artifact from the list to view the details page for the latest version of that artifact.
3. Select the **Files** tab to view all files associated with that artifact.
### Lineage panel
The files panel lists the files and folders associated with the artifact. W\&B uploads certain files for a run automatically. For example, `requirements.txt` shows the versions of each library the run used, and `wandb-metadata.json`, and `wandb-summary.json` include information about the run. Other files may be uploaded, such as artifacts or media, depending on the run's configuration.
To view files logged to an artifact:
1. Select the **Artifacts** tab from the project sidebar.
2. Select an artifact from the list to view the details page for the latest version of that artifact.
3. Select the **Files** tab to view all files associated with that artifact.
### Lineage panel
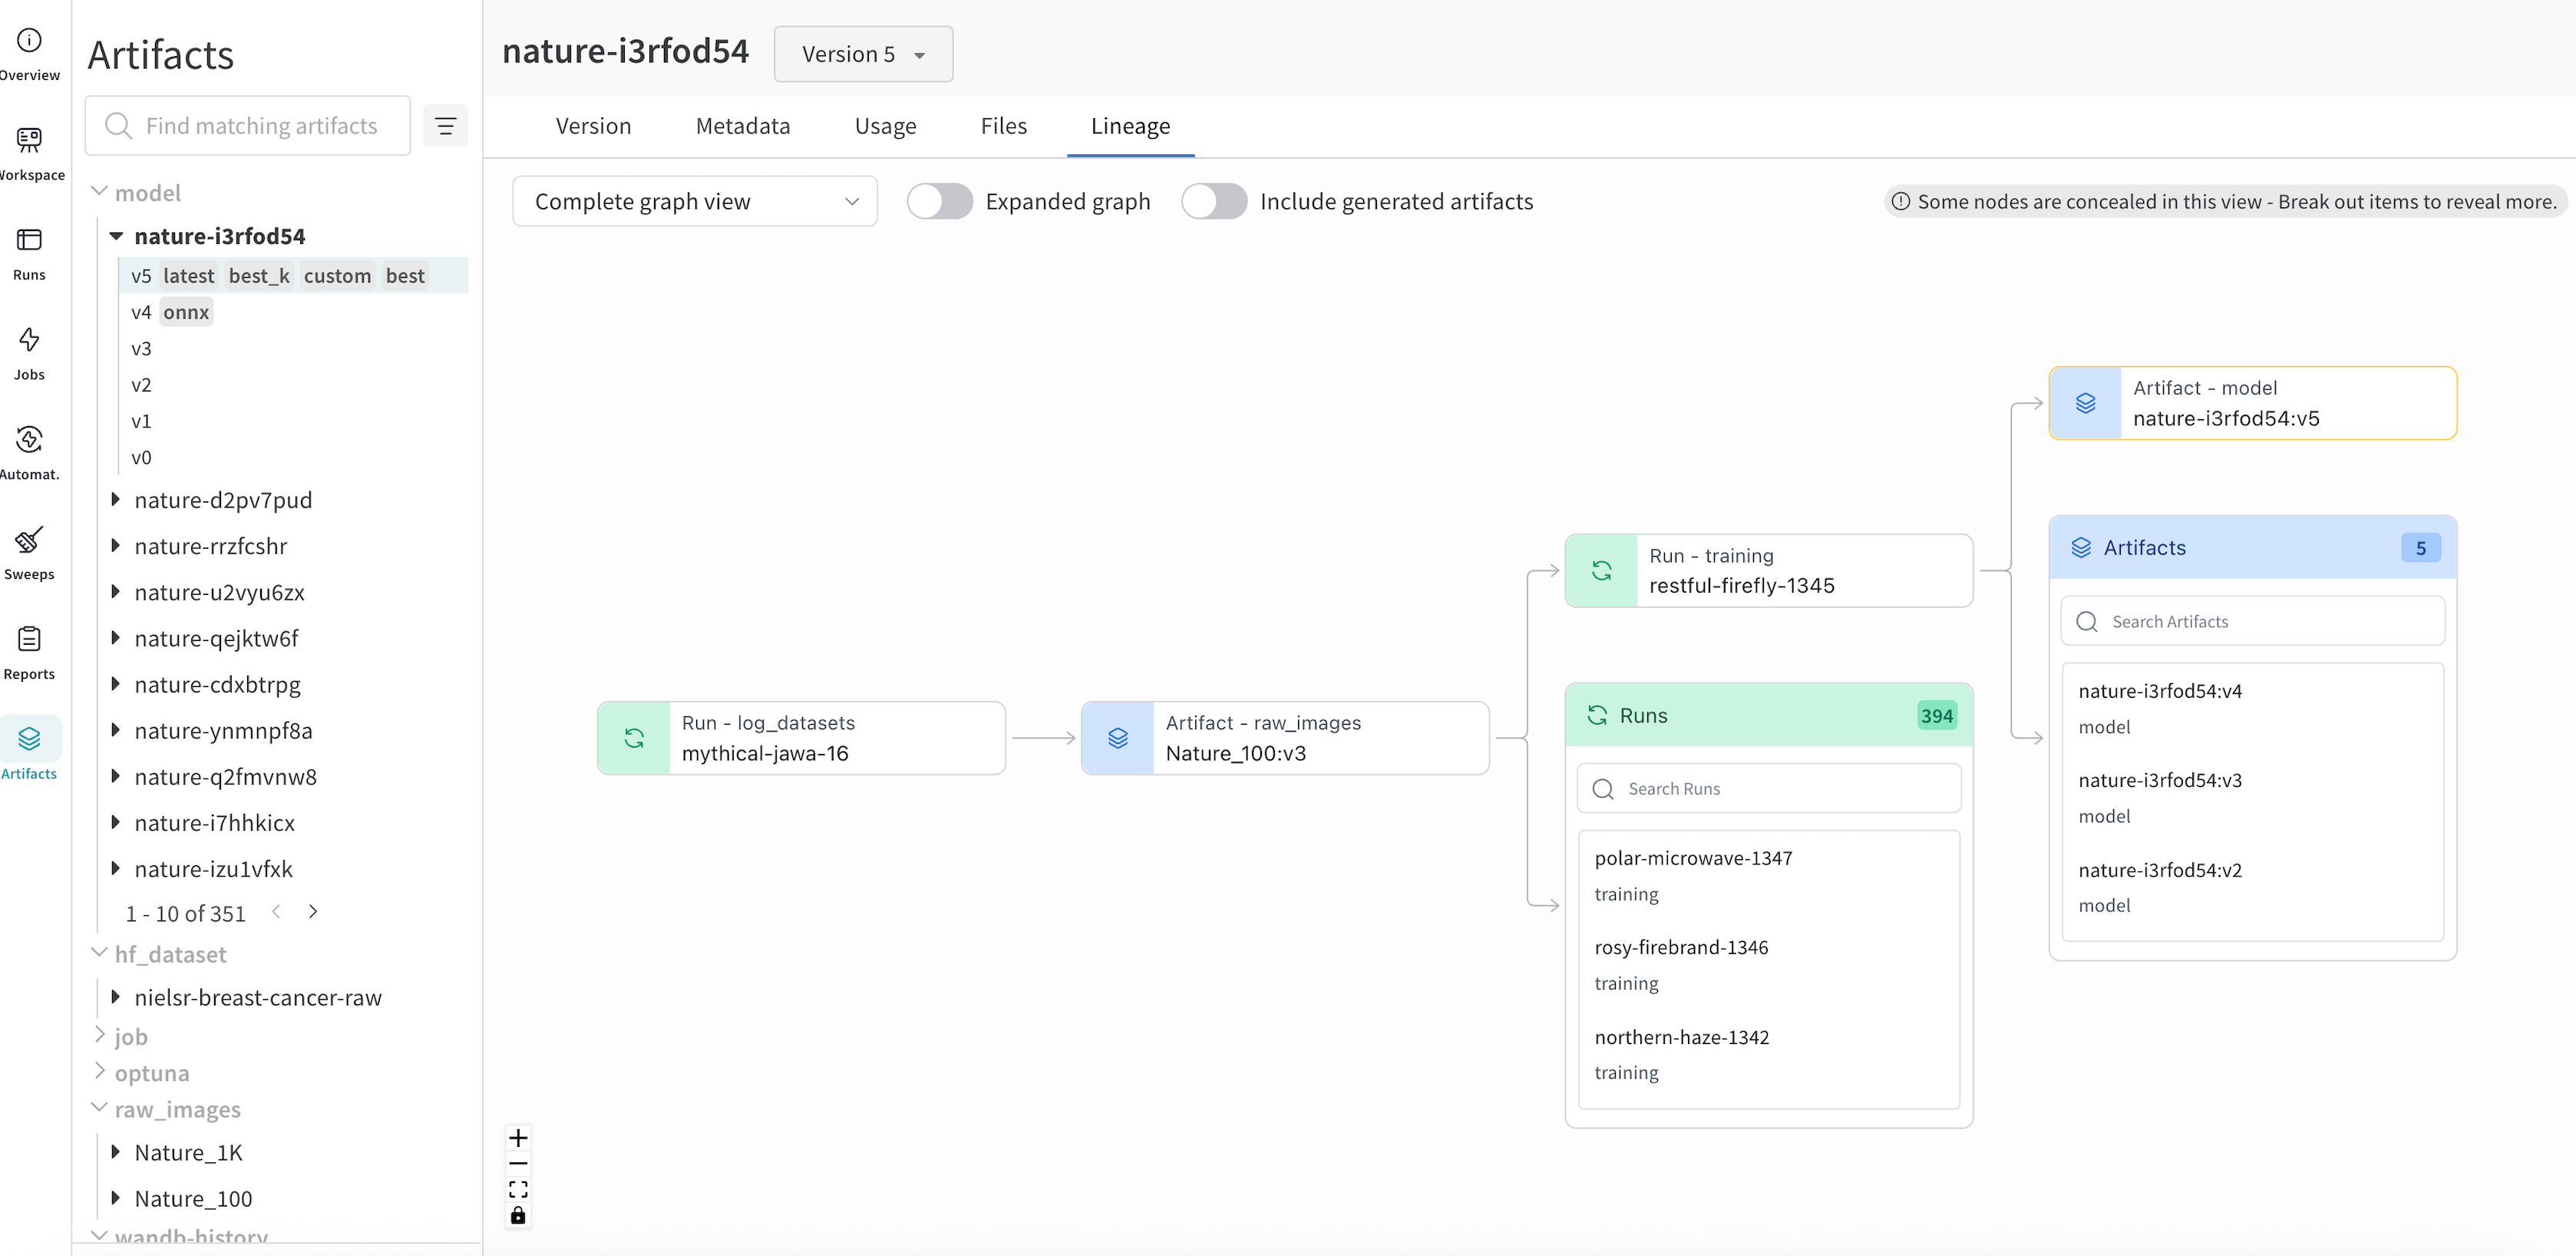 The lineage panel provides a view of all of the artifacts associated with a project and the runs that connect them to each other. It shows run types as blocks and artifacts as circles, with arrows to indicate when a run of a given type consumes or produces an artifact of a given type. The type of the particular artifact selected in the left-hand column is highlighted.
Click the Explode toggle to view all of the individual artifact versions and the specific runs that connect them.
### Versions tab
The lineage panel provides a view of all of the artifacts associated with a project and the runs that connect them to each other. It shows run types as blocks and artifacts as circles, with arrows to indicate when a run of a given type consumes or produces an artifact of a given type. The type of the particular artifact selected in the left-hand column is highlighted.
Click the Explode toggle to view all of the individual artifact versions and the specific runs that connect them.
### Versions tab
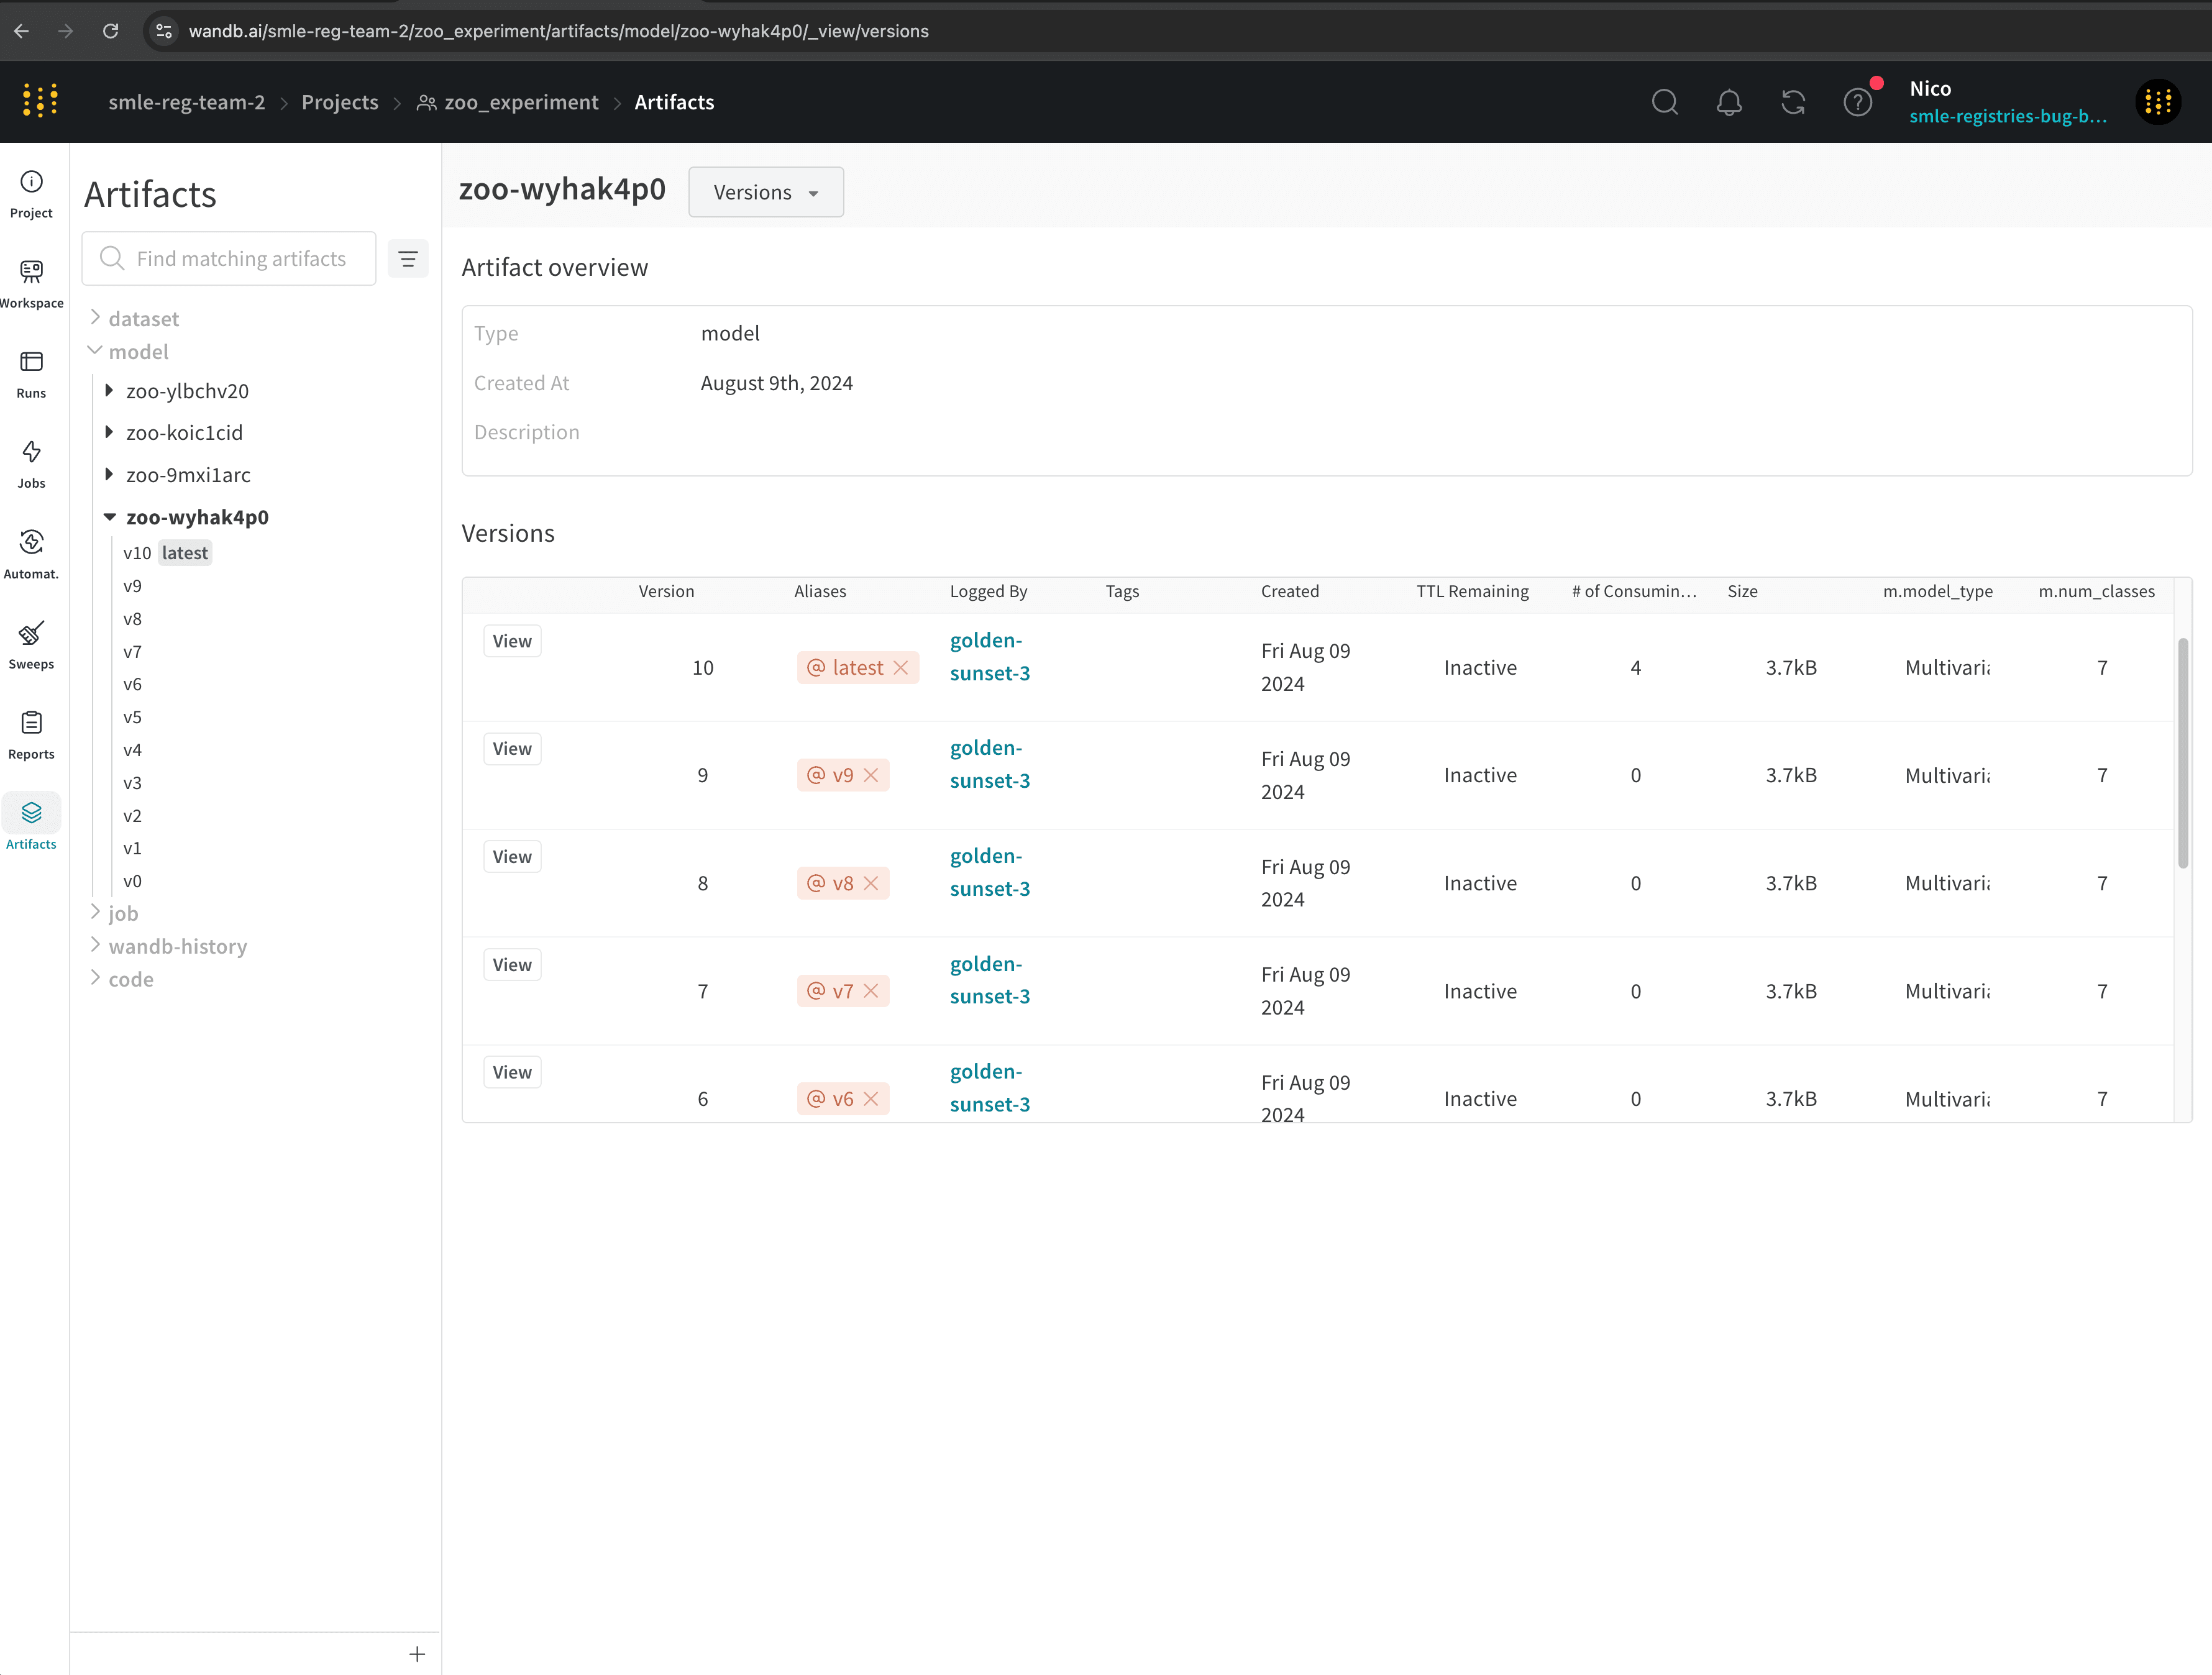 The versions tab shows all versions of the artifact. Select an artifact to view the details for that specific version.
1. Select the **Artifacts** tab from the project sidebar.
2. Select an artifact from the list to view the details page for the latest version of that artifact.
3. Select the **Versions** tab to view all versions of that artifact.
4. From the dropdown (next to the artifact name), select **All Versions**.
For example, the previous image shows different model artifact versions for a model artifact named `"zoo-wyhak4p0"`.
## Create a project
You can create a project in the W\&B App or programmatically by specifying a project in a call to `wandb.init()`.
In the W\&B App, you can create a project from the **Projects** page or from a team's landing page.
From the **Projects** page:
1. Click the global navigation icon in the upper left. The project sidebar opens.
2. In the **Projects** section of the navigation, click **View all** to open the project overview page.
3. Click **Create new project**.
4. Set **Team** to the name of the team that will own the project.
5. Specify a name for your project using the **Name** field.
6. Set **Project visibility**, which defaults to **Team**.
7. Optionally, provide a **Description**.
8. Click **Create project**.
From a team's landing page:
1. Click the global navigation icon in the upper left. The project sidebar opens.
2. In the **Teams** section of the navigation, click the name of a team to open its landing page.
3. In the landing page, click **Create new project**.
4. **Team** is automatically set to the team that owns the landing page you were viewing. If necessary, change the team.
5. Specify a name for your project using the **Name** field.
6. Set **Project visibility**, which defaults to **Team**.
7. Optionally, provide a **Description**.
8. Click **Create project**.
To create a project programmatically, specify a `project` when calling `wandb.init()`. If the project does not yet exist, it is created automatically, and is owned by the specified entity. For example:
```python theme={null}
import wandb with wandb.init(entity="", project="") as run: run.log({"accuracy": .95})
```
Refer to the [`wandb.init()` API reference](/models/ref/python/functions/init/#examples).
## Organization home and Recent Activity
In the W\&B App, the organization home page summarizes recent work.
The **Recent Activity** viewer shows recent runs. Choose **Your projects** to see your own runs, or **Organization** to see recent runs by your colleagues.
* **Search** to filter the activity list.
* **Sortable columns** let you reorder rows by the column you care about.
* **Notes** and **tags** columns display automatically if a run includes these details.
Below the **Recent Activity** viewer, quickly access your recently created reports.
## Star a project
Add a star to a project to mark that project as important.
Starred projects are grouped at the top of the **Projects** page. Quickly access up to 10 recent projects in the **Projects** list in the top-left **Global navigation menu**, with starred projects listed first.
There are two ways to mark a project as important: within a project's overview tab or within your team's profile page.
1. Navigate to your W\&B project on the W\&B App at `https://wandb.ai//`.
2. Select the **Overview** tab from the project sidebar.
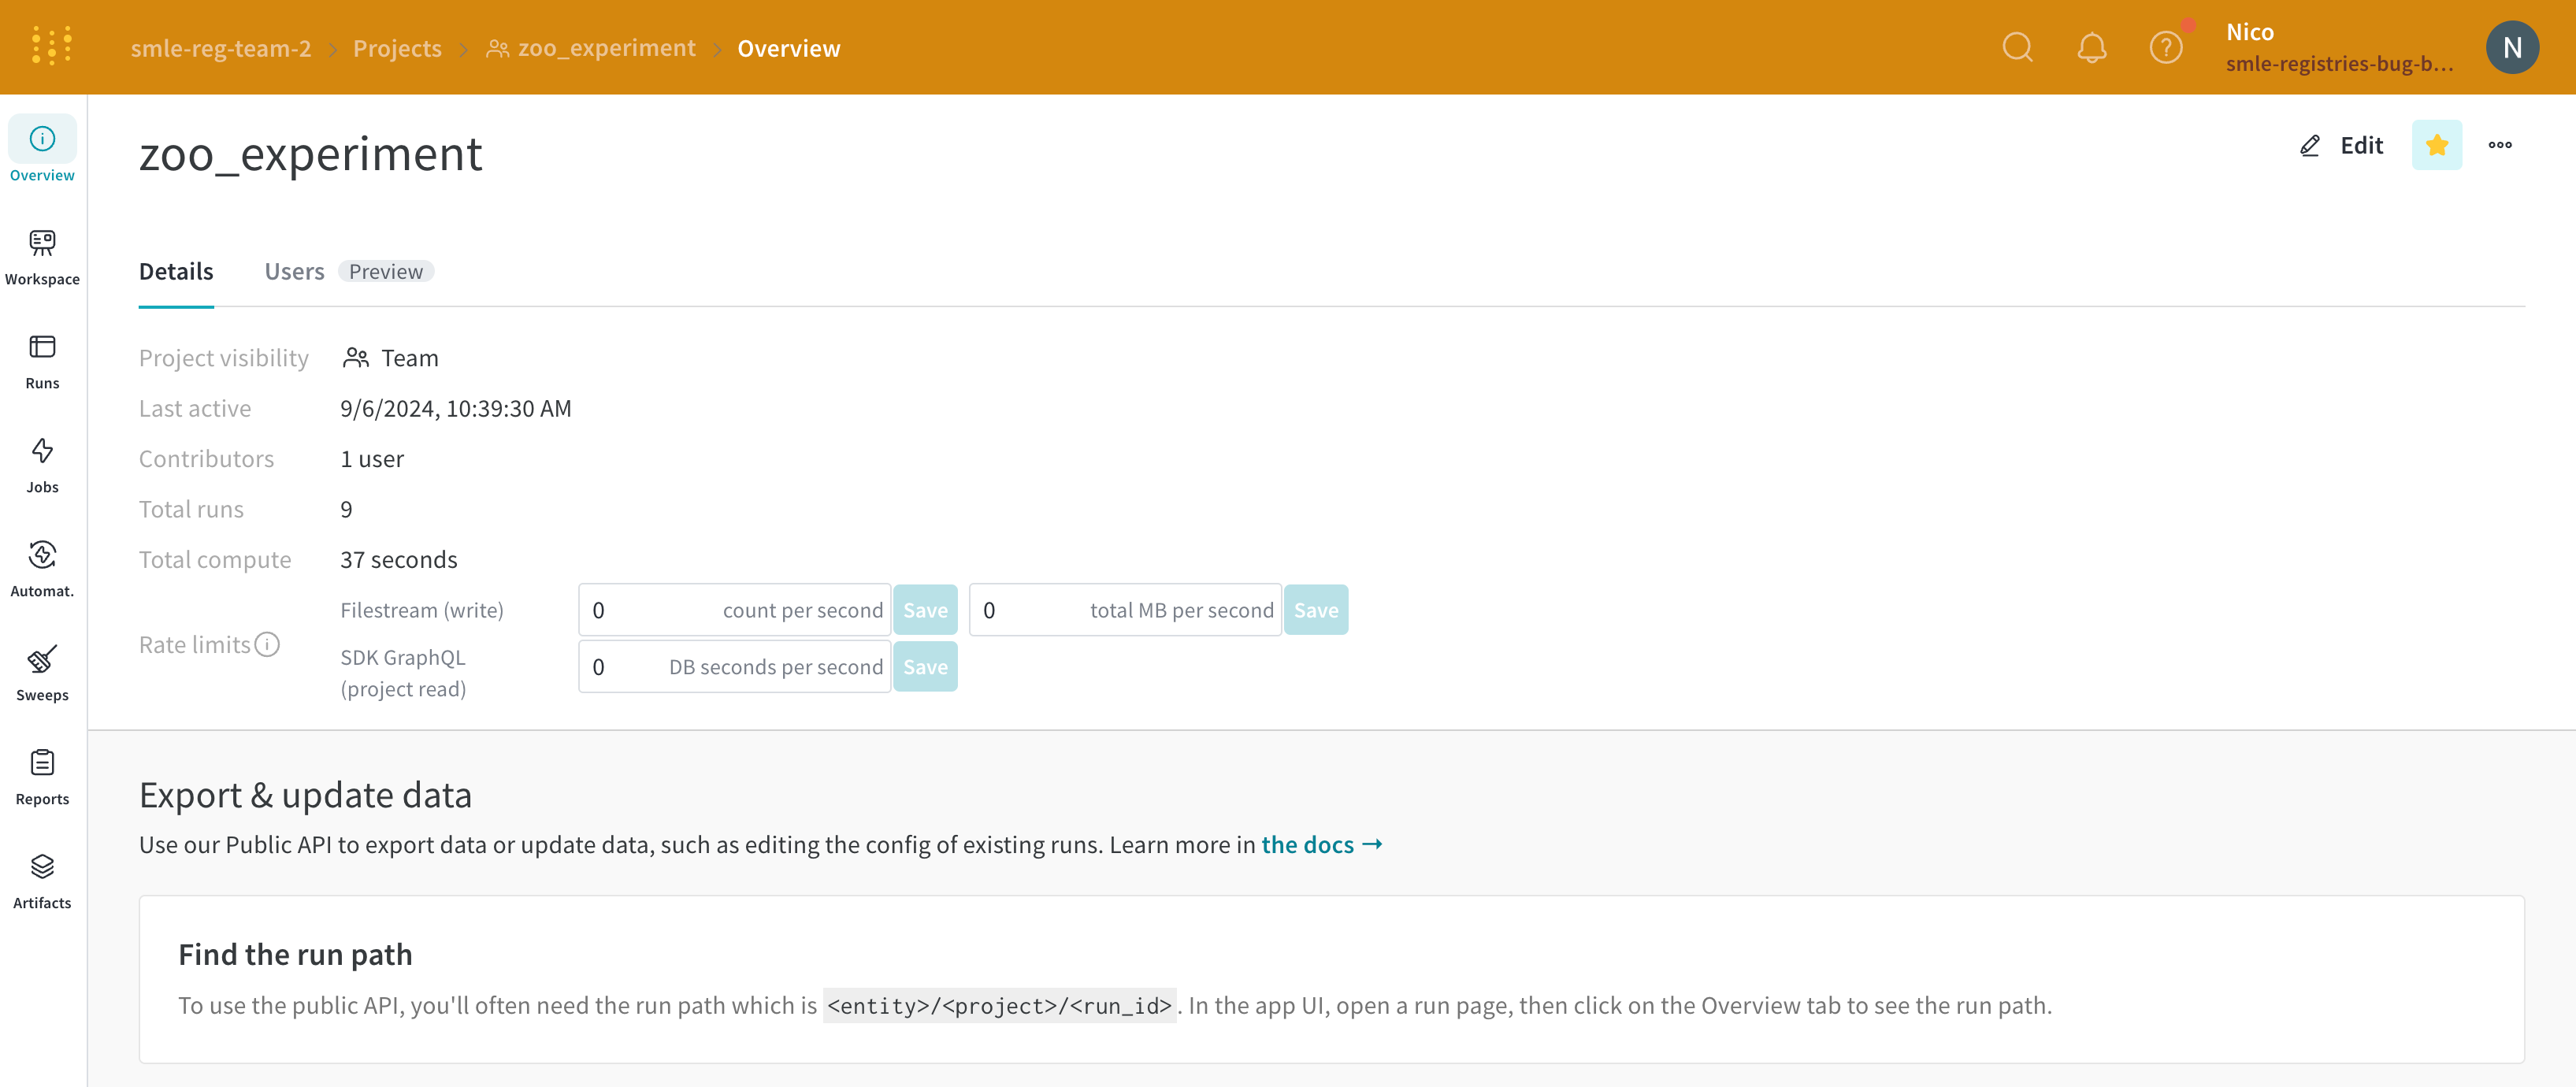
3. Click the star icon in the upper right corner next to the **Edit** button.
The versions tab shows all versions of the artifact. Select an artifact to view the details for that specific version.
1. Select the **Artifacts** tab from the project sidebar.
2. Select an artifact from the list to view the details page for the latest version of that artifact.
3. Select the **Versions** tab to view all versions of that artifact.
4. From the dropdown (next to the artifact name), select **All Versions**.
For example, the previous image shows different model artifact versions for a model artifact named `"zoo-wyhak4p0"`.
## Create a project
You can create a project in the W\&B App or programmatically by specifying a project in a call to `wandb.init()`.
In the W\&B App, you can create a project from the **Projects** page or from a team's landing page.
From the **Projects** page:
1. Click the global navigation icon in the upper left. The project sidebar opens.
2. In the **Projects** section of the navigation, click **View all** to open the project overview page.
3. Click **Create new project**.
4. Set **Team** to the name of the team that will own the project.
5. Specify a name for your project using the **Name** field.
6. Set **Project visibility**, which defaults to **Team**.
7. Optionally, provide a **Description**.
8. Click **Create project**.
From a team's landing page:
1. Click the global navigation icon in the upper left. The project sidebar opens.
2. In the **Teams** section of the navigation, click the name of a team to open its landing page.
3. In the landing page, click **Create new project**.
4. **Team** is automatically set to the team that owns the landing page you were viewing. If necessary, change the team.
5. Specify a name for your project using the **Name** field.
6. Set **Project visibility**, which defaults to **Team**.
7. Optionally, provide a **Description**.
8. Click **Create project**.
To create a project programmatically, specify a `project` when calling `wandb.init()`. If the project does not yet exist, it is created automatically, and is owned by the specified entity. For example:
```python theme={null}
import wandb with wandb.init(entity="", project="") as run: run.log({"accuracy": .95})
```
Refer to the [`wandb.init()` API reference](/models/ref/python/functions/init/#examples).
## Organization home and Recent Activity
In the W\&B App, the organization home page summarizes recent work.
The **Recent Activity** viewer shows recent runs. Choose **Your projects** to see your own runs, or **Organization** to see recent runs by your colleagues.
* **Search** to filter the activity list.
* **Sortable columns** let you reorder rows by the column you care about.
* **Notes** and **tags** columns display automatically if a run includes these details.
Below the **Recent Activity** viewer, quickly access your recently created reports.
## Star a project
Add a star to a project to mark that project as important.
Starred projects are grouped at the top of the **Projects** page. Quickly access up to 10 recent projects in the **Projects** list in the top-left **Global navigation menu**, with starred projects listed first.
There are two ways to mark a project as important: within a project's overview tab or within your team's profile page.
1. Navigate to your W\&B project on the W\&B App at `https://wandb.ai//`.
2. Select the **Overview** tab from the project sidebar.
3. Click the star icon in the upper right corner next to the **Edit** button.
 1. Navigate to your team's profile page at `https://wandb.ai//projects`.
2. Select the **Projects** tab.
3. Hover your mouse next to the project you want to star. Click on star icon that appears.
For example, the following image shows the star icon next to the "Compare\_Zoo\_Models" project.
1. Navigate to your team's profile page at `https://wandb.ai//projects`.
2. Select the **Projects** tab.
3. Hover your mouse next to the project you want to star. Click on star icon that appears.
For example, the following image shows the star icon next to the "Compare\_Zoo\_Models" project.
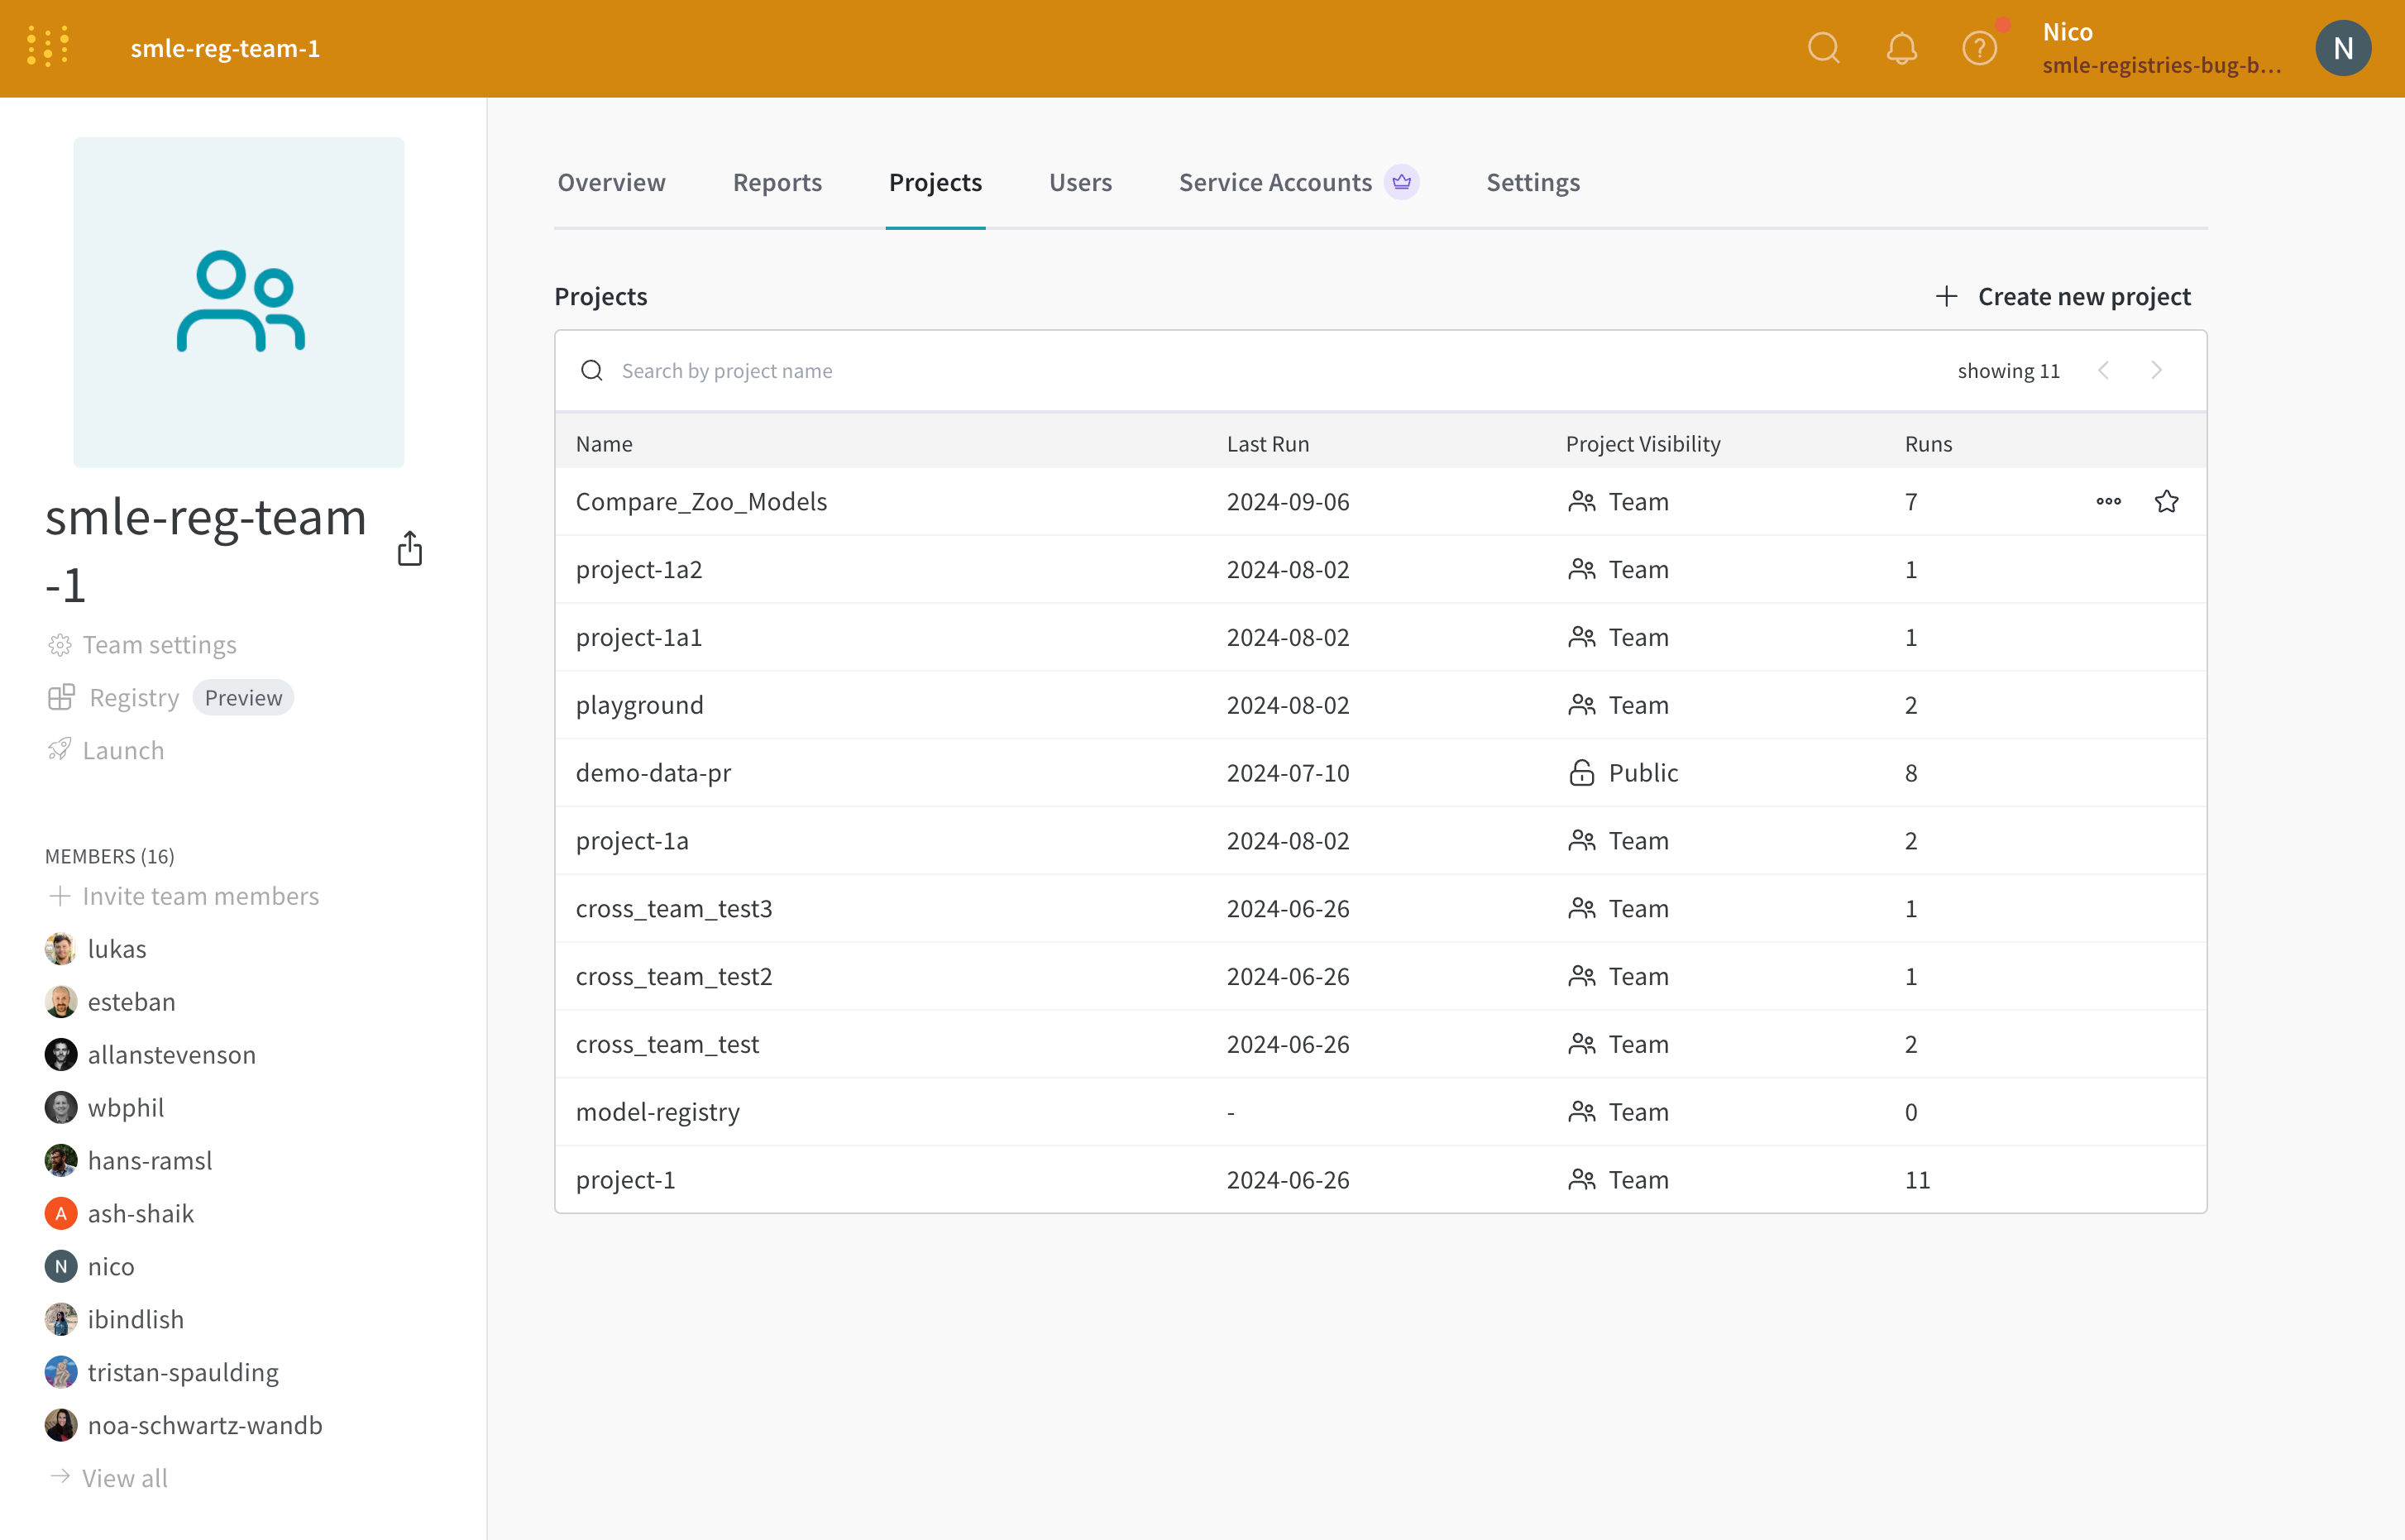 Confirm that your project is available.. In the **Project** section of the left navigation, click **View all** to open the **Project** page. Search or filter to find your project by its name, team, or other metadata. Starred projects appear at the top of the**Projects** page, and at the top of the **Projects** section of the left navigation.
## Delete a project
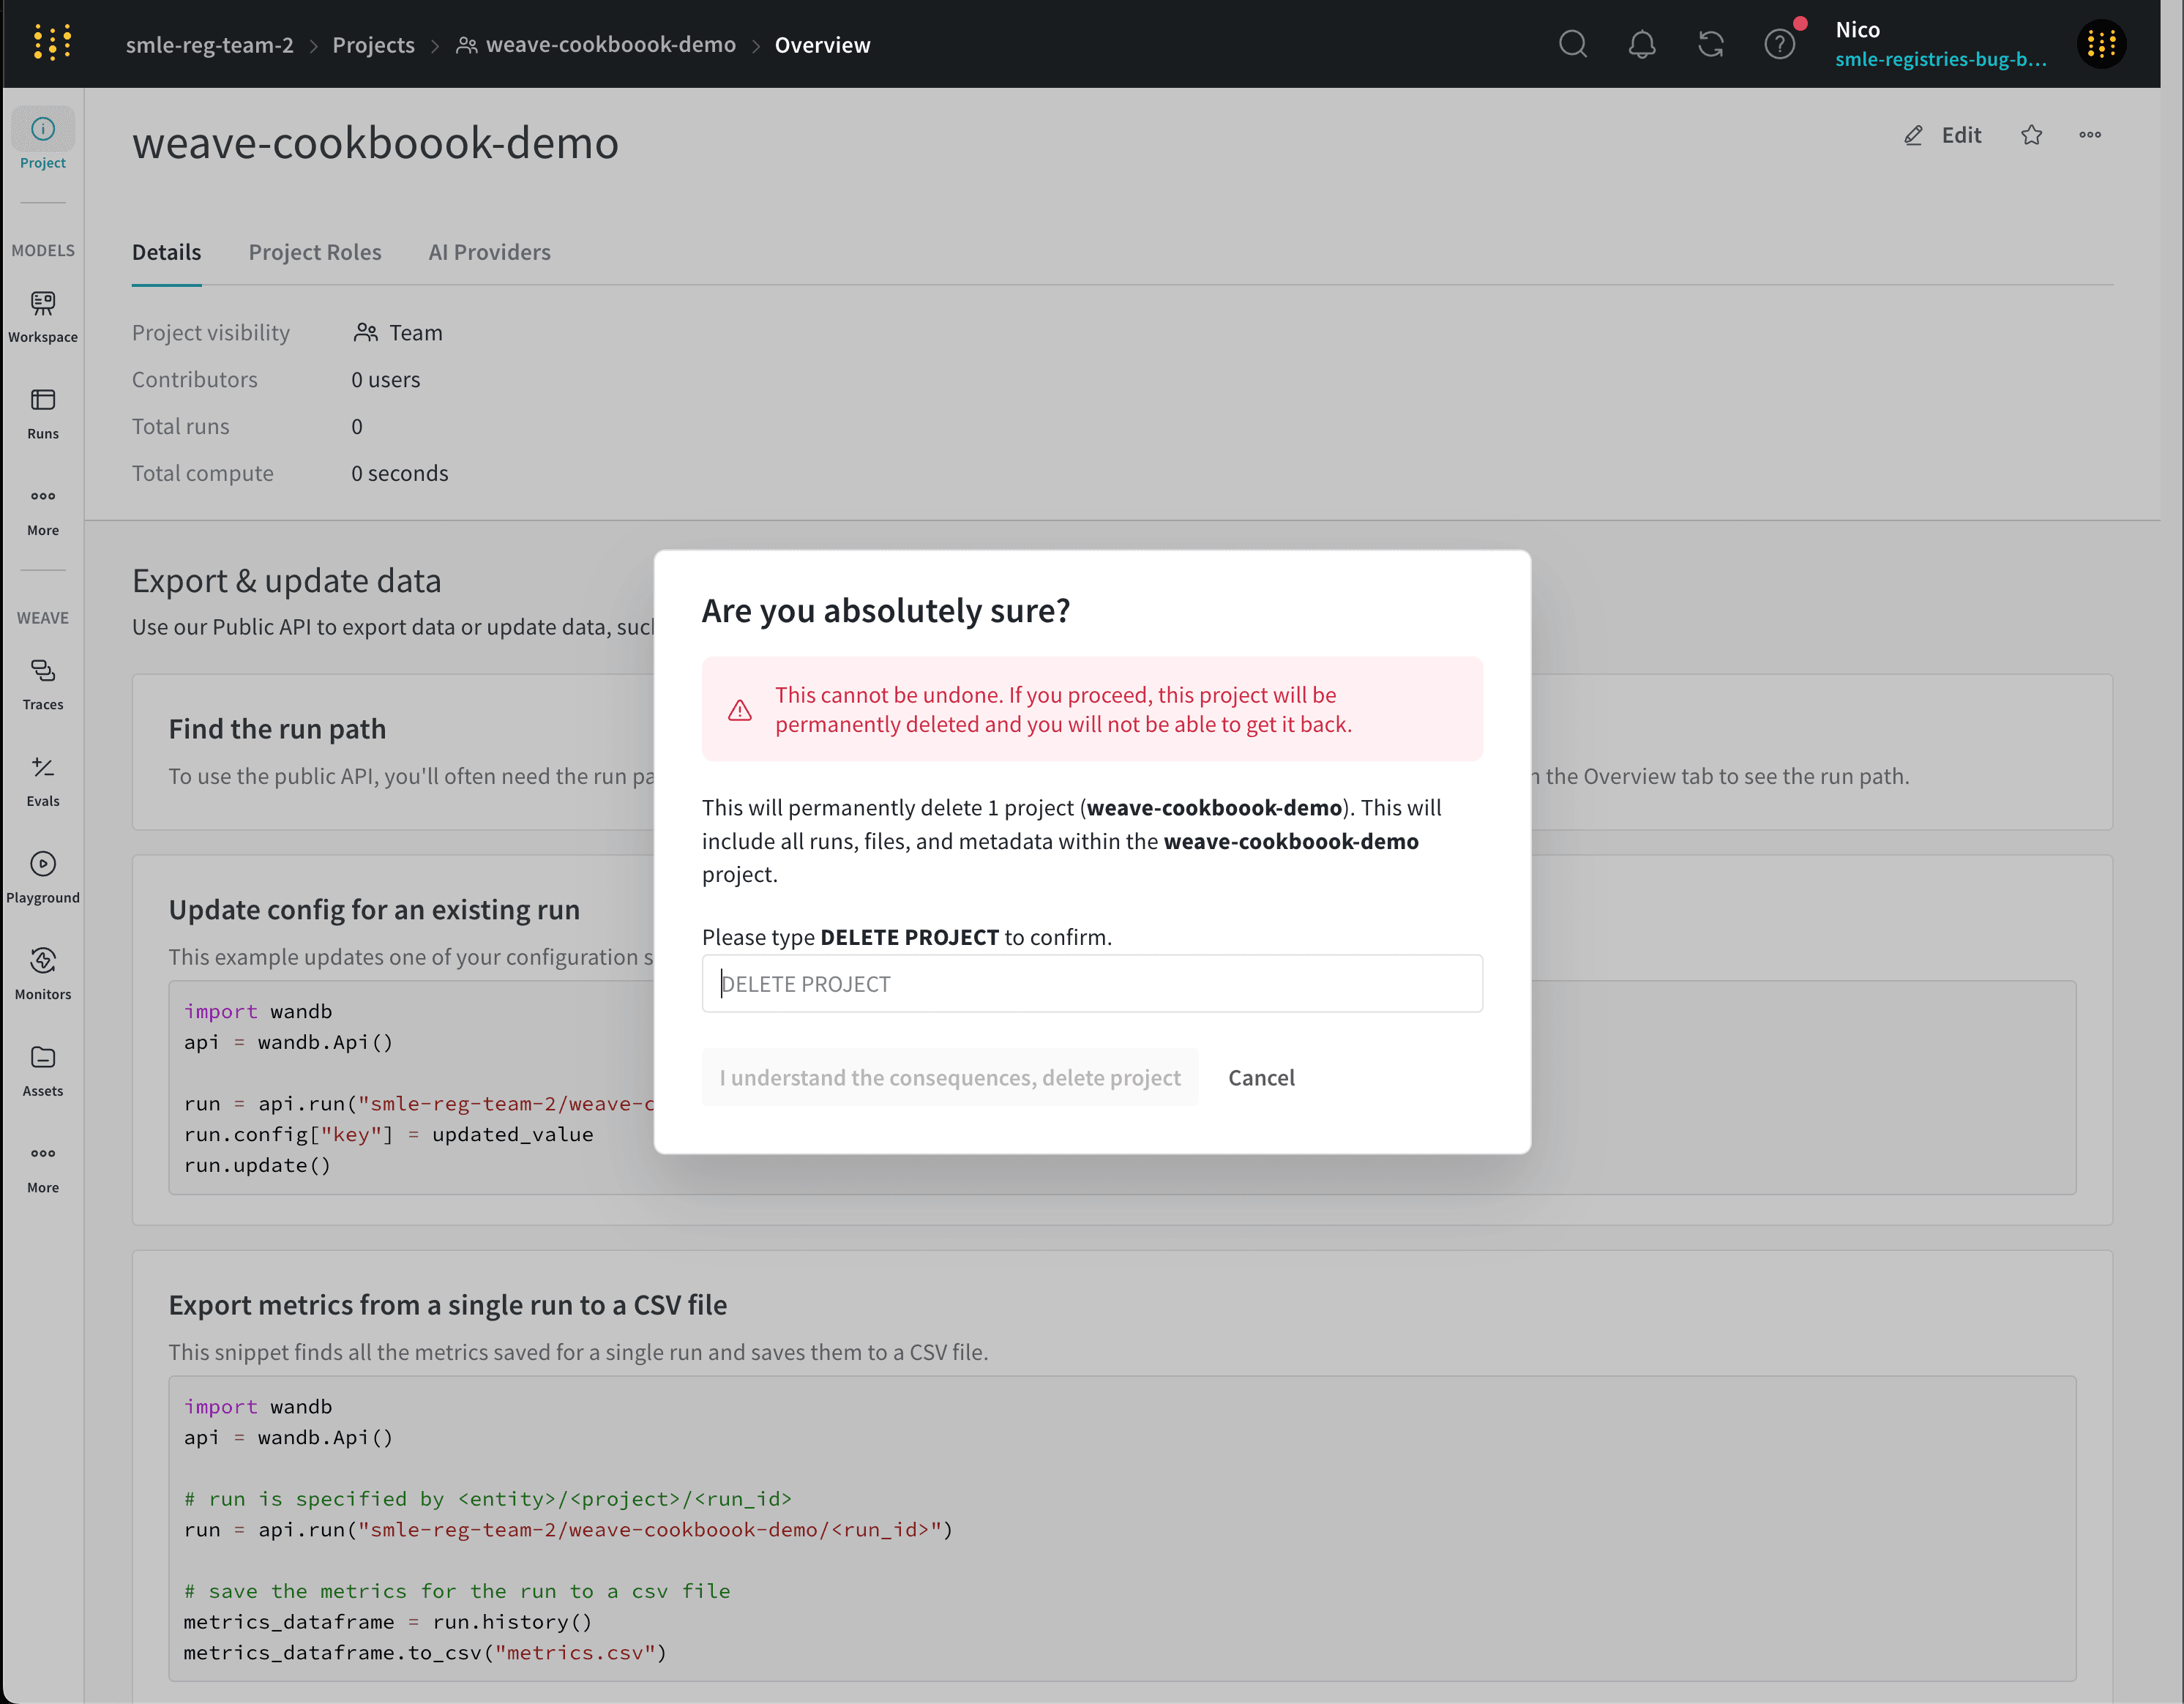
You can delete your project using the **action ()** menu on the right of the overview tab.
1. Navigate to your W\&B project
2. Select the **Overview** tab from the project sidebar.
3. Click the **action ()** menu in the upper right hand corner.
4. Select **Delete project** from the dropdown menu.
Confirm that your project is available.. In the **Project** section of the left navigation, click **View all** to open the **Project** page. Search or filter to find your project by its name, team, or other metadata. Starred projects appear at the top of the**Projects** page, and at the top of the **Projects** section of the left navigation.
## Delete a project
You can delete your project using the **action ()** menu on the right of the overview tab.
1. Navigate to your W\&B project
2. Select the **Overview** tab from the project sidebar.
3. Click the **action ()** menu in the upper right hand corner.
4. Select **Delete project** from the dropdown menu.
 W\&B does not terminate active [sweeps](/models/sweeps) or agents when you delete a project.
## Add notes to a project
Add notes to your project either as a description overview or as a markdown panel within your workspace.
### Add description overview to a project
Descriptions you add to your page appear in the **Overview** tab of your profile.
1. Navigate to your W\&B project
2. Select the **Overview** tab from the project sidebar
3. Click **Edit** in the upper right hand corner
4. Add your notes in the **Description** field
5. Select the **Save** button
**Create reports to create descriptive notes comparing runs**
You can also create a W\&B Report to add plots and markdown side by side. Use different sections to show different runs, and tell a story about what you worked on.
### Add notes to run workspace
1. Navigate to your W\&B project
2. Select the **Workspace** tab from the project sidebar
3. Click the **Add panels** button from the top right corner
4. Select the **TEXT AND CODE** dropdown from the modal that appears
5. Select **Markdown**
6. Add your notes in the markdown panel that appears in your workspace
W\&B does not terminate active [sweeps](/models/sweeps) or agents when you delete a project.
## Add notes to a project
Add notes to your project either as a description overview or as a markdown panel within your workspace.
### Add description overview to a project
Descriptions you add to your page appear in the **Overview** tab of your profile.
1. Navigate to your W\&B project
2. Select the **Overview** tab from the project sidebar
3. Click **Edit** in the upper right hand corner
4. Add your notes in the **Description** field
5. Select the **Save** button
**Create reports to create descriptive notes comparing runs**
You can also create a W\&B Report to add plots and markdown side by side. Use different sections to show different runs, and tell a story about what you worked on.
### Add notes to run workspace
1. Navigate to your W\&B project
2. Select the **Workspace** tab from the project sidebar
3. Click the **Add panels** button from the top right corner
4. Select the **TEXT AND CODE** dropdown from the modal that appears
5. Select **Markdown**
6. Add your notes in the markdown panel that appears in your workspace