> ## Documentation Index
> Fetch the complete documentation index at: https://docs.wandb.ai/llms.txt
> Use this file to discover all available pages before exploring further.
# Compare and rank models
> Compare and rank different model versions based on evaluation metrics
Use Weave Leaderboards to evaluate and compare multiple models across multiple metrics and measure accuracy, generation quality, latency, or custom evaluation logic. A leaderboard helps you visualize model performance in a central location, track changes over time, and align on team-wide benchmarks.
This guide shows you how to create, configure, and publish a leaderboard so your team can compare model versions against shared benchmarks.
Leaderboards are ideal for:
* Tracking model performance regressions.
* Coordinating shared evaluation workflows.
Leaderboard creation is only available for the Weave UI and Weave Python SDK. TypeScript users can create and manage leaderboards using the [Weave UI](#use-the-ui).
## Create a leaderboard
You can create a leaderboard through the [Weave UI](#use-the-ui) or [programmatically](#use-the-python-sdk). Choose the UI approach for ad-hoc comparisons, or the Python SDK to integrate leaderboard creation into automated evaluation workflows.
### Use the UI
Use the Weave UI to create and customize leaderboards interactively. Follow these steps:
1. In the Weave UI, navigate to the **Leaders** section. If it's not visible, click **More** → **Leaders**.
2. Click **+ New Leaderboard**.
3. In the **Leaderboard Title** field, enter a descriptive name (for example, `summarization-benchmark-v1`).
4. Optionally, add a description to explain what this leaderboard compares.
5. [Add columns](#add-columns) to define which evaluations and metrics to display.
6. When the layout is ready, save and publish your leaderboard to share it with others.
#### Add columns
Columns define what your leaderboard displays for each model. Each column in a leaderboard represents a metric from a specific evaluation. To configure a column, you specify:
* **Evaluation**: Select an evaluation run from the dropdown (must be previously created).
* **Scorer**: Choose a scoring function (for example, `jaccard_similarity` or `simple_accuracy`) used in that evaluation.
* **Metric**: Choose a summary metric to display (for example, `mean` or `true_fraction`).
To add more columns, click **Add Column**.
To edit a column, click the action () menu on the right. You can:
* **Move before or after**. Reorder columns.
* **Duplicate**. Copy the column definition.
* **Delete**. Remove the column.
* **Sort ascending**. Set the default sort for the leaderboard (click again to toggle descending).
### Use the Python SDK
Use the Python SDK to define, publish, and retrieve leaderboards in code. This approach lets you version leaderboards alongside your evaluation code and run them as part of an automated workflow.
Looking for a complete, runnable code sample? See the [End-to-end Python example](#end-to-end-python-example).
To create and publish a leaderboard:
1. Define a test dataset. You can use the built-in [`Dataset`](./datasets), or define a list of inputs and targets manually:
```python lines theme={null}
dataset = [
{"input": "...", "target": "..."},
...
]
```
2. Define one or more [scorers](../evaluation/scorers):
```python lines theme={null}
@weave.op
def jaccard_similarity(target: str, output: str) -> float:
...
```
3. Create an [`Evaluation`](../core-types/evaluations):
```python lines theme={null}
evaluation = weave.Evaluation(
name="My Eval",
dataset=dataset,
scorers=[jaccard_similarity],
)
```
4. Define models to be evaluated:
```python lines theme={null}
@weave.op
def my_model(input: str) -> str:
...
```
5. Run the evaluation:
```python lines theme={null}
async def run_all():
await evaluation.evaluate(model_vanilla)
await evaluation.evaluate(model_humanlike)
await evaluation.evaluate(model_messy)
asyncio.run(run_all())
```
6. Create the leaderboard:
```python lines theme={null}
spec = leaderboard.Leaderboard(
name="My Leaderboard",
description="Evaluating models on X task",
columns=[
leaderboard.LeaderboardColumn(
evaluation_object_ref=get_ref(evaluation).uri(),
scorer_name="jaccard_similarity",
summary_metric_path="mean",
)
]
)
```
7. Publish the leaderboard.
```python lines theme={null}
weave.publish(spec)
```
8. Retrieve the results:
```python lines theme={null}
results = leaderboard.get_leaderboard_results(spec, client)
print(results)
```
After publishing, your leaderboard is available in the Weave UI under the **Leaders** tab, where your team can view and compare model performance.
## End-to-end Python example
The following example uses Weave Evaluations and creates a leaderboard to compare three summarization models on a shared dataset using a custom metric. It creates a small benchmark, evaluates each model, scores each model with [Jaccard similarity](https://www.learndatasci.com/glossary/jaccard-similarity/), and publishes the results to a Weave leaderboard.
```python lines theme={null}
import weave
from weave.flow import leaderboard
from weave.trace.ref_util import get_ref
import asyncio
client = weave.init("leaderboard-demo")
dataset = [
{
"input": "Weave is a tool for building interactive LLM apps. It offers observability, trace inspection, and versioning.",
"target": "Weave helps developers build and observe LLM applications."
},
{
"input": "The OpenAI GPT-4o model can process text, audio, and vision inputs, making it a multimodal powerhouse.",
"target": "GPT-4o is a multimodal model for text, audio, and images."
},
{
"input": "The W&B team recently added native support for agents and evaluations in Weave.",
"target": "W&B added agents and evals to Weave."
}
]
@weave.op
def jaccard_similarity(target: str, output: str) -> float:
target_tokens = set(target.lower().split())
output_tokens = set(output.lower().split())
intersection = len(target_tokens & output_tokens)
union = len(target_tokens | output_tokens)
return intersection / union if union else 0.0
evaluation = weave.Evaluation(
name="Summarization Quality",
dataset=dataset,
scorers=[jaccard_similarity],
)
@weave.op
def model_vanilla(input: str) -> str:
return input[:50]
@weave.op
def model_humanlike(input: str) -> str:
if "Weave" in input:
return "Weave helps developers build and observe LLM applications."
elif "GPT-4o" in input:
return "GPT-4o supports text, audio, and vision input."
else:
return "W&B added agent support to Weave."
@weave.op
def model_messy(input: str) -> str:
return "Summarizer summarize models model input text LLMs."
async def run_all():
await evaluation.evaluate(model_vanilla)
await evaluation.evaluate(model_humanlike)
await evaluation.evaluate(model_messy)
asyncio.run(run_all())
spec = leaderboard.Leaderboard(
name="Summarization Model Comparison",
description="Evaluate summarizer models using Jaccard similarity on three short samples.",
columns=[
leaderboard.LeaderboardColumn(
evaluation_object_ref=get_ref(evaluation).uri(),
scorer_name="jaccard_similarity",
summary_metric_path="mean",
)
]
)
weave.publish(spec)
results = leaderboard.get_leaderboard_results(spec, client)
print(results)
```
### View and interpret the leaderboard
After the script publishes the leaderboard, use the Weave UI to inspect the results and compare model performance side by side:
1. In the Weave UI, go to the **Leaders** tab. If it's not visible, click **More**, then select **Leaders**.
2. Click the name of your leaderboard, for example `Summarization Model Comparison`.
In the leaderboard table, each row represents a given model (`model_humanlike`, `model_vanilla`, `model_messy`). The `mean` column shows the average Jaccard similarity between the model's output and the reference summaries.
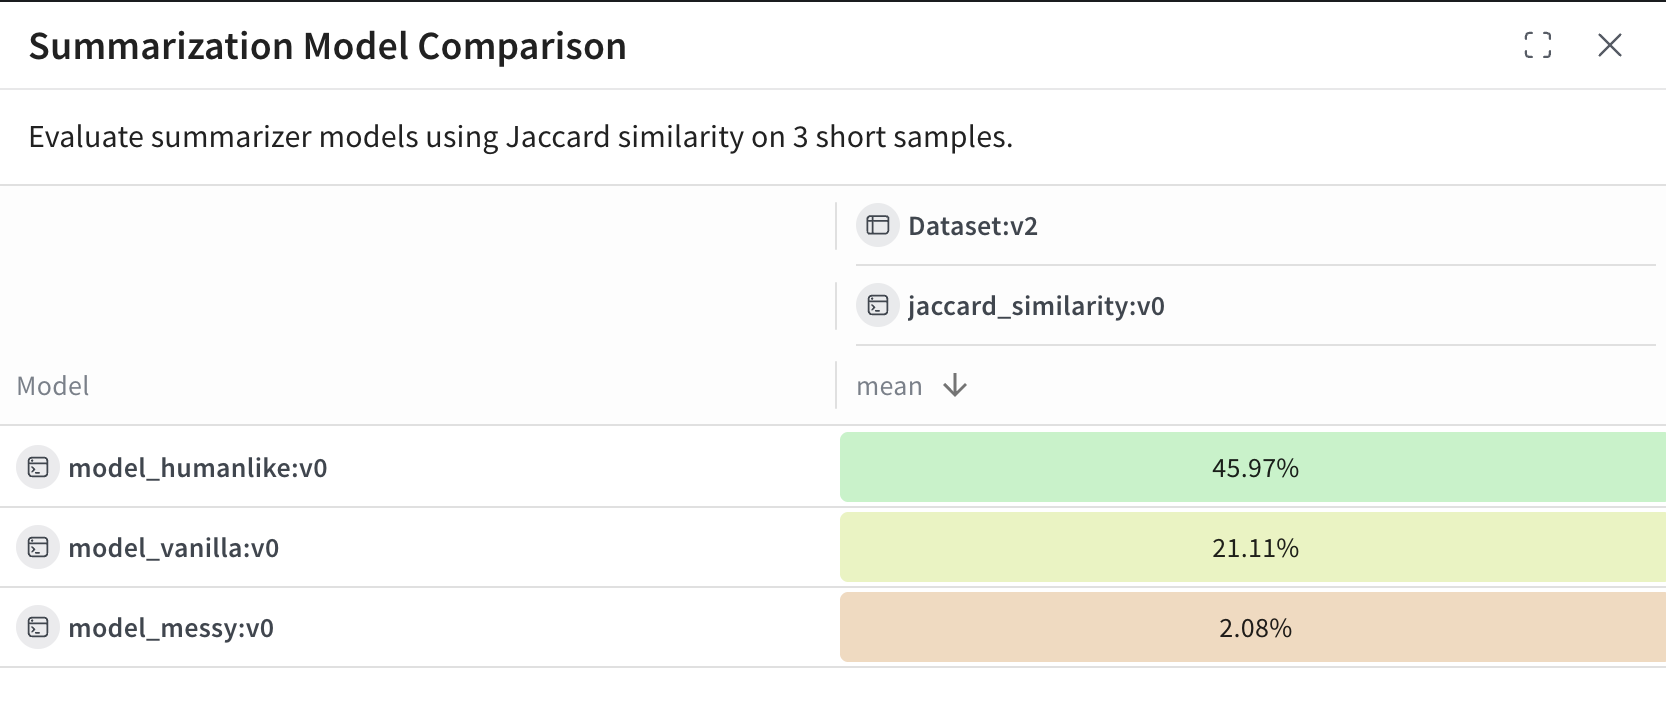 For this example:
* `model_humanlike` performs the best, with approximately 46 percent overlap.
* `model_vanilla` (a naive truncation) gets approximately 21 percent.
* `model_messy`, an intentionally bad model, scores approximately 2 percent.
For this example:
* `model_humanlike` performs the best, with approximately 46 percent overlap.
* `model_vanilla` (a naive truncation) gets approximately 21 percent.
* `model_messy`, an intentionally bad model, scores approximately 2 percent.