> ## Documentation Index
> Fetch the complete documentation index at: https://docs.wandb.ai/llms.txt
> Use this file to discover all available pages before exploring further.
# Create dynamic Leaderboards in Evaluations
> Dynamic Leaderboards let you configure, customize, save, and update Leaderboard views directly from an evaluation.
When working with Weave Evaluations, you can visualize and customize your experiment results as Leaderboards.
Saved Leaderboard views are dynamic:
* As new evaluation runs are added
* And as results match the saved filters
The Leaderboard automatically updates to include them, without requiring manual reconfiguration.
This lets you use views as persistent leaderboards that evolve alongside your experiments.
## Visualize Evaluation results in a Leaderboard
When your project contains Weave Evaluation data, you can use the evaluation table to quickly create a Weave Leaderboard view based on a filtered subset of results.
To create a Weave Leaderboard:
1. Navigate to [wandb.ai](https://wandb.ai).
2. In the Weave sidebar menu, click **Evaluations**.
3. Apply filters to the evaluation table to narrow the data to the models, datasets, or runs you want to compare.
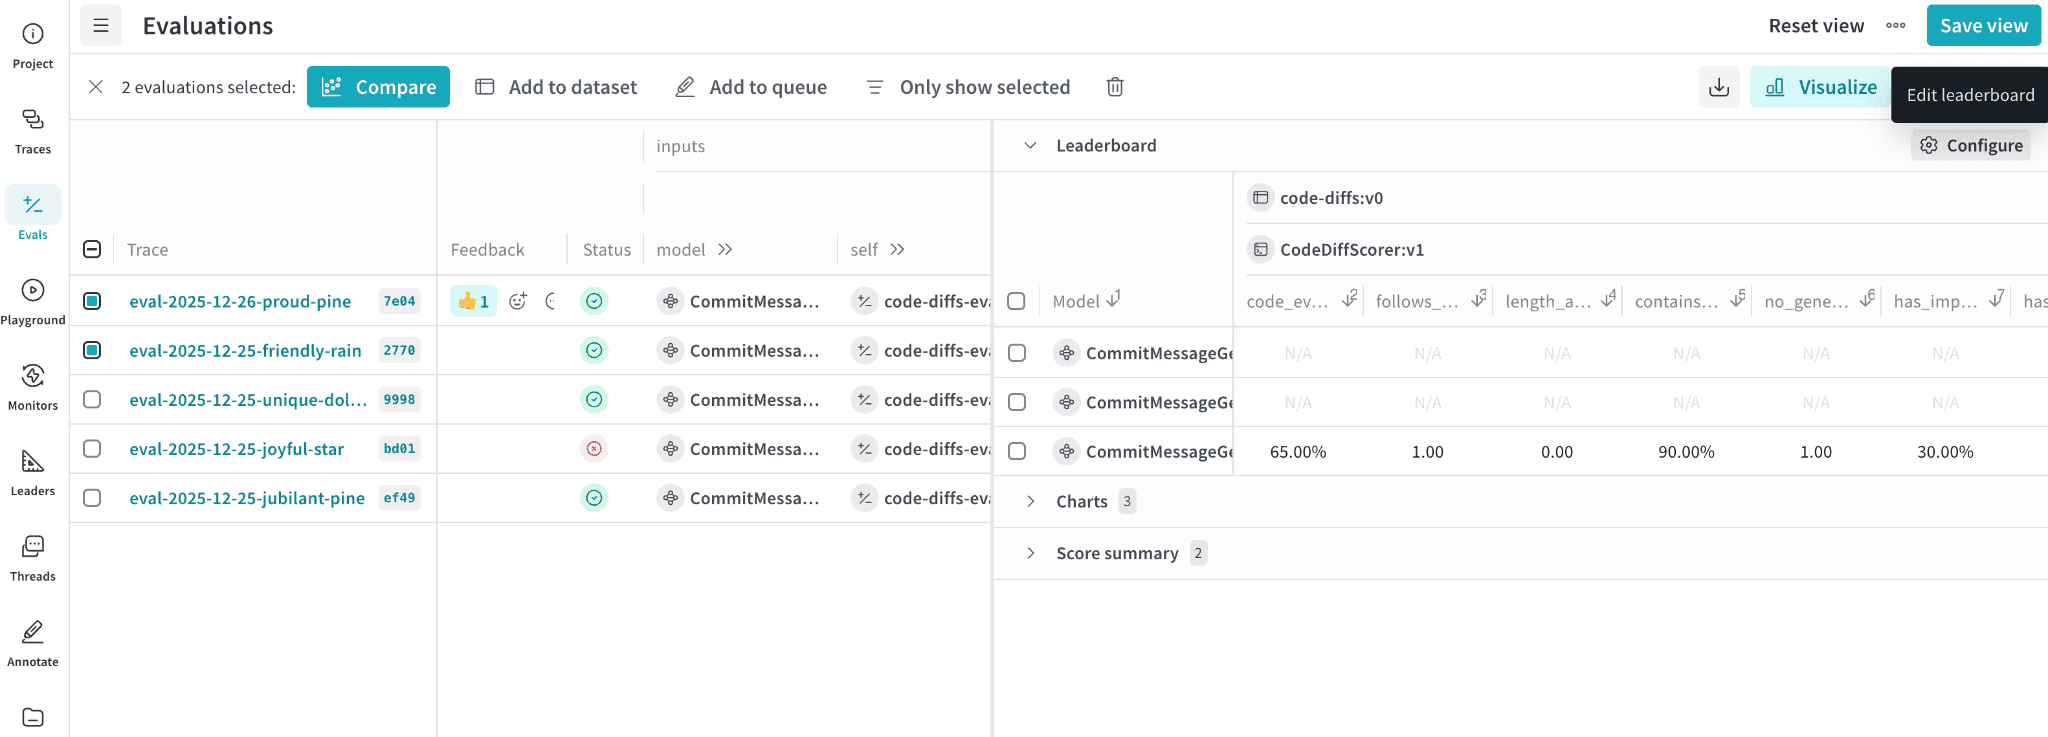
4. In the **evaluation table toolbar**, click **Visualize**.
Weave automatically creates a Leaderboard panel using only the data currently filtered in the table.
5. In the Leaderboard panel header, click **Configure** to open the **Edit Leaderboard** panel.\
The **Edit Leaderboard** panel gives you fine-grained control over how models, datasets, scorers, and metrics appear.
The following shows how a filtered evaluation table is visualized as a Leaderboard and where to configure the resulting Leaderboard.
 ### Configure Leaderboard elements with visibility and custom names
The following shows the **Edit Leaderboard** panel with four configuration tabs: Models, Datasets, Scorers, and Metrics.
### Configure Leaderboard elements with visibility and custom names
The following shows the **Edit Leaderboard** panel with four configuration tabs: Models, Datasets, Scorers, and Metrics.
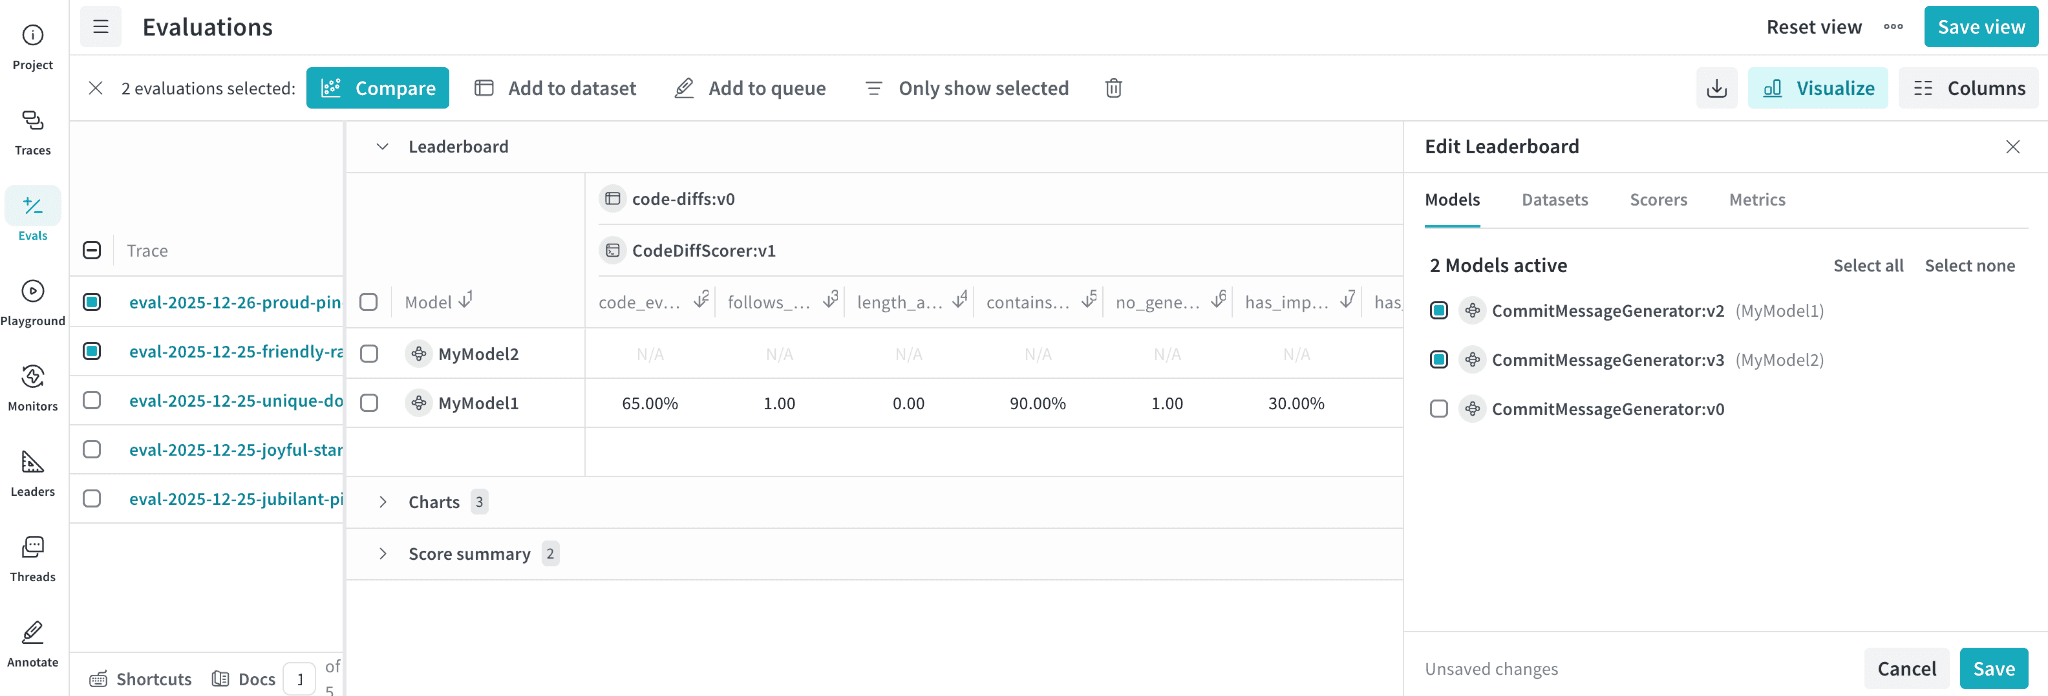 In the **Edit Leaderboard** panel, you can:
* **Activate/deactivate display**\
Select which models, datasets, scorers, and metrics appear in the Leaderboard by checking or unchecking them.
* **Rename models, datasets, and scorers**\
Assign display-friendly names (for example, renaming a model run to `GPT-4` or a dataset to `JokesV1`).
Renamed items:
* Update immediately in the Leaderboard
* Remain clickable so you can still open the underlying reference in the side panel
* Automatically propagate anywhere the Leaderboard view is used
This makes it easier to compare experiments using meaningful, human-readable names without changing the underlying objects.
### Configure Leaderboard metric behavior and coloring
In the **Edit Leaderboard** panel, for each metric, you can specify whether:
* **Higher values are better**, or
* **Lower values are better**
This setting directly affects Leaderboard coloring:
* Green highlights the *better* value.
* Red highlights the *worse* value.
* Colors automatically invert when you switch between “higher is better” and “lower is better”.
This ensures that visual cues remain accurate across different types of metrics (for example, accuracy vs. latency or error rate).
## Save and reuse Leaderboard views
In the **Edit Leaderboard** panel, you can save your customized Leaderboard as a reusable view by clicking **Save**.
The saved Leaderboard view captures:
* Selected models, datasets, scorers, and metrics
* Renamed display labels
* Metric direction settings (higher or lower is better)
* Applied filters
### Switch between saved views
Click the **menu ()** button next to the Evaluations page title to open saved views. You can:
* Return to the **default** view to see the full dataset.
* Reopen a saved view to restore all customizations instantly.
When you reopen a saved view, all renames and metric settings are preserved.
In the **Edit Leaderboard** panel, you can:
* **Activate/deactivate display**\
Select which models, datasets, scorers, and metrics appear in the Leaderboard by checking or unchecking them.
* **Rename models, datasets, and scorers**\
Assign display-friendly names (for example, renaming a model run to `GPT-4` or a dataset to `JokesV1`).
Renamed items:
* Update immediately in the Leaderboard
* Remain clickable so you can still open the underlying reference in the side panel
* Automatically propagate anywhere the Leaderboard view is used
This makes it easier to compare experiments using meaningful, human-readable names without changing the underlying objects.
### Configure Leaderboard metric behavior and coloring
In the **Edit Leaderboard** panel, for each metric, you can specify whether:
* **Higher values are better**, or
* **Lower values are better**
This setting directly affects Leaderboard coloring:
* Green highlights the *better* value.
* Red highlights the *worse* value.
* Colors automatically invert when you switch between “higher is better” and “lower is better”.
This ensures that visual cues remain accurate across different types of metrics (for example, accuracy vs. latency or error rate).
## Save and reuse Leaderboard views
In the **Edit Leaderboard** panel, you can save your customized Leaderboard as a reusable view by clicking **Save**.
The saved Leaderboard view captures:
* Selected models, datasets, scorers, and metrics
* Renamed display labels
* Metric direction settings (higher or lower is better)
* Applied filters
### Switch between saved views
Click the **menu ()** button next to the Evaluations page title to open saved views. You can:
* Return to the **default** view to see the full dataset.
* Reopen a saved view to restore all customizations instantly.
When you reopen a saved view, all renames and metric settings are preserved.