> ## Documentation Index
> Fetch the complete documentation index at: https://docs.wandb.ai/llms.txt
> Use this file to discover all available pages before exploring further.
# Query and export Calls
> Filter, sort, and export Weave call data using the Python SDK, REST API, or the Weave UI for custom analysis.
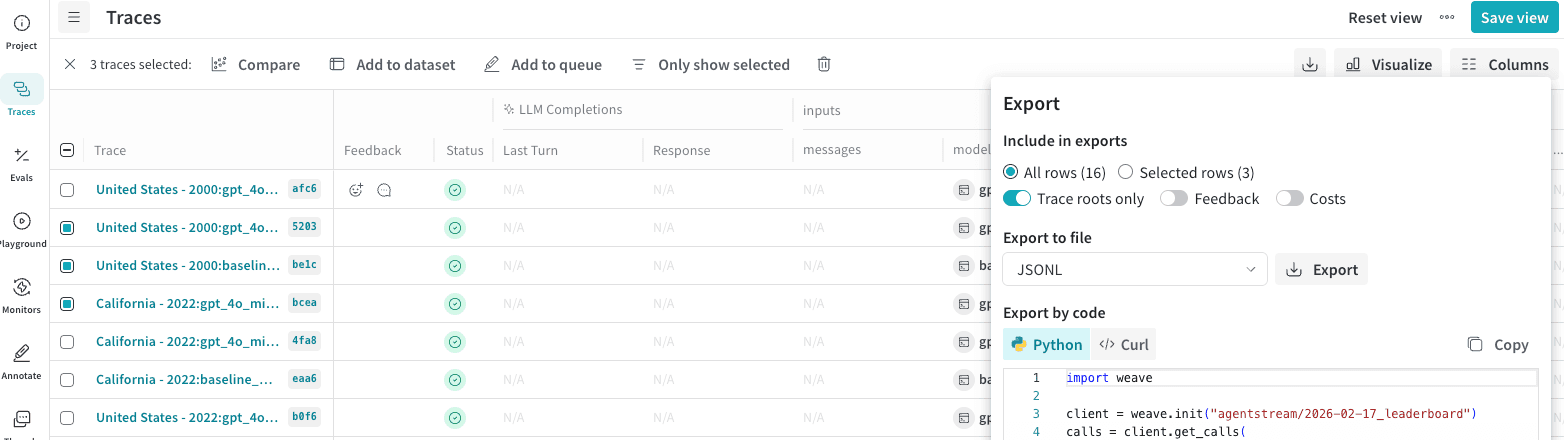
In the Weave UI, you can export your data in multiple formats. It also shows the Python and cURL code that you can use to export the rows programatically.
To export Calls:
1. Navigate to [wandb.ai](https://wandb.ai/) and select your project.
2. In the Weave project sidebar, click **Traces**.
3. Select multiple Calls that you want to export by checking the row.
4. In the **Traces** table toolbar, click the export/download button.
5. In the **Export** modal, choose **Selected rows** or **All rows**. Click Export.
 ## Fetch calls programmatically
To fetch calls using the Python API, you can use the [`client.get_calls`](/weave/reference/python-sdk/trace/weave_client#method-get_calls) method:
```python lines theme={null}
import weave
# Initialize the client
client = weave.init("your-project-name")
# Fetch calls
calls = client.get_calls(filter=...)
```
To fetch calls using the TypeScript API, you can use the [`client.getCalls`](/weave/reference/typescript-sdk/classes/weaveclient#getcalls) method.
```typescript lines theme={null}
import * as weave from 'weave'
// Initialize the client
const client = await weave.init('intro-example')
// Fetch calls
const calls = await client.getCalls(filter=...)
```
The most powerful query layer is at the Service API. To fetch calls using the Service API, you can make a request to the [`/calls/stream_query`](https://docs.wandb.ai/weave/reference/service-api/calls/calls-query-stream) endpoint.
```bash theme={null}
curl -L 'https://trace.wandb.ai/calls/stream_query' \
-H 'Content-Type: application/json' \
-H 'Accept: application/json' \
-d '{
"project_id": "string",
"filter": {
"op_names": [
"string"
],
"input_refs": [
"string"
],
"output_refs": [
"string"
],
"parent_ids": [
"string"
],
"trace_ids": [
"string"
],
"call_ids": [
"string"
],
"trace_roots_only": true,
"wb_user_ids": [
"string"
],
"wb_run_ids": [
"string"
]
},
"limit": 100,
"offset": 0,
"sort_by": [
{
"field": "string",
"direction": "asc"
}
],
"query": {
"$expr": {}
},
"include_costs": true,
"include_feedback": true,
"columns": [
"string"
],
"expand_columns": [
"string"
]
}'
```
For complete details on call properties and fields, see the [Call schema reference](/weave/guides/tracking/call-schema-reference).
## Export call metrics
You can also use the Weave Service API's [POST `/calls/stats` endpoint](https://docs.wandb.ai/weave/reference/service-api/calls/call-stats) to retrieve metrics about your Calls without retrieving the Call data itself. This allows you to quickly and efficiently retrieve information about your Calls, such as latency and cost, and aggregate them by sum, average, minimum, maximum, and count. For example, you can retrieve:
* Total token usage
* Average latency
* Maximum tokens used
* Total cost
* Minimum input tokens
The endpoint provides several filtering options that allow you to target Calls made within specified time periods, and by other properties, such as:
* Op name
* Trace ID
* Thread ID
* User ID
The following example demonstrates how to retrieve Calls generated from an Op named `web_app` over a two-day period:
```python Python lines {10-11,16-24} theme={null}
import requests
import json
import os
url = "https://trace.wandb.ai/calls/stats"
payload = {
"project_id": "",
"start": "2026-03-01T00:00:00Z",
# Specify the size of the buckets, in seconds.
"granularity": 86400,
"filter": {
"trace_roots_only": True,
"op_names": ["web_app"]
},
# Specify metrics and their aggregate function
"usage_metrics": [
{"metric": "total_tokens", "aggregations": ["sum"]},
{"metric": "total_cost", "aggregations": ["sum"]}
],
"call_metrics": [
{"metric": "call_count", "aggregations": ["sum"]},
{"metric": "error_count", "aggregations": ["sum"]},
{"metric": "latency_ms", "aggregations": ["avg", "min", "max"], "percentiles": [50, 95, 99]}
]
}
API_KEY = os.getenv("WANDB_API_KEY")
response = requests.post(url, json=payload, auth=("api", API_KEY))
print(json.dumps(response.json(), indent=2))
```
```typescript TypeScript lines {6-7,13-20} theme={null}
const url = "https://trace.wandb.ai/calls/stats";
const payload = {
project_id: "",
start: "2026-03-01T00:00:00Z",
// Specify the size of the buckets, in seconds.
granularity: 86400,
filter: {
trace_roots_only: true,
op_names: ["web_app"],
},
// Specify metrics and their aggregate function
usage_metrics: [
{ metric: "total_tokens", aggregations: ["sum"] },
{ metric: "total_cost", aggregations: ["sum"] },
],
call_metrics: [
{ metric: "call_count", aggregations: ["sum"] },
{ metric: "error_count", aggregations: ["sum"] },
{ metric: "latency_ms", aggregations: ["avg", "min", "max"], percentiles: [50, 95, 99] },
],
};
const API_KEY = process.env.WANDB_API_KEY!;
const response = await fetch(url, {
method: "POST",
headers: {
"Content-Type": "application/json",
Authorization: "Basic " + btoa(`api:${API_KEY}`),
},
body: JSON.stringify(payload),
});
const data = await response.json();
console.log(JSON.stringify(data, null, 2));
```
The request also specifies how to aggregate the metrics. You can aggregate metrics by `sum`, `count`, `avg`, `min`, `max`, and `count`.
The endpoint returns a JSON object. The following example response shows two days' worth of metrics. Each day (bucket) is broken up into its own object in the `usage_buckets` and `call_buckets` arrays. Each array breaks down the metrics differently:
* `usage_buckets`: Groups Call metrics for each day by the model used.
* `call_buckets`: Groups Call metrics for each day regardless of the model used.
Set the granularity field (in seconds) in the request to change the bucket size.
```json lines theme={null}
{
"start": "2026-03-03T00:00:00Z",
"end": "2026-03-04T21:34:39.746539Z",
"granularity": 86400,
"timezone": "UTC",
"usage_buckets": [
{
"timestamp": "2026-03-03T00:00:00",
"model": "gpt-4o-2024-08-06",
"sum_total_tokens": 498.0,
"sum_input_tokens": 219.0,
"sum_output_tokens": 279.0,
"count": 5,
"sum_total_cost": 0.0033374999156876584
},
{
"timestamp": "2026-03-03T00:00:00",
"model": "gpt-5-2025-08-07",
"sum_total_tokens": 0.0,
"sum_input_tokens": 0.0,
"sum_output_tokens": 0.0,
"count": 0,
"sum_total_cost": 0.0
},
{
"timestamp": "2026-03-04T00:00:00",
"model": "gpt-4o-2024-08-06",
"sum_total_tokens": 58.0,
"sum_input_tokens": 27.0,
"sum_output_tokens": 31.0,
"count": 1,
"sum_total_cost": 0.0003774999904635479
},
{
"timestamp": "2026-03-04T00:00:00",
"model": "gpt-5-2025-08-07",
"sum_total_tokens": 427.0,
"sum_input_tokens": 26.0,
"sum_output_tokens": 401.0,
"count": 1,
"sum_total_cost": 0.00404249989787786
}
],
"call_buckets": [
{
"timestamp": "2026-03-03T00:00:00",
"sum_call_count": 6,
"sum_error_count": 1,
"avg_latency_ms": 1505.6666666666667,
"min_latency_ms": 525,
"max_latency_ms": 2524,
"p50_latency_ms": 1534.0,
"p95_latency_ms": 2328.5,
"p99_latency_ms": 2484.9000000000005,
"count": 6
},
{
"timestamp": "2026-03-04T00:00:00",
"sum_call_count": 2,
"sum_error_count": 0,
"avg_latency_ms": 3645.0,
"min_latency_ms": 1739,
"max_latency_ms": 5551,
"p50_latency_ms": 3645.0,
"p95_latency_ms": 5360.4,
"p99_latency_ms": 5512.88,
"count": 2
}
]
}
```
You can query metrics for a maximum time range of 31 days. See the [Service API reference](https://docs.wandb.ai/weave/reference/service-api/calls/call-stats) for more details and available options.
## Fetch calls programmatically
To fetch calls using the Python API, you can use the [`client.get_calls`](/weave/reference/python-sdk/trace/weave_client#method-get_calls) method:
```python lines theme={null}
import weave
# Initialize the client
client = weave.init("your-project-name")
# Fetch calls
calls = client.get_calls(filter=...)
```
To fetch calls using the TypeScript API, you can use the [`client.getCalls`](/weave/reference/typescript-sdk/classes/weaveclient#getcalls) method.
```typescript lines theme={null}
import * as weave from 'weave'
// Initialize the client
const client = await weave.init('intro-example')
// Fetch calls
const calls = await client.getCalls(filter=...)
```
The most powerful query layer is at the Service API. To fetch calls using the Service API, you can make a request to the [`/calls/stream_query`](https://docs.wandb.ai/weave/reference/service-api/calls/calls-query-stream) endpoint.
```bash theme={null}
curl -L 'https://trace.wandb.ai/calls/stream_query' \
-H 'Content-Type: application/json' \
-H 'Accept: application/json' \
-d '{
"project_id": "string",
"filter": {
"op_names": [
"string"
],
"input_refs": [
"string"
],
"output_refs": [
"string"
],
"parent_ids": [
"string"
],
"trace_ids": [
"string"
],
"call_ids": [
"string"
],
"trace_roots_only": true,
"wb_user_ids": [
"string"
],
"wb_run_ids": [
"string"
]
},
"limit": 100,
"offset": 0,
"sort_by": [
{
"field": "string",
"direction": "asc"
}
],
"query": {
"$expr": {}
},
"include_costs": true,
"include_feedback": true,
"columns": [
"string"
],
"expand_columns": [
"string"
]
}'
```
For complete details on call properties and fields, see the [Call schema reference](/weave/guides/tracking/call-schema-reference).
## Export call metrics
You can also use the Weave Service API's [POST `/calls/stats` endpoint](https://docs.wandb.ai/weave/reference/service-api/calls/call-stats) to retrieve metrics about your Calls without retrieving the Call data itself. This allows you to quickly and efficiently retrieve information about your Calls, such as latency and cost, and aggregate them by sum, average, minimum, maximum, and count. For example, you can retrieve:
* Total token usage
* Average latency
* Maximum tokens used
* Total cost
* Minimum input tokens
The endpoint provides several filtering options that allow you to target Calls made within specified time periods, and by other properties, such as:
* Op name
* Trace ID
* Thread ID
* User ID
The following example demonstrates how to retrieve Calls generated from an Op named `web_app` over a two-day period:
```python Python lines {10-11,16-24} theme={null}
import requests
import json
import os
url = "https://trace.wandb.ai/calls/stats"
payload = {
"project_id": "",
"start": "2026-03-01T00:00:00Z",
# Specify the size of the buckets, in seconds.
"granularity": 86400,
"filter": {
"trace_roots_only": True,
"op_names": ["web_app"]
},
# Specify metrics and their aggregate function
"usage_metrics": [
{"metric": "total_tokens", "aggregations": ["sum"]},
{"metric": "total_cost", "aggregations": ["sum"]}
],
"call_metrics": [
{"metric": "call_count", "aggregations": ["sum"]},
{"metric": "error_count", "aggregations": ["sum"]},
{"metric": "latency_ms", "aggregations": ["avg", "min", "max"], "percentiles": [50, 95, 99]}
]
}
API_KEY = os.getenv("WANDB_API_KEY")
response = requests.post(url, json=payload, auth=("api", API_KEY))
print(json.dumps(response.json(), indent=2))
```
```typescript TypeScript lines {6-7,13-20} theme={null}
const url = "https://trace.wandb.ai/calls/stats";
const payload = {
project_id: "",
start: "2026-03-01T00:00:00Z",
// Specify the size of the buckets, in seconds.
granularity: 86400,
filter: {
trace_roots_only: true,
op_names: ["web_app"],
},
// Specify metrics and their aggregate function
usage_metrics: [
{ metric: "total_tokens", aggregations: ["sum"] },
{ metric: "total_cost", aggregations: ["sum"] },
],
call_metrics: [
{ metric: "call_count", aggregations: ["sum"] },
{ metric: "error_count", aggregations: ["sum"] },
{ metric: "latency_ms", aggregations: ["avg", "min", "max"], percentiles: [50, 95, 99] },
],
};
const API_KEY = process.env.WANDB_API_KEY!;
const response = await fetch(url, {
method: "POST",
headers: {
"Content-Type": "application/json",
Authorization: "Basic " + btoa(`api:${API_KEY}`),
},
body: JSON.stringify(payload),
});
const data = await response.json();
console.log(JSON.stringify(data, null, 2));
```
The request also specifies how to aggregate the metrics. You can aggregate metrics by `sum`, `count`, `avg`, `min`, `max`, and `count`.
The endpoint returns a JSON object. The following example response shows two days' worth of metrics. Each day (bucket) is broken up into its own object in the `usage_buckets` and `call_buckets` arrays. Each array breaks down the metrics differently:
* `usage_buckets`: Groups Call metrics for each day by the model used.
* `call_buckets`: Groups Call metrics for each day regardless of the model used.
Set the granularity field (in seconds) in the request to change the bucket size.
```json lines theme={null}
{
"start": "2026-03-03T00:00:00Z",
"end": "2026-03-04T21:34:39.746539Z",
"granularity": 86400,
"timezone": "UTC",
"usage_buckets": [
{
"timestamp": "2026-03-03T00:00:00",
"model": "gpt-4o-2024-08-06",
"sum_total_tokens": 498.0,
"sum_input_tokens": 219.0,
"sum_output_tokens": 279.0,
"count": 5,
"sum_total_cost": 0.0033374999156876584
},
{
"timestamp": "2026-03-03T00:00:00",
"model": "gpt-5-2025-08-07",
"sum_total_tokens": 0.0,
"sum_input_tokens": 0.0,
"sum_output_tokens": 0.0,
"count": 0,
"sum_total_cost": 0.0
},
{
"timestamp": "2026-03-04T00:00:00",
"model": "gpt-4o-2024-08-06",
"sum_total_tokens": 58.0,
"sum_input_tokens": 27.0,
"sum_output_tokens": 31.0,
"count": 1,
"sum_total_cost": 0.0003774999904635479
},
{
"timestamp": "2026-03-04T00:00:00",
"model": "gpt-5-2025-08-07",
"sum_total_tokens": 427.0,
"sum_input_tokens": 26.0,
"sum_output_tokens": 401.0,
"count": 1,
"sum_total_cost": 0.00404249989787786
}
],
"call_buckets": [
{
"timestamp": "2026-03-03T00:00:00",
"sum_call_count": 6,
"sum_error_count": 1,
"avg_latency_ms": 1505.6666666666667,
"min_latency_ms": 525,
"max_latency_ms": 2524,
"p50_latency_ms": 1534.0,
"p95_latency_ms": 2328.5,
"p99_latency_ms": 2484.9000000000005,
"count": 6
},
{
"timestamp": "2026-03-04T00:00:00",
"sum_call_count": 2,
"sum_error_count": 0,
"avg_latency_ms": 3645.0,
"min_latency_ms": 1739,
"max_latency_ms": 5551,
"p50_latency_ms": 3645.0,
"p95_latency_ms": 5360.4,
"p99_latency_ms": 5512.88,
"count": 2
}
]
}
```
You can query metrics for a maximum time range of 31 days. See the [Service API reference](https://docs.wandb.ai/weave/reference/service-api/calls/call-stats) for more details and available options.