> ## Documentation Index
> Fetch the complete documentation index at: https://docs.wandb.ai/llms.txt
> Use this file to discover all available pages before exploring further.
# Navigate the Weave Trace view
> Use Weave's Trace view to make sense of complex execution paths in your LLM and agentic apps.
The Weave Trace view is designed to help you make sense of complex execution paths in your LLM and agentic apps. Whether you're debugging an agentic app with dozens of nested calls, or tracking the flow of a single model prediction, the Trace view provides a clear visualization of what happened. It also provides alternate ways to view and understand your application flow.
This guide describes how to move through the trace stack, filter and search for functions called by your code, switch between visual representations, and more.
## Get started
To enter the Trace view:
1. Navigate to [https://wandb.ai](https://wandb.ai) and select your project.
2. In the sidebar menu, select **Traces** to view all traces saved for your project.
3. Select a trace to open the Trace Details view. The Trace Details view displays additional panels with a hierarchical breakdown of the trace execution.
## Traces page overview
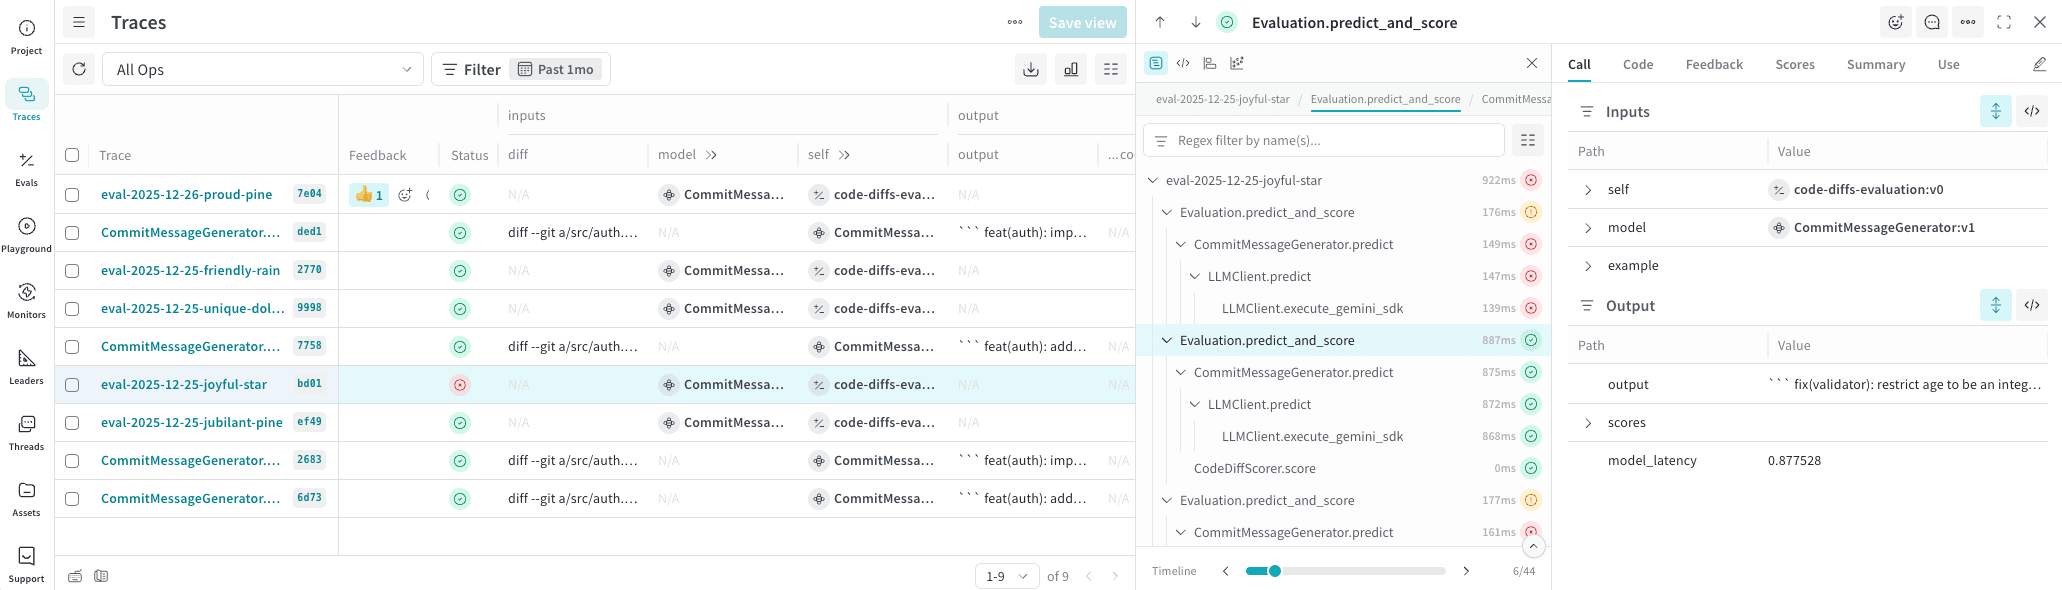
The Traces page is composed of three core panels:
* **Left panel**: A sortable, paginated list of all traces for the project.
* This traces table includes additional data such as tokens, cost, and latency.
* **Center panel**: Interactive trace view for a selected trace. The trace tree shows a hierarchy of all the methods tracked within the trace.
* The trace tree displays [ops](/weave/guides/tracking/ops#automatically-track-function-calls-using-ops), which are `@weave.op()`-decorated functions, that were called during the trace.
* **Right panel**: Details for a selected op within the selected trace.
 ### Filter within a trace
* **Regex filter by name(s)**: Use the text field above the trace tree to filter ops by name or type, such as `tool`, `openai.response.create`.
* **Metrics**: Control whether to display the following data metrics when available: cost, tokens, and latency.
### Navigate a trace
The trace tree shows a hierarchy of all the methods tracked within the trace. To move up/down the tree, use `Cmd` (macOS) or `Alt` (Windows/Linux) + Up Arrow (↑) / Down Arrow (↓).
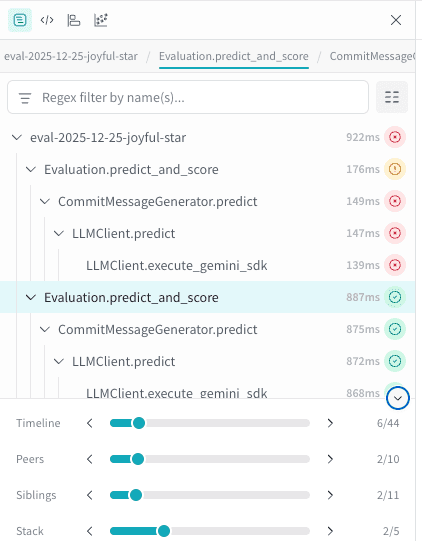
There are several scrubbers below the trace tree that provide rapid navigation across states within it. You can use the sliders to strategically navigate through your trace.
Expand the panel to see all available scrubbers:
* **Timeline**: Chronological order of events within the trace.
* **Peers**: Ops sharing the same type. For example, if you were examining details of a function called `predict`, you can use this scrubber to immediately jump to the next execution of `predict` within the trace.
* **Siblings**: Ops with the same parent. Use this scrubber to iterate over ops nested under the parent function call.
* **Stack**: Traverse up/down the call stack.
* **Path**: (Only available in code composition view) Iterate through all calls with the same code path as the selected call.
### Filter within a trace
* **Regex filter by name(s)**: Use the text field above the trace tree to filter ops by name or type, such as `tool`, `openai.response.create`.
* **Metrics**: Control whether to display the following data metrics when available: cost, tokens, and latency.
### Navigate a trace
The trace tree shows a hierarchy of all the methods tracked within the trace. To move up/down the tree, use `Cmd` (macOS) or `Alt` (Windows/Linux) + Up Arrow (↑) / Down Arrow (↓).
There are several scrubbers below the trace tree that provide rapid navigation across states within it. You can use the sliders to strategically navigate through your trace.
Expand the panel to see all available scrubbers:
* **Timeline**: Chronological order of events within the trace.
* **Peers**: Ops sharing the same type. For example, if you were examining details of a function called `predict`, you can use this scrubber to immediately jump to the next execution of `predict` within the trace.
* **Siblings**: Ops with the same parent. Use this scrubber to iterate over ops nested under the parent function call.
* **Stack**: Traverse up/down the call stack.
* **Path**: (Only available in code composition view) Iterate through all calls with the same code path as the selected call.
 ### Alternative trace tree views
At the top of the panel, you can switch between multiple visual representations of the trace tree depending on your needs. Switch between views based on your debugging needs. Use **code composition view** to understand call logic, **flame graph view** for to understand performance over time, and **graph view** to understand structure.
#### Traces (default)
The default view of the trace tree shows stack hierarchy, cost per op (if available), execution time, and status indicators.
#### Code composition view
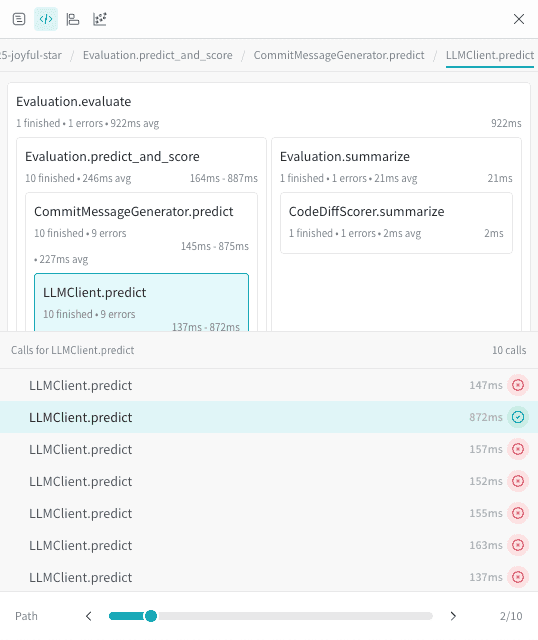
In the code composition view, boxes represent ops and their nested calls. This is helpful for visualizing flow of function calls. In this view, you can select a box to drill into that op and filter the call path.
### Alternative trace tree views
At the top of the panel, you can switch between multiple visual representations of the trace tree depending on your needs. Switch between views based on your debugging needs. Use **code composition view** to understand call logic, **flame graph view** for to understand performance over time, and **graph view** to understand structure.
#### Traces (default)
The default view of the trace tree shows stack hierarchy, cost per op (if available), execution time, and status indicators.
#### Code composition view
In the code composition view, boxes represent ops and their nested calls. This is helpful for visualizing flow of function calls. In this view, you can select a box to drill into that op and filter the call path.
 #### Flame graph
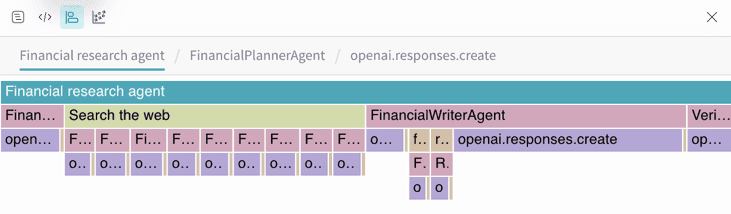
The flame graph view provides a timeline-based visualization of execution depth and duration. This is helpful for when trying to understand performance diagnostics over time. You can select into frames to isolate sub-traces.
#### Flame graph
The flame graph view provides a timeline-based visualization of execution depth and duration. This is helpful for when trying to understand performance diagnostics over time. You can select into frames to isolate sub-traces.
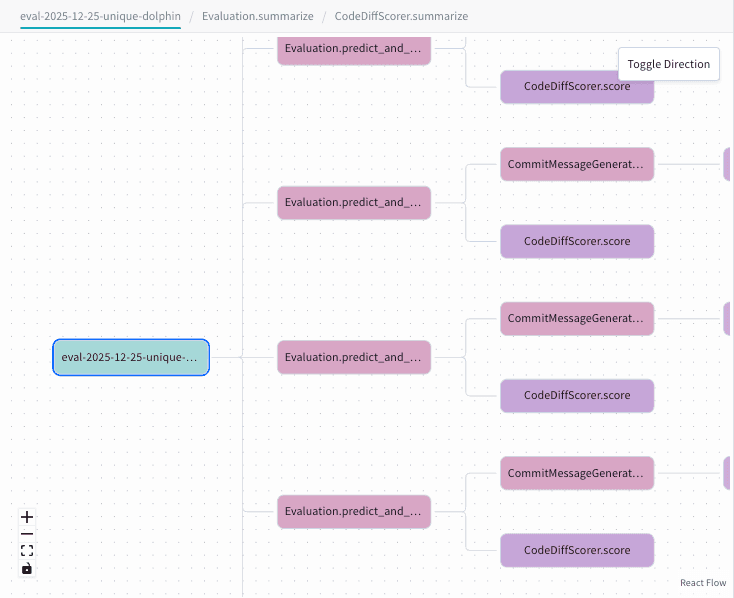
 #### Graph view
The graph view shows hierarchical relationships between ops. This is useful for understanding parent/child relationships.
#### Graph view
The graph view shows hierarchical relationships between ops. This is useful for understanding parent/child relationships.
 ### View details for a trace op
After you have selected an op in the trace tree, details for that op display in the next panel. These details are grouped into the following tabs:
* **Call**: The input and output to the op execution.
* **Code**: The code that was used when the call was made.
* **Feedback**: Any available [feedback](/weave/guides/tracking/feedback) for the op. You can provide feedback directly within Weave or through the API.
* **Scores**: Any available [scores](/weave/guides/evaluation/scorers) for the op. Calls are scored by running Evaluations.
* **Summary**: General information about the op.
* **Use:** Code snippets that you can use to programmatically retrieve the call and add reactions, notes, or feedback.
### View details for a trace op
After you have selected an op in the trace tree, details for that op display in the next panel. These details are grouped into the following tabs:
* **Call**: The input and output to the op execution.
* **Code**: The code that was used when the call was made.
* **Feedback**: Any available [feedback](/weave/guides/tracking/feedback) for the op. You can provide feedback directly within Weave or through the API.
* **Scores**: Any available [scores](/weave/guides/evaluation/scorers) for the op. Calls are scored by running Evaluations.
* **Summary**: General information about the op.
* **Use:** Code snippets that you can use to programmatically retrieve the call and add reactions, notes, or feedback.