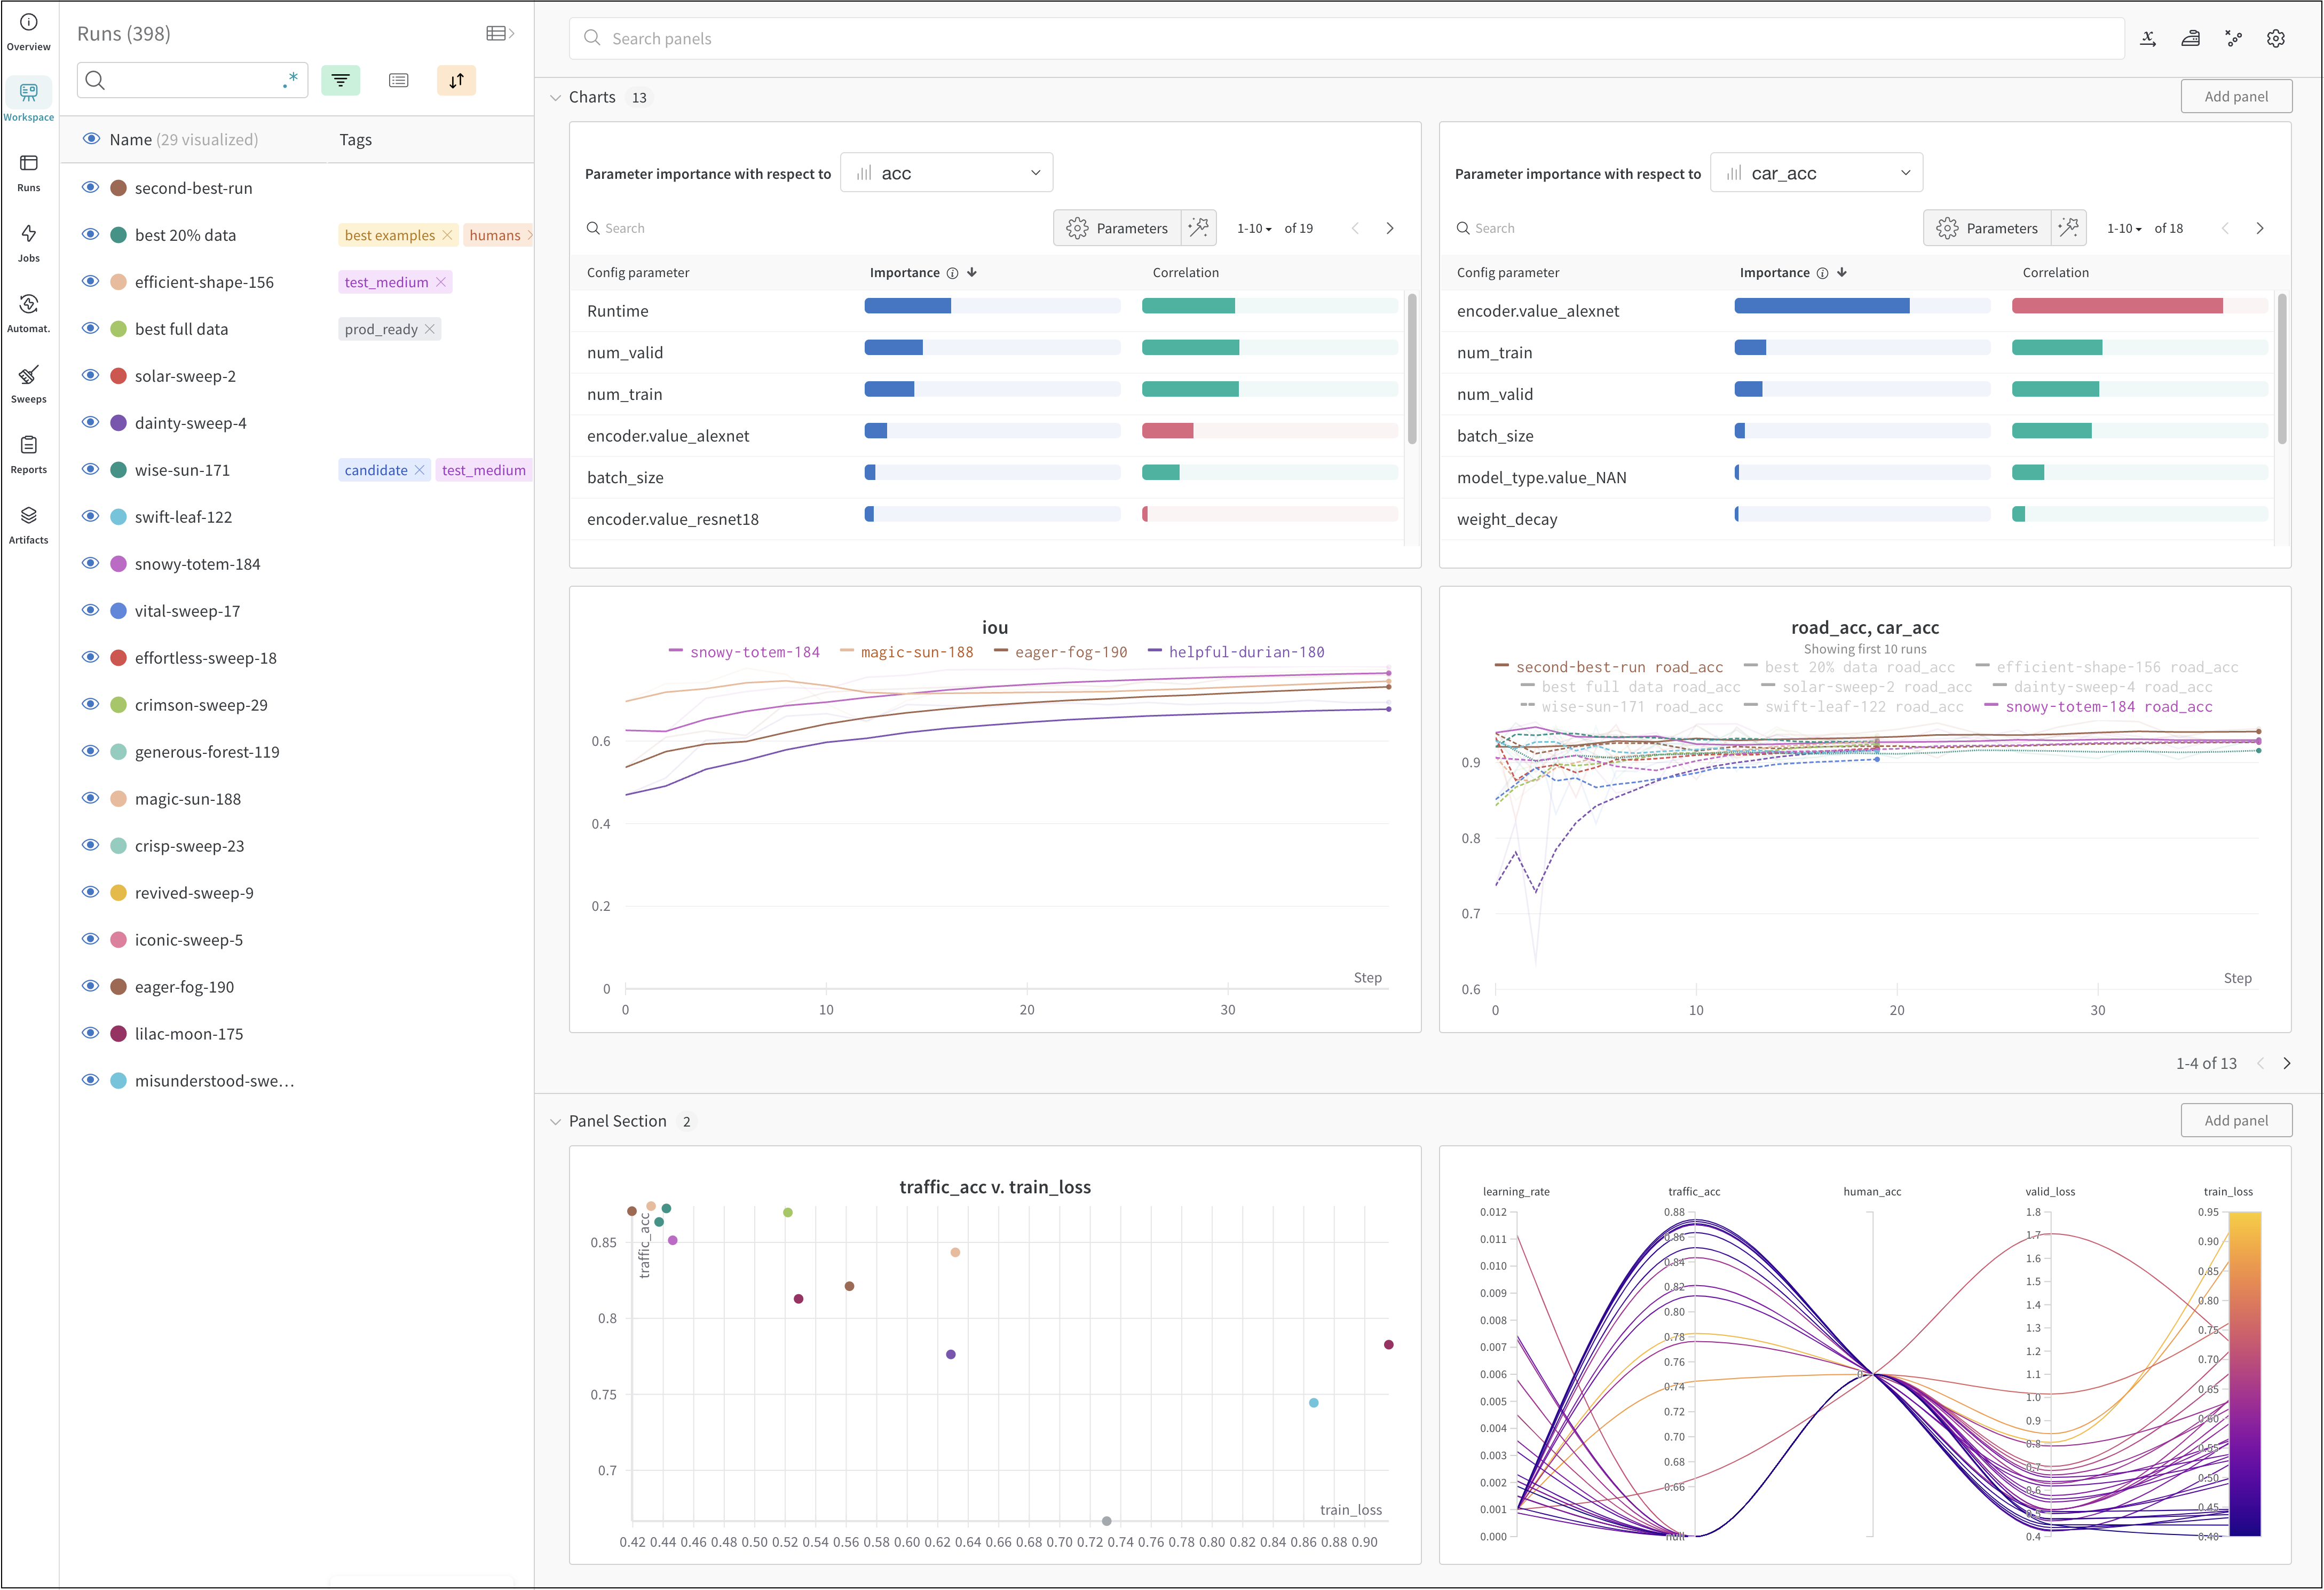
Track machine learning experiments with a few lines of code. You can then review the results in an interactive dashboard or export your data to Python for programmatic access using our Public API.
Utilize W&B Integrations if you use popular frameworks such as PyTorch, Keras, or Scikit. See our Integration guides for a for a full list of integrations and information on how to add W&B to your code.
The image above shows an example dashboard where you can view and compare metrics across multiple runs.
How it works
Track a machine learning experiment with a few lines of code:
Store a dictionary of hyperparameters, such as learning rate or model type, into your configuration (wandb.config).
Log metrics (wandb.log()) over time in a training loop, such as accuracy and loss.
Save outputs of a run, like the model weights or a table of predictions.
The proceeding pseudocode demonstrates a common W&B Experiment tracking workflow:
# 1. Start a W&B Runwandb.init(entity="", project="my-project-name")
# 2. Save mode inputs and hyperparameterswandb.config.learning_rate =0.01# Import model and datamodel, dataloader = get_model(), get_data()
# Model training code goes here# 3. Log metrics over time to visualize performancewandb.log({"loss": loss})
# 4. Log an artifact to W&Bwandb.log_artifact(model)
How to get started
Depending on your use case, explore the following resources to get started with W&B Experiments:
Read the W&B Quickstart for a step-by-step outline of the W&B Python SDK commands you could use to create, track, and use a dataset artifact.
Use the W&B Python SDK to track machine learning experiments. You can then review the results in an interactive dashboard or export your data to Python for programmatic access with the W&B Public API.
This guide describes how to use W&B building blocks to create a W&B Experiment.
At the beginning of your script call, the wandb.init() API to generate a background process to sync and log data as a W&B Run.
The proceeding code snippet demonstrates how to create a new W&B project named “cat-classification”. A note “My first experiment” was added to help identify this run. Tags “baseline” and “paper1” are included to remind us that this run is a baseline experiment intended for a future paper publication.
# Import the W&B Python Libraryimport wandb
# 1. Start a W&B Runrun = wandb.init(
project="cat-classification",
notes="My first experiment",
tags=["baseline", "paper1"],
)
A Run object is returned when you initialize W&B with wandb.init(). Additionally, W&B creates a local directory where all logs and files are saved and streamed asynchronously to a W&B server.
Note: Runs are added to pre-existing projects if that project already exists when you call wandb.init(). For example, if you already have a project called “cat-classification”, that project will continue to exist and not be deleted. Instead, a new run is added to that project.
Capture a dictionary of hyperparameters
Save a dictionary of hyperparameters such as learning rate or model type. The model settings you capture in config are useful later to organize and query your results.
# 2. Capture a dictionary of hyperparameterswandb.config = {"epochs": 100, "learning_rate": 0.001, "batch_size": 128}
Log metrics during each for loop (epoch), the accuracy and loss values are computed and logged to W&B with wandb.log(). By default, when you call wandb.log it appends a new step to the history object and updates the summary object.
The following code example shows how to log metrics with wandb.log.
Details of how to set up your mode and retrieve data are omitted.
# Set up model and datamodel, dataloader = get_model(), get_data()
for epoch in range(wandb.config.epochs):
for batch in dataloader:
loss, accuracy = model.training_step()
# 3. Log metrics inside your training loop to visualize# model performance wandb.log({"accuracy": accuracy, "loss": loss})
Optionally log a W&B Artifact. Artifacts make it easy to version datasets and models.
wandb.log_artifact(model)
For more information about Artifacts, see the Artifacts Chapter. For more information about versioning models, see Model Management.
Putting it all together
The full script with the preceding code snippets is found below:
# Import the W&B Python Libraryimport wandb
# 1. Start a W&B Runrun = wandb.init(project="cat-classification", notes="", tags=["baseline", "paper1"])
# 2. Capture a dictionary of hyperparameterswandb.config = {"epochs": 100, "learning_rate": 0.001, "batch_size": 128}
# Set up model and datamodel, dataloader = get_model(), get_data()
for epoch in range(wandb.config.epochs):
for batch in dataloader:
loss, accuracy = model.training_step()
# 3. Log metrics inside your training loop to visualize# model performance wandb.log({"accuracy": accuracy, "loss": loss})
# 4. Log an artifact to W&Bwandb.log_artifact(model)
# Optional: save model at the endmodel.to_onnx()
wandb.save("model.onnx")
Next steps: Visualize your experiment
Use the W&B Dashboard as a central place to organize and visualize results from your machine learning models. With just a few clicks, construct rich, interactive charts like parallel coordinates plots, parameter importance analyzes, and more.
The following are some suggested guidelines to consider when you create experiments:
Config: Track hyperparameters, architecture, dataset, and anything else you’d like to use to reproduce your model. These will show up in columns— use config columns to group, sort, and filter runs dynamically in the app.
Project: A project is a set of experiments you can compare together. Each project gets a dedicated dashboard page, and you can easily turn on and off different groups of runs to compare different model versions.
Notes: Set a quick commit message directly from your script. Edit and access notes in the Overview section of a run in the W&B App.
Tags: Identify baseline runs and favorite runs. You can filter runs using tags. You can edit tags at a later time on the Overview section of your project’s dashboard on the W&B App.
The following code snippet demonstrates how to define a W&B Experiment using the best practices listed above:
Use the wandb.config object to save your training configuration such as:
hyperparameter
input settings such as the dataset name or model type
any other independent variables for your experiments.
The wandb.config attribute makes it easy to analyze your experiments and reproduce your work in the future. You can group by configuration values in the W&B App, compare the settings of different W&B Runs and view how different training configurations affect the output. A Run’s config attribute is a dictionary-like object, and it can be built from lots of dictionary-like objects.
Dependent variables (like loss and accuracy) or output metrics should be saved with wandb.loginstead.
Set up an experiment configuration
Configurations are typically defined in the beginning of a training script. Machine learning workflows may vary, however, so you are not required to define a configuration at the beginning of your training script.
We recommend that you avoid using dots in your config variable names. Instead, use a dash or underscore instead. Use the dictionary access syntax ["key"]["foo"] instead of the attribute access syntax config.key.foo if your script accesses wandb.config keys below the root.
The following sections outline different common scenarios of how to define your experiments configuration.
Set the configuration at initialization
Pass a dictionary at the beginning of your script when you call the wandb.init() API to generate a background process to sync and log data as a W&B Run.
The proceeding code snippet demonstrates how to define a Python dictionary with configuration values and how to pass that dictionary as an argument when you initialize a W&B Run.
import wandb
# Define a config dictionary objectconfig = {
"hidden_layer_sizes": [32, 64],
"kernel_sizes": [3],
"activation": "ReLU",
"pool_sizes": [2],
"dropout": 0.5,
"num_classes": 10,
}
# Pass the config dictionary when you initialize W&Brun = wandb.init(project="config_example", config=config)
You can pass a nested dictionary to wandb.config(). W&B will flatten the names using dots in the W&B backend.
Access the values from the dictionary similarly to how you access other dictionaries in Python:
# Access values with the key as the index valuehidden_layer_sizes = wandb.config["hidden_layer_sizes"]
kernel_sizes = wandb.config["kernel_sizes"]
activation = wandb.config["activation"]
# Python dictionary get() methodhidden_layer_sizes = wandb.config.get("hidden_layer_sizes")
kernel_sizes = wandb.config.get("kernel_sizes")
activation = wandb.config.get("activation")
Throughout the Developer Guide and examples we copy the configuration values into separate variables. This step is optional. It is done for readability.
Set the configuration with argparse
You can set your configuration with an argparse object. argparse, short for argument parser, is a standard library module in Python 3.2 and above that makes it easy to write scripts that take advantage of all the flexibility and power of command line arguments.
This is useful for tracking results from scripts that are launched from the command line.
The proceeding Python script demonstrates how to define a parser object to define and set your experiment config. The functions train_one_epoch and evaluate_one_epoch are provided to simulate a training loop for the purpose of this demonstration:
# config_experiment.pyimport wandb
import argparse
import numpy as np
import random
# Training and evaluation demo codedeftrain_one_epoch(epoch, lr, bs):
acc =0.25+ ((epoch /30) + (random.random() /10))
loss =0.2+ (1- ((epoch -1) /10+ random.random() /5))
return acc, loss
defevaluate_one_epoch(epoch):
acc =0.1+ ((epoch /20) + (random.random() /10))
loss =0.25+ (1- ((epoch -1) /10+ random.random() /6))
return acc, loss
defmain(args):
# Start a W&B Run run = wandb.init(project="config_example", config=args)
# Access values from config dictionary and store them# into variables for readability lr = wandb.config["learning_rate"]
bs = wandb.config["batch_size"]
epochs = wandb.config["epochs"]
# Simulate training and logging values to W&Bfor epoch in np.arange(1, epochs):
train_acc, train_loss = train_one_epoch(epoch, lr, bs)
val_acc, val_loss = evaluate_one_epoch(epoch)
wandb.log(
{
"epoch": epoch,
"train_acc": train_acc,
"train_loss": train_loss,
"val_acc": val_acc,
"val_loss": val_loss,
}
)
if __name__ =="__main__":
parser = argparse.ArgumentParser(
formatter_class=argparse.ArgumentDefaultsHelpFormatter
)
parser.add_argument("-b", "--batch_size", type=int, default=32, help="Batch size")
parser.add_argument(
"-e", "--epochs", type=int, default=50, help="Number of training epochs" )
parser.add_argument(
"-lr", "--learning_rate", type=int, default=0.001, help="Learning rate" )
args = parser.parse_args()
main(args)
Set the configuration throughout your script
You can add more parameters to your config object throughout your script. The proceeding code snippet demonstrates how to add new key-value pairs to your config object:
import wandb
# Define a config dictionary objectconfig = {
"hidden_layer_sizes": [32, 64],
"kernel_sizes": [3],
"activation": "ReLU",
"pool_sizes": [2],
"dropout": 0.5,
"num_classes": 10,
}
# Pass the config dictionary when you initialize W&Brun = wandb.init(project="config_example", config=config)
# Update config after you initialize W&Bwandb.config["dropout"] =0.2wandb.config.epochs =4wandb.config["batch_size"] =32
Use the W&B Public API to update your config (or anything else about from a complete Run) after your Run. This is particularly useful if you forgot to log a value during a Run.
Provide your entity, project name, and the Run ID to update your configuration after a Run has finished. Find these values directly from the Run object itself wandb.run or from the W&B App UI:
api = wandb.Api()
# Access attributes directly from the run object# or from the W&B Appusername = wandb.run.entity
project = wandb.run.project
run_id = wandb.run.id
run = api.run(f"{username}/{project}/{run_id}")
run.config["bar"] =32run.update()
flags.DEFINE_string("model", None, "model to run") # name, default, helpwandb.config.update(flags.FLAGS) # adds absl flags to config
File-Based Configs
If you place a file named config-defaults.yaml in the same directory as your run script, the run automatically picks up the key-value pairs defined in the file and passes them to wandb.config.
The following code snippet shows a sample config-defaults.yaml YAML file:
# config-defaults.yaml@@ -224,9 +225,21 @@ batch_size:
desc: Size of each mini-batchvalue: 32
You can override the default values automatically loaded from config-defaults.yaml by setting updated values in the config argument of wandb.init. For example:
To load a configuration file other than config-defaults.yaml, use the --configs command-line argument and specify the path to the file:
python train.py --configs other-config.yaml
Example use case for file-based configs
Suppose you have a YAML file with some metadata for the run, and then a dictionary of hyperparameters in your Python script. You can save both in the nested config object:
Reports: saved snapshots of notes, runs, and graphs
Artifacts: Contains all runs and the artifacts associated with that run
Overview tab
Project name: The name of the project. W&B creates a project for you when you initialize a run with the name you provide for the project field. You can change the name of the project at any time by selecting the Edit button in the upper right corner.
Description: A description of the project.
Project visibility: The visibility of the project. The visibility setting that determines who can access it. See Project visibility for more information.
Last active: Timestamp of the last time data is logged to this project
Owner: The entity that owns this project
Contributors: The number of users that contribute to this project
Total runs: The total number of runs in this project
Total compute: we add up all the run times in your project to get this total
Undelete runs: Click the dropdown menu and click “Undelete all runs” to recover deleted runs in your project.
Delete project: click the dot menu in the right corner to delete a project
A project’s workspace gives you a personal sandbox to compare experiments. Use projects to organize models that can be compared, working on the same problem with different architectures, hyperparameters, datasets, preprocessing etc.
Runs Sidebar: list of all the runs in your project
Dot menu: hover over a row in the sidebar to see the menu appear on the left side. Use this menu to rename a run, delete a run, or stop and active run.
Visibility icon: click the eye to turn on and off runs on graphs
Color: change the run color to another one of our presets or a custom color
Search: search runs by name. This also filters visible runs in the plots.
Filter: use the sidebar filter to narrow down the set of runs visible
Group: select a config column to dynamically group your runs, for example by architecture. Grouping makes plots show up with a line along the mean value, and a shaded region for the variance of points on the graph.
Sort: pick a value to sort your runs by, for example runs with the lowest loss or highest accuracy. Sorting will affect which runs show up on the graphs.
Expand button: expand the sidebar into the full table
Run count: the number in parentheses at the top is the total number of runs in the project. The number (N visualized) is the number of runs that have the eye turned on and are available to be visualized in each plot. In the example below, the graphs are only showing the first 10 of 183 runs. Edit a graph to increase the max number of runs visible.
Panels layout: use this scratch space to explore results, add and remove charts, and compare versions of your models based on different metrics
Click the section dropdown menu and click “Add section” to create a new section for panels. You can rename sections, drag them to reorganize them, and expand and collapse sections.
Each section has options in the upper right corner:
Switch to custom layout: The custom layout allows you to resize panels individually.
Switch to standard layout: The standard layout lets you resize all panels in the section at once, and gives you pagination.
Add section: Add a section above or below from the dropdown menu, or click the button at the bottom of the page to add a new section.
Rename section: Change the title for your section.
Export section to report: Save this section of panels to a new report.
Delete section: Remove the whole section and all the charts. This can be undone with the undo button at the bottom of the page in the workspace bar.
Add panel: Click the plus button to add a panel to the section.
Move panels between sections
Drag and drop panels to reorder and organize into sections. You can also click the “Move” button in the upper right corner of a panel to select a section to move the panel to.
Resize panels
Standard layout: All panels maintain the same size, and there are pages of panels. You can resize the panels by clicking and dragging the lower right corner. Resize the section by clicking and dragging the lower right corner of the section.
Custom layout: All panels are sized individually, and there are no pages.
Search for metrics
Use the search box in the workspace to filter down the panels. This search matches the panel titles, which are by default the name of the metrics visualized.
Runs tab
Use the runs tab to filter, group, and sort your results.
The proceeding tabs demonstrate some common actions you can take in the runs tab.
Sort all rows in a Table by the value in a given column.
Hover your mouse over the column title. A kebob menu will appear (three vertical docs).
Select on the kebob menu (three vertical dots).
Choose Sort Asc or Sort Desc to sort the rows in ascending or descending order, respectively.
The preceding image demonstrates how to view sorting options for a Table column called val_acc.
Filter all rows by an expression with the Filter button on the top left of the dashboard.
Select Add filter to add one or more filters to your rows. Three dropdown menus will appear. From left to right the filter types are based on: Column name, Operator , and Values
Column name
Binary relation
Value
Accepted values
String
=, ≠, ≤, ≥, IN, NOT IN,
Integer, float, string, timestamp, null
The expression editor shows a list of options for each term using autocomplete on column names and logical predicate structure. You can connect multiple logical predicates into one expression using “and” or “or” (and sometimes parentheses).
The preceding image shows a filter that is based on the `val_loss` column. The filter shows runs with a validation loss less than or equal to 1.
Group all rows by the value in a particular column with the Group by button in a column header.
By default, this turns other numeric columns into histograms showing the distribution of values for that column across the group. Grouping is helpful for understanding higher-level patterns in your data.
Reports tab
See all the snapshots of results in one place, and share findings with your team.
On the overview panel, you’ll find a variety of high-level information about the artifact, including its name and version, the hash digest used to detect changes and prevent duplication, the creation date, and any aliases. You can add or remove aliases here, take notes on both the version as well as the artifact as a whole.
Metadata panel
The metadata panel provides access to the artifact’s metadata, which is provided when the artifact is constructed. This metadata might include configuration arguments required to reconstruct the artifact, URLs where more information can be found, or metrics produced during the run which logged the artifact. Additionally, you can see the configuration for the run which produced the artifact as well as the history metrics at the time of logging the artifact.
Usage panel
The Usage panel provides a code snippet for downloading the artifact for use outside of the web app, for example on a local machine. This section also indicates and links to the run which output the artifact and any runs which use the artifact as an input.
Files panel
The files panel lists the files and folders associated with the artifact. W&B uploads certain files for a run automatically. For example, requirements.txt shows the versions of each library the run used, and wandb-metadata.json, and wandb-summary.json include information about the run. Other files may be uploaded, such as artifacts or media, depending on the run’s configuration. You can navigate through this file tree and view the contents directly in the W&B web app.
Tables associated with artifacts are particularly rich and interactive in this context. Learn more about using Tables with Artifacts here.
Lineage panel
The lineage panel provides a view of all of the artifacts associated with a project and the runs that connect them to each other. It shows run types as blocks and artifacts as circles, with arrows to indicate when a run of a given type consumes or produces an artifact of a given type. The type of the particular artifact selected in the left-hand column is highlighted.
Click the Explode toggle to view all of the individual artifact versions and the specific runs that connect them.
Action History Audit tab
The action history audit tab shows all of the alias actions and membership changes for a Collection so you can audit the entire evolution of the resource.
Versions tab
The versions tab shows all versions of the artifact as well as columns for each of the numeric values of the Run History at the time of logging the version. This allows you to compare performance and quickly identify versions of interest.
Star a project
Add a star to a project to mark that project as important. Projects that you and your team mark as important with stars appear at the top of your organization’s home page.
For example, the proceeding image shows two projects that are marked as important, the zoo_experiment and registry_demo. Both projects appear within the top of the organization’s home page within the Starred projects section.
There are two ways to mark a project as important: within a project’s overview tab or within your team’s profile page.
Navigate to your W&B project on the W&B App at https://wandb.ai/<team>/<project-name>.
Select the Overview tab from the project sidebar.
Choose the star icon in the upper right corner next to the Edit button.
Navigate to your team’s profile page at https://wandb.ai/<team>/projects.
Select the Projects tab.
Hover your mouse next to the project you want to star. Click on star icon that appears.
For example, the proceeding image shows the star icon next to the “Compare_Zoo_Models” project.
Confirm that your project appears on the landing page of your organization by clicking on the organization name in the top left corner of the app.
Delete a project
You can delete your project by clicking the three dots on the right of the overview tab.
If the project is empty, you can delete it by clicking the dropdown menu in the top-right and selecting Delete project.
Add notes to a project
Add notes to your project either as a description overview or as a markdown panel within your workspace.
Add description overview to a project
Descriptions you add to your page appear in the Overview tab of your profile.
Navigate to your W&B project
Select the Overview tab from the project sidebar
Choose Edit in the upper right hand corner
Add your notes in the Description field
Select the Save button
Create reports to create descriptive notes comparing runs
You can also create a W&B Report to add plots and markdown side by side. Use different sections to show different runs, and tell a story about what you worked on.
Add notes to run workspace
Navigate to your W&B project
Select the Workspace tab from the project sidebar
Choose the Add panels button from the top right corner
Select the TEXT AND CODE dropdown from the modal that appears
Select Markdown
Add your notes in the markdown panel that appears in your workspace
4 - View experiments results
A playground for exploring run data with interactive visualizations
W&B workspace is your personal sandbox to customize charts and explore model results. A W&B workspace consists of Tables and Panel sections:
Tables: All runs logged to your project are listed in the project’s table. Turn on and off runs, change colors, and expand the table to see notes, config, and summary metrics for each run.
Panel sections: A section that contains one or more panels. Create new panels, organize them, and export to reports to save snapshots of your workspace.
Workspace types
There are two main workspace categories: Personal workspaces and Saved views.
Personal workspaces: A customizable workspace for in-depth analysis of models and data visualizations. Only the owner of the workspace can edit and save changes. Teammates can view a personal workspace but teammates can not make changes to someone else’s personal workspace.
Saved views: Saved views are collaborative snapshots of a workspace. Anyone on your team can view, edit, and save changes to saved workspace views. Use saved workspace views for reviewing and discussing experiments, runs, and more.
The proceeding image shows multiple personal workspaces created by Cécile-parker’s teammates. In this project, there are no saved views:
Saved workspace views
Improve team collaboration with tailored workspace views. Create Saved Views to organize your preferred setup of charts and data.
Create a new saved workspace view
Navigate to a personal workspace or a saved view.
Make edits to the workspace.
Click on the meatball menu (three horizontal dots) at the top right corner of your workspace. Click on Save as a new view.
New saved views appear in the workspace navigation menu.
Update a saved workspace view
Saved changes overwrite the previous state of the saved view. Unsaved changes are not retained. To update a saved workspace view in W&B:
Navigate to a saved view.
Make the desired changes to your charts and data within the workspace.
Click the Save button to confirm your changes.
A confirmation dialog appears when you save your updates to a workspace view. If you prefer not to see this prompt in the future, select the option Do not show this modal next time before confirming your save.
Delete a saved workspace view
Remove saved views that are no longer needed.
Navigate to the saved view you want to remove.
Select the three horizontal lines (…) at the top right of the view.
Choose Delete view.
Confirm the deletion to remove the view from your workspace menu.
Share a workspace view
Share your customized workspace with your team by sharing the workspace URL directly. All users with access to the workspace project can see the saved Views of that workspace.
Programmatically creating workspaces
wandb-workspaces is a Python library for programmatically working with W&B workspaces and reports.
Define a workspace programmatically with wandb-workspaces. wandb-workspaces is a Python library for programmatically working with W&B workspaces and reports.
You can define the workspace’s properties, such as:
Set panel layouts, colors, and section orders.
Configure workspace settings like default x-axis, section order, and collapse states.
Add and customize panels within sections to organize workspace views.
Load and modify existing workspaces using a URL.
Save changes to existing workspaces or save as new views.
Filter, group, and sort runs programmatically using simple expressions.
Customize run appearance with settings like colors and visibility.
Copy views from one workspace to another for integration and reuse.
Install Workspace API
In addition to wandb, ensure that you install wandb-workspaces:
pip install wandb wandb-workspaces
Define and save a workspace view programmatically
import wandb_workspaces.reports.v2 as wr
workspace = ws.Workspace(entity="your-entity", project="your-project", views=[...])
workspace.save()
Learn about the basic building block of W&B, Runs.
A run is a single unit of computation logged by W&B. You can think of a W&B run as an atomic element of your whole project. In other words, each run is a record of a specific computation, such as training a model and logging the results, hyperparameter sweeps, and so forth.
Common patterns for initiating a run include, but are not limited to:
Training a model
Changing a hyperparameter and conducting a new experiment
Conducting a new machine learning experiment with a different model
W&B stores runs that you create into projects. You can view runs and their properties within the run’s project workspace on the W&B App UI. You can also programmatically access run properties with the wandb.Api.Run object.
Anything you log with run.log is recorded in that run. Consider the proceeding code snippet.
import wandb
run = wandb.init(entity="nico", project="awesome-project")
run.log({"accuracy": 0.9, "loss": 0.1})
The first line imports the W&B Python SDK. The second line initializes a run in the project awesome-project under the entity nico. The third line logs the accuracy and loss of the model to that run.
Within the terminal, W&B returns:
wandb: Syncing run earnest-sunset-1
wandb: ⭐️ View project at https://wandb.ai/nico/awesome-project
wandb: 🚀 View run at https://wandb.ai/nico/awesome-project/runs/1jx1ud12
wandb:
wandb:
wandb: Run history:
wandb: accuracy ▁
wandb: loss ▁
wandb:
wandb: Run summary:
wandb: accuracy 0.9
wandb: loss 0.5
wandb:
wandb: 🚀 View run earnest-sunset-1 at: https://wandb.ai/nico/awesome-project/runs/1jx1ud12
wandb: ⭐️ View project at: https://wandb.ai/nico/awesome-project
wandb: Synced 6 W&B file(s), 0 media file(s), 0 artifact file(s) and 0 other file(s)wandb: Find logs at: ./wandb/run-20241105_111006-1jx1ud12/logs
The URL W&B returns in the terminal to redirects you to the run’s workspace in the W&B App UI. Note that the panels generated in the workspace corresponds to the single point.
Logging a metrics at a single point of time might not be that useful. A more realistic example in the case of training discriminative models is to log metrics at regular intervals. For example, consider the proceeding code snippet:
The training script calls run.log 10 times. Each time the script calls run.log, W&B logs the accuracy and loss for that epoch. Selecting the URL that W&B prints from the preceding output, directs you to the run’s workspace in the W&B App UI.
Note that W&B captures the simulated training loop within a single run called jolly-haze-4. This is because the script calls wandb.init method only once.
As another example, during a sweep, W&B explores a hyperparameter search space that you specify. W&B implements each new hyperparameter combination that the sweep creates as a unique run.
Initialize a run
Initialize a W&B run with wandb.init(). The proceeding code snippet shows how to import the W&B Python SDK and initialize a run.
Ensure to replace values enclosed in angle brackets (< >) with your own values:
import wandb
run = wandb.init(entity="<entity>", project="<project>")
When you initialize a run, W&B logs your run to the project you specify for the project field (wandb.init(project="<project>"). W&B creates a new project if the project does not already exist. If the project already exists, W&B stores the run in that project.
If you do not specify a project name, W&B stores the run in a project called Uncategorized.
For example, consider the proceeding code snippet:
import wandb
run = wandb.init(entity="wandbee", project="awesome-project")
The code snippet produces the proceeding output:
🚀 View run exalted-darkness-6 at:
https://wandb.ai/nico/awesome-project/runs/pgbn9y21
Find logs at: wandb/run-20241106_090747-pgbn9y21/logs
Since the preceding code did not specify an argument for the id parameter, W&B creates a unique run ID. Where nico is the entity that logged the run, awesome-project is the name of the project the run is logged to, exalted-darkness-6 is the name of the run, and pgbn9y21 is the run ID.
Notebook users
Specify run.finish() at the end of your run to mark the run finished. This helps ensure that the run is properly logged to your project and does not continue in the background.
import wandb
run = wandb.init(entity="<entity>", project="<project>")
# Training code, logging, and so forthrun.finish()
Each run has a state that describes the current status of the run. See Run states for a full list of possible run states.
Run states
The proceeding table describes the possible states a run can be in:
State
Description
Finished
Run ended and fully synced data, or called wandb.finish()
Failed
Run ended with a non-zero exit status
Crashed
Run stopped sending heartbeats in the internal process, which can happen if the machine crashes
Running
Run is still running and has recently sent a heartbeat
If you do not specify a run ID when you initialize a run, W&B generates a random run ID for you. You can find the unique ID of a run in the W&B App UI.
Navigate to the W&B project you specified when you initialized the run.
Within your project’s workspace, select the Runs tab.
Select the Overview tab.
W&B displays the unique run ID in the Run path field. The run path consists of the name of your team, the name of the project, and the run ID. The unique ID is the last part of the run path.
For example, in the proceeding image, the unique run ID is 9mxi1arc:
Custom run IDs
You can specify your own run ID by passing the id parameter to the wandb.init method.
import wandb
run = wandb.init(entity="<project>", project="<project>", id="<run-id>")
You can use a run’s unique ID to directly navigate to the run’s overview page in the W&B App UI. The proceeding cell shows the URL path for a specific run:
https://wandb.ai/<entity>/<project>/<run-id>
Where values enclosed in angle brackets (< >) are placeholders for the actual values of the entity, project, and run ID.
Name your run
The name of a run is a human-readable, non-unique identifier.
By default, W&B generates a random run name when you initialize a new run. The name of a run appears within your project’s workspace and at the top of the run’s overview page.
Use run names as a way to quickly identify a run in your project workspace.
You can specify a name for your run by passing the name parameter to the wandb.init method.
import wandb
run = wandb.init(entity="<project>", project="<project>", name="<run-name>")
Add a note to a run
Notes that you add to a specific run appear on the run page in the Overview tab and in the table of runs on the project page.
Navigate to your W&B project
Select the Workspace tab from the project sidebar
Select the run you want to add a note to from the run selector
Choose the Overview tab
Select the pencil icon next to the Description field and add your notes
Stop a run
Stop a run from the W&B App or programmatically.
Navigate to the terminal or code editor where you initialized the run.
Press Ctrl+D to stop the run.
For example, following the preceding instructions, your terminal might looks similar to the following:
KeyboardInterrupt
wandb: 🚀 View run legendary-meadow-2 at: https://wandb.ai/nico/history-blaster-4/runs/o8sdbztv
wandb: Synced 5 W&B file(s), 0 media file(s), 0 artifact file(s) and 1 other file(s)wandb: Find logs at: ./wandb/run-20241106_095857-o8sdbztv/logs
Navigate to the W&B App UI to confirm the run is no longer active:
Navigate to the project that your run was logging to.
Select the name of the run.
You can find the name of the run that you stop from the output of your terminal or code editor. For example, in the preceding example, the name of the run is legendary-meadow-2.
3. Choose the **Overview** tab from the project sidebar.
Next to the State field, the run’s state changes from running to Killed.
Navigate to the project that your run is logging to.
Select the run you want to stop within the run selector.
Choose the Overview tab from the project sidebar.
Select the top button next to the State field.
Next to the State field, the run’s state changes from running to Killed.
See State fields for a full list of possible run states.
View logged runs
View a information about a specific run such as the state of the run, artifacts logged to the run, log files recorded during the run, and more.
Navigate to the W&B project you specified when you initialized the run.
Within the project sidebar, select the Workspace tab.
Within the run selector, click the run you want to view, or enter a partial run name to filter for matching runs.
By default, long run names are truncated in the middle for readability. To truncate run names at the beginning or end instead, click the action ... menu at the top of the list of runs, then set Run name cropping to crop the end, middle, or beginning.
Note that the URL path of a specific run has the proceeding format:
Where values enclosed in angle brackets (< >) are placeholders for the actual values of the team name, project name, and run ID.
Overview tab
Use the Overview tab to learn about specific run information in a project, such as:
Author: The W&B entity that creates the run.
Command: The command that initializes the run.
Description: A description of the run that you provided. This field is empty if you do not specify a description when you create the run. You can add a description to a run with the W&B App UI or programmatically with the Python SDK.
Duration: The amount of time the run is actively computing or logging data, excluding any pauses or waiting.
Git repository: The git repository associated with the run. You must enable git to view this field.
Host name: Where W&B computes the run. W&B displays the name of your machine if you initialize the run locally on your machine.
Name: The name of the run.
OS: Operating system that initializes the run.
Python executable: The command that starts the run.
Python version: Specifies the Python version that creates the run.
Run path: Identifies the unique run identifier in the form entity/project/run-ID.
Runtime: Measures the total time from the start to the end of the run. It’s the wall-clock time for the run. Runtime includes any time where the run is paused or waiting for resources, while duration does not.
Start time: The timestamp when you initialize the run.
The System tab shows system metrics tracked for a specific run such as CPU utilization, system memory, disk I/O, network traffic, GPU utilization and more.
For a full list of system metrics W&B tracks, see System metrics.
Delete one or more runs from a project with the W&B App.
Navigate to the project that contains the runs you want to delete.
Select the Runs tab from the project sidebar.
Select the checkbox next to the runs you want to delete.
Choose the Delete button (trash can icon) above the table.
From the modal that appears, choose Delete.
For projects that contain a large number of runs, you can use either the search bar to filter runs you want to delete using Regex or the filter button to filter runs based on their status, tags, or other properties.
5.1 - Add labels to runs with tags
Add tags to label runs with particular features that might not be obvious from the logged metrics or artifact data.
For example, you can add a tag to a run to indicated that run’s model is in_production, that run is preemptible, this run represents the baseline, and so forth.
Add tags to one or more runs
Programmatically or interactively add tags to your runs.
Based on your use case, select the tab below that best fits your needs:
You can add tags to a run when it is created:
import wandb
run = wandb.init(
entity="entity",
project="<project-name>",
tags=["tag1", "tag2"]
)
You can also update the tags after you initialize a run. For example, the proceeding code snippet shows how to update a tag if a particular metrics crosses a pre-defined threshold:
After you create a run, you can update tags using the Public API. For example:
run = wandb.Api().run("{entity}/{project}/{run-id}")
run.tags.append("tag1") # you can choose tags based on run data hererun.update()
This method is best suited to tagging large numbers of runs with the same tag or tags.
Navigate to your project workspace.
Select Runs in the from the project sidebar.
Select one or more runs from the table.
Once you select one or more runs, select the Tag button above the table.
Type the tag you want to add and select the Create new tag checkbox to add the tag.
This method is best suited to applying a tag or tags to a single run manually.
Navigate to your project workspace.
Select a run from the list of runs within your project’s workspace.
Select Overview from the project sidebar.
Select the gray plus icon (+) button next to Tags.
Type a tag you want to add and select Add below the text box to add a new tag.
Remove tags from one or more runs
Tags can also be removed from runs with the W&B App UI.
This method is best suited to removing tags from a large numbers of runs.
In the Run sidebar of the project, select the table icon in the upper-right. This will expand the sidebar into the full runs table.
Hover over a run in the table to see a checkbox on the left or look in the header row for a checkbox to select all runs.
Select the checkbox to enable bulk actions.
Select the runs you want to remove tags.
Select the Tag button above the rows of runs.
Select the checkbox next to a tag to remove it from the run.
In the left sidebar of the Run page, select the top Overview tab. The tags on the run are visible here.
Hover over a tag and select the “x” to remove it from the run.
5.2 - Filter and search runs
How to use the sidebar and table on the project page
Use your project page to gain insights from runs logged to W&B.
Filter runs
Filter runs based on their status, tags, or other properties with the filter button.
Filter runs with tags
Filter runs based on their tags with the filter button.
Filter runs with regex
If regex doesn’t provide you the desired results, you can make use of tags to filter out the runs in Runs Table. Tags can be added either on run creation or after they’re finished. Once the tags are added to a run, you can add a tag filter as shown in the gif below.
Search run names
Use regex to find runs with the regex you specify. When you type a query in the search box, that will filter down the visible runs in the graphs on the workspace as well as filtering the rows of the table.
Sort runs by minimum and maximum values
Sort the runs table by the minimum or maximum value of a logged metric. This is particularly useful if you want to view the best (or worst) recorded value.
The following steps describe how to sort the run table by a specific metric based on the minimum or maximum recorded value:
Hover your mouse over the column with the metric you want to sort with.
Select the kebob menu (three vertical lines).
From the dropdown, select either Show min or Show max.
From the same dropdown, select Sort by asc or Sort by desc to sort in ascending or descending order, respectively.
Search End Time for runs
We provide a column named End Time that logs that last heartbeat from the client process. The field is hidden by default.
Export runs table to CSV
Export the table of all your runs, hyperparameters, and summary metrics to a CSV with the download button.
5.3 - Fork a run
Forking a W&B run
The ability to fork a run is in private preview. Contact W&B Support at support@wandb.com to request access to this feature.
Use fork_from when you initialize a run with wandb.init() to “fork” from an existing W&B run. When you fork from a run, W&B creates a new run using the run ID and step of the source run.
Forking a run enables you to explore different parameters or models from a specific point in an experiment without impacting the original run.
Forking a run requires wandb SDK version >= 0.16.5
Forking a run requires monotonically increasing steps. You can not use non-monotonic steps defined with define_metric() to set a fork point because it would disrupt the essential chronological order of run history and system metrics.
Start a forked run
To fork a run, use the fork_from argument in wandb.init() and specify the source run ID and the step from the source run to fork from:
import wandb
# Initialize a run to be forked lateroriginal_run = wandb.init(project="your_project_name", entity="your_entity_name")
# ... perform training or logging ...original_run.finish()
# Fork the run from a specific stepforked_run = wandb.init(
project="your_project_name",
entity="your_entity_name",
fork_from=f"{original_run.id}?_step=200",
)
Using an immutable run ID
Use an immutable run ID to ensure you have a consistent and unchanging reference to a specific run. Follow these steps to obtain the immutable run ID from the user interface:
Access the Overview Tab: Navigate to the Overview tab on the source run’s page.
Copy the Immutable Run ID: Click on the ... menu (three dots) located in the top-right corner of the Overview tab. Select the Copy Immutable Run ID option from the dropdown menu.
By following these steps, you will have a stable and unchanging reference to the run, which can be used for forking a run.
Continue from a forked run
After initializing a forked run, you can continue logging to the new run. You can log the same metrics for continuity and introduce new metrics.
For example, the following code example shows how to first fork a run and then how to log metrics to the forked run starting from a training step of 200:
import wandb
import math
# Initialize the first run and log some metricsrun1 = wandb.init("your_project_name", entity="your_entity_name")
for i in range(300):
run1.log({"metric": i})
run1.finish()
# Fork from the first run at a specific step and log the metric starting from step 200run2 = wandb.init(
"your_project_name", entity="your_entity_name", fork_from=f"{run1.id}?_step=200")
# Continue logging in the new run# For the first few steps, log the metric as is from run1# After step 250, start logging the spikey patternfor i in range(200, 300):
if i <250:
run2.log({"metric": i}) # Continue logging from run1 without spikeselse:
# Introduce the spikey behavior starting from step 250 subtle_spike = i + (2* math.sin(i /3.0)) # Apply a subtle spikey pattern run2.log({"metric": subtle_spike})
# Additionally log the new metric at all steps run2.log({"additional_metric": i *1.1})
run2.finish()
Rewind and forking compatibility
Forking compliments a rewind by providing more flexibility in managing and experimenting with your runs.
When you fork from a run, W&B creates a new branch off a run at a specific point to try different parameters or models.
When you rewind a run, W&B let’s you correct or modify the run history itself.
5.4 - Group runs into experiments
Group training and evaluation runs into larger experiments
Group individual jobs into experiments by passing a unique group name to wandb.init().
Use cases
Distributed training: Use grouping if your experiments are split up into different pieces with separate training and evaluation scripts that should be viewed as parts of a larger whole.
Multiple processes: Group multiple smaller processes together into an experiment.
K-fold cross-validation: Group together runs with different random seeds to see a larger experiment. Here’s an example of k-fold cross-validation with sweeps and grouping.
There are three ways to set grouping:
1. Set group in your script
Pass an optional group and job_type to wandb.init(). This gives you a dedicated group page for each experiment, which contains the individual runs. For example:wandb.init(group="experiment_1", job_type="eval")
2. Set a group environment variable
Use WANDB_RUN_GROUP to specify a group for your runs as an environment variable. For more on this, check our docs for Environment Variables. Group should be unique within your project and shared by all runs in the group. You can use wandb.util.generate_id() to generate a unique 8 character string to use in all your processes— for example, os.environ["WANDB_RUN_GROUP"] = "experiment-" + wandb.util.generate_id()
3. Toggle grouping in the UI
You can dynamically group by any config column. For example, if you use wandb.config to log batch size or learning rate, you can then group by those hyperparameters dynamically in the web app.
Distributed training with grouping
Suppose you set grouping in wandb.init(), we will group runs by default in the UI. You can toggle this on and off by clicking the Group button at the top of the table. Here’s an example project generated from sample code where we set grouping. You can click on each “Group” row in the sidebar to get to a dedicated group page for that experiment.
From the project page above, you can click a Group in the left sidebar to get to a dedicated page like this one:
Grouping dynamically in the UI
You can group runs by any column, for example by hyperparameter. Here’s an example of what that looks like:
Sidebar: Runs are grouped by the number of epochs.
Graphs: Each line represents the group’s mean, and the shading indicates the variance. This behavior can be changed in the graph settings.
Turn off grouping
Click the grouping button and clear group fields at any time, which returns the table and graphs to their ungrouped state.
Grouping graph settings
Click the edit button in the upper right corner of a graph and select the Advanced tab to change the line and shading. You can select the mean, minimum, or maximum value for the line in each group. For the shading, you can turn off shading, and show the min and max, the standard deviation, and the standard error.
5.5 - Move runs
Move runs between your projects or to a team you are a member of.
Move runs between your projects
To move runs from one project to another:
Navigate to the project that contains the runs you want to move.
Select the Runs tab from the project sidebar.
Select the checkbox next to the runs you want to move.
Choose the Move button above the table.
Select the destination project from the dropdown.
Move runs to a team
Move runs to a team you are a member of:
Navigate to the project that contains the runs you want to move.
Select the Runs tab from the project sidebar.
Select the checkbox next to the runs you want to move.
Choose the Move button above the table.
Select the destination team and project from the dropdown.
5.6 - Resume a run
Resume a paused or exited W&B Run
Specify how a run should behave in the event that run stops or crashes. To resume or enable a run to automatically resume, you will need to specify the unique run ID associated with that run for the id parameter:
run = wandb.init(entity="<entity>", \
project="<project>", id="<run ID>", resume="<resume>")
W&B encourages you to provide the name of the W&B Project where you want to store the run.
Pass one of the following arguments to the resume parameter to determine how W&B should respond. In each case, W&B first checks if the run ID already exists.
Argument
Description
Run ID exists
Run ID does not exist
Use case
"must"
W&B must resume run specified by the run ID.
W&B resumes run with the same run ID.
W&B raises an error.
Resume a run that must use the same run ID.
"allow"
Allow W&B to resume run if run ID exists.
W&B resumes run with the same run ID.
W&B initializes a new run with specified run ID.
Resume a run without overriding an existing run.
"never"
Never allow W&B to resume a run specified by run ID.
W&B raises an error.
W&B initializes a new run with specified run ID.
You can also specify resume="auto" to let W&B to automatically try to restart the run on your behalf. However, you will need to ensure that you restart your run from the same directory. See the Enable runs to automatically resume section for more information.
For all the examples below, replace values enclosed within <> with your own.
Resume a run that must use the same run ID
If a run is stopped, crashes, or fails, you can resume it using the same run ID. To do so, initialize a run and specify the following:
Set the resume parameter to "must" (resume="must")
Provide the run ID of the run that stopped or crashed
The following code snippet shows how to accomplish this with the W&B Python SDK:
run = wandb.init(entity="<entity>", \
project="<project>", id="<run ID>", resume="must")
Unexpected results will occur if multiple processes use the same id concurrently.
Resume a run that stopped or crashed without overriding the existing run. This is especially helpful if your process doesn’t exit successfully. The next time you start W&B, W&B will start logging from the last step.
Set the resume parameter to "allow" (resume="allow") when you initialize a run with W&B. Provide the run ID of the run that stopped or crashed. The following code snippet shows how to accomplish this with the W&B Python SDK:
import wandb
run = wandb.init(entity="<entity>", \
project="<project>", id="<run ID>", resume="allow")
Enable runs to automatically resume
The following code snippet shows how to enable runs to automatically resume with the Python SDK or with environment variables.
The following code snippet shows how to specify a W&B run ID with the Python SDK.
Replace values enclosed within <> with your own:
run = wandb.init(entity="<entity>", \
project="<project>", id="<run ID>", resume="<resume>")
The following example shows how to specify the W&B WANDB_RUN_ID variable in a bash script:
Within your terminal, you could run the shell script along with the W&B run ID. The following code snippet passes the run ID akj172:
sh run_experiment.sh akj172
Automatic resuming only works if the process is restarted on top of the same filesystem as the failed process.
For example, suppose you execute a python script called train.py in a directory called Users/AwesomeEmployee/Desktop/ImageClassify/training/. Within train.py, the script creates a run that enables automatic resuming. Suppose next that the training script is stopped. To resume this run, you would need to restart your train.py script within Users/AwesomeEmployee/Desktop/ImageClassify/training/ .
If you can not share a filesystem, specify the WANDB_RUN_ID environment variable or pass the run ID with the W&B Python SDK. See the Custom run IDs section in the “What are runs?” page for more information on run IDs.
Resume preemptible Sweeps runs
Automatically requeue interrupted sweep runs. This is particularly useful if you run a sweep agent in a compute environment that is subject to preemption such as a SLURM job in a preemptible queue, an EC2 spot instance, or a Google Cloud preemptible VM.
Use the mark_preempting function to enable W&B to automatically requeue interrupted sweep runs. For example, the following code snippet
run = wandb.init() # Initialize a runrun.mark_preempting()
The following table outlines how W&B handles runs based on the exit status of the a sweep run.
Status
Behavior
Status code 0
Run is considered to have terminated successfully and it will not be requeued.
Nonzero status
W&B automatically appends the run to a run queue associated with the sweep.
No status
Run is added to the sweep run queue. Sweep agents consume runs off the run queue until the queue is empty. Once the queue is empty, the sweep queue resumes generating new runs based on the sweep search algorithm.
5.7 - Rewind a run
Rewind
Rewind a run
The option to rewind a run is in private preview. Contact W&B Support at support@wandb.com to request access to this feature.
W&B currently does not support:
Log rewind: Logs are reset in the new run segment.
System metrics rewind: W&B logs only new system metrics after the rewind point.
Artifact association: W&B associates artifacts with the source run that produces them.
To rewind a run, you must have W&B Python SDK version >= 0.17.1.
You must use monotonically increasing steps. You can not use non-monotonic steps defined with define_metric() because it disrupts the required chronological order of run history and system metrics.
Rewind a run to correct or modify the history of a run without losing the original data. In addition, when you
rewind a run, you can log new data from that point in time. W&B recomputes the summary metrics for the run you rewind based on the newly logged history. This means the following behavior:
History truncation: W&B truncates the history to the rewind point, allowing new data logging.
Summary metrics: Recomputed based on the newly logged history.
Configuration preservation: W&B preserves the original configurations and you can merge new configurations.
When you rewind a run, W&B resets the state of the run to the specified step, preserving the original data and maintaining a consistent run ID. This means that:
Run archiving: W&B archives the original runs. Runs are accessible from the Run Overview tab.
Artifact association: Associates artifacts with the run that produce them.
Immutable run IDs: Introduced for consistent forking from a precise state.
Copy immutable run ID: A button to copy the immutable run ID for improved run management.
Rewind and forking compatibility
Forking compliments a rewind.
When you fork from a run, W&B creates a new branch off a run at a specific point to try different parameters or models.
When you rewind a run, W&B lets you correct or modify the run history itself.
Rewind a run
Use resume_from with wandb.init() to “rewind” a run’s history to a specific step. Specify the name of the run and the step you want to rewind from:
import wandb
import math
# Initialize the first run and log some metrics# Replace with your_project_name and your_entity_name!run1 = wandb.init(project="your_project_name", entity="your_entity_name")
for i in range(300):
run1.log({"metric": i})
run1.finish()
# Rewind from the first run at a specific step and log the metric starting from step 200run2 = wandb.init(project="your_project_name", entity="your_entity_name", resume_from=f"{run1.id}?_step=200")
# Continue logging in the new run# For the first few steps, log the metric as is from run1# After step 250, start logging the spikey patternfor i in range(200, 300):
if i <250:
run2.log({"metric": i, "step": i}) # Continue logging from run1 without spikeselse:
# Introduce the spikey behavior starting from step 250 subtle_spike = i + (2* math.sin(i /3.0)) # Apply a subtle spikey pattern run2.log({"metric": subtle_spike, "step": i})
# Additionally log the new metric at all steps run2.log({"additional_metric": i *1.1, "step": i})
run2.finish()
View an archived run
After you rewind a run, you can explore archived run with the W&B App UI. Follow these steps to view archived runs:
Access the Overview Tab: Navigate to the Overview tab on the run’s page. This tab provides a comprehensive view of the run’s details and history.
Locate the Forked From field: Within the Overview tab, find the Forked From field. This field captures the history of the resumptions. The Forked From field includes a link to the source run, allowing you to trace back to the original run and understand the entire rewind history.
By using the Forked From field, you can effortlessly navigate the tree of archived resumptions and gain insights into the sequence and origin of each rewind.
Fork from a run that you rewind
To fork from a rewound run, use the fork_from argument in wandb.init() and specify the source run ID and the step from the source run to fork from:
import wandb
# Fork the run from a specific stepforked_run = wandb.init(
project="your_project_name",
entity="your_entity_name",
fork_from=f"{rewind_run.id}?_step=500",
)
# Continue logging in the new runfor i in range(500, 1000):
forked_run.log({"metric": i*3})
forked_run.finish()
5.8 - Send an alert
Send alerts, triggered from your Python code, to your Slack or email
Create alerts with Slack or email if your run crashes or with a custom trigger. For example, you can create an alert if the gradient of your training loop starts to blow up (reports NaN) or a step in your ML pipeline completes. Alerts apply to all projects where you initialize runs, including both personal and team projects.
And then see W&B Alerts messages in Slack (or your email):
How to create an alert
The following guide only applies to alerts in multi-tenant cloud.
If you’re using W&B Server in your Private Cloud or on W&B Dedicated Cloud, then please refer to this documentation to setup Slack alerts.
Turn on Scriptable run alerts to receive alerts from run.alert()
Use Connect Slack to pick a Slack channel to post alerts. We recommend the Slackbot channel because it keeps the alerts private.
Email will go to the email address you used when you signed up for W&B. We recommend setting up a filter in your email so all these alerts go into a folder and don’t fill up your inbox.
You will only have to do this the first time you set up W&B Alerts, or when you’d like to modify how you receive alerts.
2. Add run.alert() to your code
Add run.alert() to your code (either in a Notebook or Python script) wherever you’d like it to be triggered
import wandb
run = wandb.init()
run.alert(title="High Loss", text="Loss is increasing rapidly")
3. Check your Slack or email
Check your Slack or emails for the alert message. If you didn’t receive any, make sure you’ve got emails or Slack turned on for Scriptable Alerts in your User Settings
Example
This simple alert sends a warning when accuracy falls below a threshold. In this example, it only sends alerts at least 5 minutes apart.
import wandb
from wandb import AlertLevel
run = wandb.init()
if acc < threshold:
run.alert(
title="Low accuracy",
text=f"Accuracy {acc} is below the acceptable threshold {threshold}",
level=AlertLevel.WARN,
wait_duration=300,
)
How to tag or mention users
Use the at sign @ followed by the Slack user ID to tag yourself or your colleagues in either the title or the text of the alert. You can find a Slack user ID from their Slack profile page.
run.alert(title="Loss is NaN", text=f"Hey <@U1234ABCD> loss has gone to NaN")
Team alerts
Team admins can set up alerts for the team on the team settings page: wandb.ai/teams/your-team.
Team alerts apply to everyone on your team. W&B recommends using the Slackbot channel because it keeps alerts private.
Change Slack channel to send alerts to
To change what channel alerts are sent to, click Disconnect Slack and then reconnect. After you reconnect, pick a different Slack channel.
6 - Log objects and media
Keep track of metrics, videos, custom plots, and more
Log a dictionary of metrics, media, or custom objects to a step with the W&B Python SDK. W&B collects the key-value pairs during each step and stores them in one unified dictionary each time you log data with wandb.log(). Data logged from your script is saved locally to your machine in a directory called wandb, then synced to the W&B cloud or your private server.
Key-value pairs are stored in one unified dictionary only if you pass the same value for each step. W&B writes all of the collected keys and values to memory if you log a different value for step.
Each call to wandb.log is a new step by default. W&B uses steps as the default x-axis when it creates charts and panels. You can optionally create and use a custom x-axis or capture a custom summary metric. For more information, see Customize log axes.
Use wandb.log() to log consecutive values for each step: 0, 1, 2, and so on. It is not possible to write to a specific history step. W&B only writes to the “current” and “next” step.
Automatically logged data
W&B automatically logs the following information during a W&B Experiment:
System metrics: CPU and GPU utilization, network, etc. These are shown in the System tab on the run page. For the GPU, these are fetched with nvidia-smi.
Command line: The stdout and stderr are picked up and show in the logs tab on the run page.
Git commit: Pick up the latest git commit and see it on the overview tab of the run page, as well as a diff.patch file if there are any uncommitted changes.
Dependencies: The requirements.txt file will be uploaded and shown on the files tab of the run page, along with any files you save to the wandb directory for the run.
What data is logged with specific W&B API calls?
With W&B, you can decide exactly what you want to log. The following lists some commonly logged objects:
Datasets: You have to specifically log images or other dataset samples for them to stream to W&B.
Plots: Use wandb.plot with wandb.log to track charts. See Log Plots for more information.
Tables: Use wandb.Table to log data to visualize and query with W&B. See Log Tables for more information.
PyTorch gradients: Add wandb.watch(model) to see gradients of the weights as histograms in the UI.
Configuration information: Log hyperparameters, a link to your dataset, or the name of the architecture you’re using as config parameters, passed in like this: wandb.init(config=your_config_dictionary). See the PyTorch Integrations page for more information.
Metrics: Use wandb.log to see metrics from your model. If you log metrics like accuracy and loss from inside your training loop, you’ll get live updating graphs in the UI.
Common workflows
Compare the best accuracy: To compare the best value of a metric across runs, set the summary value for that metric. By default, summary is set to the last value you logged for each key. This is useful in the table in the UI, where you can sort and filter runs based on their summary metrics, to help compare runs in a table or bar chart based on their best accuracy, instead of final accuracy. For example: wandb.run.summary["best_accuracy"] = best_accuracy
Multiple metrics on one chart: Log multiple metrics in the same call to wandb.log, like this: wandb.log({"acc'": 0.9, "loss": 0.1}) and they will both be available to plot against in the UI
Custom x-axis: Add a custom x-axis to the same log call to visualize your metrics against a different axis in the W&B dashboard. For example: wandb.log({'acc': 0.9, 'epoch': 3, 'batch': 117}). To set the default x-axis for a given metric use Run.define_metric()
Create and track plots from machine learning experiments.
Using the methods in wandb.plot, you can track charts with wandb.log, including charts that change over time during training. To learn more about our custom charting framework, check out this guide.
Basic charts
These simple charts make it easy to construct basic visualizations of metrics and results.
wandb.plot.line()
Log a custom line plot—a list of connected and ordered points on arbitrary axes.
data = [[x, y] for (x, y) in zip(x_values, y_values)]
table = wandb.Table(data=data, columns=["x", "y"])
wandb.log(
{
"my_custom_plot_id": wandb.plot.line(
table, "x", "y", title="Custom Y vs X Line Plot" )
}
)
You can use this to log curves on any two dimensions. If you’re plotting two lists of values against each other, the number of values in the lists must match exactly. For example, each point must have an x and a y.
Log a custom scatter plot—a list of points (x, y) on a pair of arbitrary axes x and y.
data = [[x, y] for (x, y) in zip(class_x_scores, class_y_scores)]
table = wandb.Table(data=data, columns=["class_x", "class_y"])
wandb.log({"my_custom_id": wandb.plot.scatter(table, "class_x", "class_y")})
You can use this to log scatter points on any two dimensions. If you’re plotting two lists of values against each other, the number of values in the lists must match exactly. For example, each point must have an x and a y.
Log a custom histogram—sort a list of values into bins by count/frequency of occurrence—natively in a few lines. Let’s say I have a list of prediction confidence scores (scores) and want to visualize their distribution:
data = [[s] for s in scores]
table = wandb.Table(data=data, columns=["scores"])
wandb.log({"my_histogram": wandb.plot.histogram(table, "scores", title="Histogram")})
You can use this to log arbitrary histograms. Note that data is a list of lists, intended to support a 2D array of rows and columns.
Note that the number of x and y points must match exactly. You can supply one list of x values to match multiple lists of y values, or a separate list of x values for each list of y values.
These preset charts have built-in wandb.plot methods that make it quick and easy to log charts directly from your script and see the exact information you’re looking for in the UI.
cm = wandb.plot.confusion_matrix(
y_true=ground_truth, preds=predictions, class_names=class_names
)
wandb.log({"conf_mat": cm})
You can log this wherever your code has access to:
a model’s predicted labels on a set of examples (preds) or the normalized probability scores (probs). The probabilities must have the shape (number of examples, number of classes). You can supply either probabilities or predictions but not both.
the corresponding ground truth labels for those examples (y_true)
a full list of the labels/class names as strings of class_names. Examples: class_names=["cat", "dog", "bird"] if index 0 is cat, 1 is dog, 2 is bird.
For full customization, tweak a built-in Custom Chart preset or create a new preset, then save the chart. Use the chart ID to log data to that custom preset directly from your script.
# Create a table with the columns to plottable = wandb.Table(data=data, columns=["step", "height"])
# Map from the table's columns to the chart's fieldsfields = {"x": "step", "value": "height"}
# Use the table to populate the new custom chart preset# To use your own saved chart preset, change the vega_spec_name# To edit the title, change the string_fieldsmy_custom_chart = wandb.plot_table(
vega_spec_name="carey/new_chart",
data_table=table,
fields=fields,
string_fields={"title": "Height Histogram"},
)
Just pass a matplotlib plot or figure object to wandb.log(). By default we’ll convert the plot into a Plotly plot. If you’d rather log the plot as an image, you can pass the plot into wandb.Image. We also accept Plotly charts directly.
If you’re getting an error “You attempted to log an empty plot” then you can store the figure separately from the plot with fig = plt.figure() and then log fig in your call to wandb.log.
Log custom HTML to W&B Tables
W&B supports logging interactive charts from Plotly and Bokeh as HTML and adding them to Tables.
Log Plotly figures to Tables as HTML
You can log interactive Plotly charts to wandb Tables by converting them to HTML.
import wandb
import plotly.express as px
# Initialize a new runrun = wandb.init(project="log-plotly-fig-tables", name="plotly_html")
# Create a tabletable = wandb.Table(columns=["plotly_figure"])
# Create path for Plotly figurepath_to_plotly_html ="./plotly_figure.html"# Example Plotly figurefig = px.scatter(x=[0, 1, 2, 3, 4], y=[0, 1, 4, 9, 16])
# Write Plotly figure to HTML# Set auto_play to False prevents animated Plotly charts# from playing in the table automaticallyfig.write_html(path_to_plotly_html, auto_play=False)
# Add Plotly figure as HTML file into Tabletable.add_data(wandb.Html(path_to_plotly_html))
# Log Tablerun.log({"test_table": table})
wandb.finish()
Log Bokeh figures to Tables as HTML
You can log interactive Bokeh charts to wandb Tables by converting them to HTML.
Use define_metric to set a custom x axis.Custom x-axes are useful in contexts where you need to log to different time steps in the past during training, asynchronously. For example, this can be useful in RL where you may track the per-episode reward and a per-step reward.
By default, all metrics are logged against the same x-axis, which is the W&B internal step. Sometimes, you might want to log to a previous step, or use a different x-axis.
Here’s an example of setting a custom x-axis metric, instead of the default step.
import wandb
wandb.init()
# define our custom x axis metricwandb.define_metric("custom_step")
# define which metrics will be plotted against itwandb.define_metric("validation_loss", step_metric="custom_step")
for i in range(10):
log_dict = {
"train_loss": 1/ (i +1),
"custom_step": i**2,
"validation_loss": 1/ (i +1),
}
wandb.log(log_dict)
The x-axis can be set using globs as well. Currently, only globs that have string prefixes are available. The following example will plot all logged metrics with the prefix "train/" to the x-axis "train/step":
import wandb
wandb.init()
# define our custom x axis metricwandb.define_metric("train/step")
# set all other train/ metrics to use this stepwandb.define_metric("train/*", step_metric="train/step")
for i in range(10):
log_dict = {
"train/step": 2**i, # exponential growth w/ internal W&B step"train/loss": 1/ (i +1), # x-axis is train/step"train/accuracy": 1- (1/ (1+ i)), # x-axis is train/step"val/loss": 1/ (1+ i), # x-axis is internal wandb step }
wandb.log(log_dict)
6.3 - Log distributed training experiments
Use W&B to log distributed training experiments with multiple GPUs.
In distributed training, models are trained using multiple GPUs in parallel. W&B supports two patterns to track distributed training experiments:
One process: Initialize W&B (wandb.init) and log experiments (wandb.log) from a single process. This is a common solution for logging distributed training experiments with the PyTorch Distributed Data Parallel (DDP) Class. In some cases, users funnel data over from other processes using a multiprocessing queue (or another communication primitive) to the main logging process.
Many processes: Initialize W&B (wandb.init) and log experiments (wandb.log) in every process. Each process is effectively a separate experiment. Use the group parameter when you initialize W&B (wandb.init(group='group-name')) to define a shared experiment and group the logged values together in the W&B App UI.
The proceeding examples demonstrate how to track metrics with W&B using PyTorch DDP on two GPUs on a single machine. PyTorch DDP (DistributedDataParallel intorch.nn) is a popular library for distributed training. The basic principles apply to any distributed training setup, but the details of implementation may differ.
Explore the code behind these examples in the W&B GitHub examples repository here. Specifically, see the log-dpp.py Python script for information on how to implement one process and many process methods.
Method 1: One process
In this method we track only a rank 0 process. To implement this method, initialize W&B (wandb.init), commence a W&B Run, and log metrics (wandb.log) within the rank 0 process. This method is simple and robust, however, this method does not log model metrics from other processes (for example, loss values or inputs from their batches). System metrics, such as usage and memory, are still logged for all GPUs since that information is available to all processes.
Use this method to only track metrics available from a single process. Typical examples include GPU/CPU utilization, behavior on a shared validation set, gradients and parameters, and loss values on representative data examples.
Within our sample Python script (log-ddp.py), we check to see if the rank is 0. To do so, we first launch multiple processes with torch.distributed.launch. Next, we check the rank with the --local_rank command line argument. If the rank is set to 0, we set up wandb logging conditionally in the train() function. Within our Python script, we use the following check:
if __name__ =="__main__":
# Get args args = parse_args()
if args.local_rank ==0: # only on main process# Initialize wandb run run = wandb.init(
entity=args.entity,
project=args.project,
)
# Train model with DDP train(args, run)
else:
train(args)
Explore the W&B App UI to view an example dashboard of metrics tracked from a single process. The dashboard displays system metrics such as temperature and utilization, that were tracked for both GPUs.
However, the loss values as a function epoch and batch size were only logged from a single GPU.
Method 2: Many processes
In this method, we track each process in the job, calling wandb.init() and wandb.log() from each process separately. We suggest you call wandb.finish() at the end of training, to mark that the run has completed so that all processes exit properly.
This method makes more information accessible for logging. However, note that multiple W&B Runs are reported in the W&B App UI. It might be difficult to keep track of W&B Runs across multiple experiments. To mitigate this, provide a value to the group parameter when you initialize W&B to keep track of which W&B Run belongs to a given experiment. For more information about how to keep track of training and evaluation W&B Runs in experiments, see Group Runs.
Use this method if you want to track metrics from individual processes. Typical examples include the data and predictions on each node (for debugging data distribution) and metrics on individual batches outside of the main node. This method is not necessary to get system metrics from all nodes nor to get summary statistics available on the main node.
The following Python code snippet demonstrates how to set the group parameter when you initialize W&B:
if __name__ =="__main__":
# Get args args = parse_args()
# Initialize run run = wandb.init(
entity=args.entity,
project=args.project,
group="DDP", # all runs for the experiment in one group )
# Train model with DDP train(args, run)
Explore the W&B App UI to view an example dashboard of metrics tracked from multiple processes. Note that there are two W&B Runs grouped together in the left sidebar. Click on a group to view the dedicated group page for the experiment. The dedicated group page displays metrics from each process separately.
The preceding image demonstrates the W&B App UI dashboard. On the sidebar we see two experiments. One labeled ’null’ and a second (bound by a yellow box) called ‘DPP’. If you expand the group (select the Group dropdown) you will see the W&B Runs that are associated to that experiment.
Use W&B Service to avoid common distributed training issues
There are two common issues you might encounter when using W&B and distributed training:
Hanging at the beginning of training - A wandb process can hang if the wandb multiprocessing interferes with the multiprocessing from distributed training.
Hanging at the end of training - A training job might hang if the wandb process does not know when it needs to exit. Call the wandb.finish() API at the end of your Python script to tell W&B that the Run finished. The wandb.finish() API will finish uploading data and will cause W&B to exit.
We recommend using the wandb service to improve the reliability of your distributed jobs. Both of the preceding training issues are commonly found in versions of the W&B SDK where wandb service is unavailable.
Enable W&B Service
Depending on your version of the W&B SDK, you might already have W&B Service enabled by default.
W&B SDK 0.13.0 and above
W&B Service is enabled by default for versions of the W&B SDK 0.13.0 and above.
W&B SDK 0.12.5 and above
Modify your Python script to enable W&B Service for W&B SDK version 0.12.5 and above. Use the wandb.require method and pass the string "service" within your main function:
if __name__ =="__main__":
main()
defmain():
wandb.require("service")
# rest-of-your-script-goes-here
For optimal experience we do recommend you upgrade to the latest version.
W&B SDK 0.12.4 and below
Set the WANDB_START_METHOD environment variable to "thread" to use multithreading instead if you use a W&B SDK version 0.12.4 and below.
Example use cases for multiprocessing
The following code snippets demonstrate common methods for advanced distributed use cases.
Spawn process
Use the wandb.setup()[line 8]method in your main function if you initiate a W&B Run in a spawned process:
import multiprocessing as mp
defdo_work(n):
run = wandb.init(config=dict(n=n))
run.log(dict(this=n * n))
defmain():
wandb.setup()
pool = mp.Pool(processes=4)
pool.map(do_work, range(4))
if __name__ =="__main__":
main()
Share a W&B Run
Pass a W&B Run object as an argument to share W&B Runs between processes:
defdo_work(run):
run.log(dict(this=1))
defmain():
run = wandb.init()
p = mp.Process(target=do_work, kwargs=dict(run=run))
p.start()
p.join()
if __name__ =="__main__":
main()
Note that we can not guarantee the logging order. Synchronization should be done by the author of the script.
6.4 - Log media and objects
Log rich media, from 3D point clouds and molecules to HTML and histograms
We support images, video, audio, and more. Log rich media to explore your results and visually compare your runs, models, and datasets. Read on for examples and how-to guides.
Looking for reference docs for our media types? You want this page.
In order to log media objects with the W&B SDK, you may need to install additional dependencies.
You can install these dependencies by running the following command:
pip install wandb[media]
Images
Log images to track inputs, outputs, filter weights, activations, and more.
Images can be logged directly from NumPy arrays, as PIL images, or from the filesystem.
Each time you log images from a step, we save them to show in the UI. Expand the image panel, and use the step slider to look at images from different steps. This makes it easy to compare how a model’s output changes during training.
It’s recommended to log fewer than 50 images per step to prevent logging from becoming a bottleneck during training and image loading from becoming a bottleneck when viewing results.
We assume the image is gray scale if the last dimension is 1, RGB if it’s 3, and RGBA if it’s 4. If the array contains floats, we convert them to integers between 0 and 255. If you want to normalize your images differently, you can specify the mode manually or just supply a PIL.Image, as described in the “Logging PIL Images” tab of this panel.
For full control over the conversion of arrays to images, construct the PIL.Image yourself and provide it directly.
images = [PIL.Image.fromarray(image) for image in image_array]
wandb.log({"examples": [wandb.Image(image) for image in images]})
For even more control, create images however you like, save them to disk, and provide a filepath.
im = PIL.fromarray(...)
rgb_im = im.convert("RGB")
rgb_im.save("myimage.jpg")
wandb.log({"example": wandb.Image("myimage.jpg")})
Image overlays
Log semantic segmentation masks and interact with them (altering opacity, viewing changes over time, and more) via the W&B UI.
To log an overlay, you’ll need to provide a dictionary with the following keys and values to the masks keyword argument of wandb.Image:
one of two keys representing the image mask:
"mask_data": a 2D NumPy array containing an integer class label for each pixel
"path": (string) a path to a saved image mask file
"class_labels": (optional) a dictionary mapping the integer class labels in the image mask to their readable class names
To log multiple masks, log a mask dictionary with multiple keys, as in the code snippet below.
To log a bounding box, you’ll need to provide a dictionary with the following keys and values to the boxes keyword argument of wandb.Image:
box_data: a list of dictionaries, one for each box. The box dictionary format is described below.
position: a dictionary representing the position and size of the box in one of two formats, as described below. Boxes need not all use the same format.
Option 1:{"minX", "maxX", "minY", "maxY"}. Provide a set of coordinates defining the upper and lower bounds of each box dimension.
Option 2:{"middle", "width", "height"}. Provide a set of coordinates specifying the middle coordinates as [x,y], and width and height as scalars.
class_id: an integer representing the class identity of the box. See class_labels key below.
scores: a dictionary of string labels and numeric values for scores. Can be used for filtering boxes in the UI.
domain: specify the units/format of the box coordinates. Set this to “pixel” if the box coordinates are expressed in pixel space, such as integers within the bounds of the image dimensions. By default, the domain is assumed to be a fraction/percentage of the image, expressed as a floating point number between 0 and 1.
box_caption: (optional) a string to be displayed as the label text on this box
class_labels: (optional) A dictionary mapping class_ids to strings. By default we will generate class labels class_0, class_1, etc.
Check out this example:
class_id_to_label = {
1: "car",
2: "road",
3: "building",
# ...}
img = wandb.Image(
image,
boxes={
"predictions": {
"box_data": [
{
# one box expressed in the default relative/fractional domain"position": {"minX": 0.1, "maxX": 0.2, "minY": 0.3, "maxY": 0.4},
"class_id": 2,
"box_caption": class_id_to_label[2],
"scores": {"acc": 0.1, "loss": 1.2},
# another box expressed in the pixel domain# (for illustration purposes only, all boxes are likely# to be in the same domain/format)"position": {"middle": [150, 20], "width": 68, "height": 112},
"domain": "pixel",
"class_id": 3,
"box_caption": "a building",
"scores": {"acc": 0.5, "loss": 0.7},
# ...# Log as many boxes an as needed }
],
"class_labels": class_id_to_label,
},
# Log each meaningful group of boxes with a unique key name"ground_truth": {
# ... },
},
)
wandb.log({"driving_scene": img})
Image overlays in Tables
To log Segmentation Masks in tables, you will need to provide a wandb.Image object for each row in the table.
If a sequence of numbers, such as a list, array, or tensor, is provided as the first argument, we will construct the histogram automatically by calling np.histogram. All arrays/tensors are flattened. You can use the optional num_bins keyword argument to override the default of 64 bins. The maximum number of bins supported is 512.
In the UI, histograms are plotted with the training step on the x-axis, the metric value on the y-axis, and the count represented by color, to ease comparison of histograms logged throughout training. See the “Histograms in Summary” tab of this panel for details on logging one-off histograms.
wandb.log({"gradients": wandb.Histogram(grads)})
If you want more control, call np.histogram and pass the returned tuple to the np_histogram keyword argument.
If histograms are in your summary they will appear on the Overview tab of the Run Page. If they are in your history, we plot a heatmap of bins over time on the Charts tab.
3D visualizations
Log 3D point clouds and Lidar scenes with bounding boxes. Pass in a NumPy array containing coordinates and colors for the points to render.
boxes is a NumPy array of python dictionaries with three attributes:
corners- a list of eight corners
label- a string representing the label to be rendered on the box (Optional)
color- rgb values representing the color of the box
score - a numeric value that will be displayed on the bounding box that can be used to filter the bounding boxes shown (for example, to only show bounding boxes where score > 0.75). (Optional)
type is a string representing the scene type to render. Currently the only supported value is lidar/beta
Now you can view videos in the media browser. Go to your project workspace, run workspace, or report and click Add visualization to add a rich media panel.
2D view of a molecule
You can log a 2D view of a molecule using the wandb.Image data type and rdkit:
If a numpy array is supplied we assume the dimensions are, in order: time, channels, width, height. By default we create a 4 fps gif image (ffmpeg and the moviepy python library are required when passing numpy objects). Supported formats are "gif", "mp4", "webm", and "ogg". If you pass a string to wandb.Video we assert the file exists and is a supported format before uploading to wandb. Passing a BytesIO object will create a temporary file with the specified format as the extension.
On the W&B Run and Project Pages, you will see your videos in the Media section.
Use wandb.Table to log text in tables to show up in the UI. By default, the column headers are ["Input", "Output", "Expected"]. To ensure optimal UI performance, the default maximum number of rows is set to 10,000. However, users can explicitly override the maximum with wandb.Table.MAX_ROWS = {DESIRED_MAX}.
Custom html can be logged at any key, and this exposes an HTML panel on the run page. By default we inject default styles, you can turn off default styles by passing inject=False.
The following guide describes how to log models to a W&B run and interact with them.
The following APIs are useful for tracking models as a part of your experiment tracking workflow. Use the APIs listed on this page to log models to a run, and to access metrics, tables, media, and other objects.
W&B suggests that you use W&B Artifacts if you want to:
Create and keep track of different versions of serialized data besides models, such as datasets, prompts, and more.
Explore lineage graphs of a model or any other objects tracked in W&B.
Interact with the model artifacts these methods created, such as updating properties (metadata, aliases, and descriptions)
For more information on W&B Artifacts and advanced versioning use cases, see the Artifacts documentation.
Log a model to a run
Use the log_model to log a model artifact that contains content within a directory you specify. The log_model method also marks the resulting model artifact as an output of the W&B run.
You can track a model’s dependencies and the model’s associations if you mark the model as the input or output of a W&B run. View the lineage of the model within the W&B App UI. See the Explore and traverse artifact graphs page within the Artifacts chapter for more information.
Provide the path where your model files are saved to the path parameter. The path can be a local file, directory, or reference URI to an external bucket such as s3://bucket/path.
Ensure to replace values enclosed in <> with your own.
import wandb
# Initialize a W&B runrun = wandb.init(project="<your-project>", entity="<your-entity>")
# Log the modelrun.log_model(path="<path-to-model>", name="<name>")
Optionally provide a name for the model artifact for the name parameter. If name is not specified, W&B will use the basename of the input path prepended with the run ID as the name.
Keep track of the name that you, or W&B assigns, to the model. You will need the name of the model to retrieve the model path with the use_model method.
See log_model in the API Reference guide for more information on possible parameters.
Example: Log a model to a run
import os
import wandb
from tensorflow import keras
from tensorflow.keras import layers
config = {"optimizer": "adam", "loss": "categorical_crossentropy"}
# Initialize a W&B runrun = wandb.init(entity="charlie", project="mnist-experiments", config=config)
# Hyperparametersloss = run.config["loss"]
optimizer = run.config["optimizer"]
metrics = ["accuracy"]
num_classes =10input_shape = (28, 28, 1)
# Training algorithmmodel = keras.Sequential(
[
layers.Input(shape=input_shape),
layers.Conv2D(32, kernel_size=(3, 3), activation="relu"),
layers.MaxPooling2D(pool_size=(2, 2)),
layers.Conv2D(64, kernel_size=(3, 3), activation="relu"),
layers.MaxPooling2D(pool_size=(2, 2)),
layers.Flatten(),
layers.Dropout(0.5),
layers.Dense(num_classes, activation="softmax"),
]
)
# Configure the model for trainingmodel.compile(loss=loss, optimizer=optimizer, metrics=metrics)
# Save modelmodel_filename ="model.h5"local_filepath ="./"full_path = os.path.join(local_filepath, model_filename)
model.save(filepath=full_path)
# Log the model to the W&B runrun.log_model(path=full_path, name="MNIST")
run.finish()
When the user called log_model, a model artifact named MNIST was created and the file model.h5 was added to the model artifact. Your terminal or notebook will print information of where to find information about the run the model was logged to.
View run different-surf-5 at: https://wandb.ai/charlie/mnist-experiments/runs/wlby6fuw
Synced 5 W&B file(s), 0 media file(s), 1 artifact file(s) and0 other file(s)
Find logs at: ./wandb/run-20231206_103511-wlby6fuw/logs
Download and use a logged model
Use the use_model function to access and download models files previously logged to a W&B run.
Provide the name of the model artifact where the model files you are want to retrieve are stored. The name you provide must match the name of an existing logged model artifact.
If you did not define name when originally logged the files with log_model, the default name assigned is the basename of the input path, prepended with the run ID.
Ensure to replace other the values enclosed in <> with your own:
import wandb
# Initialize a runrun = wandb.init(project="<your-project>", entity="<your-entity>")
# Access and download model. Returns path to downloaded artifactdownloaded_model_path = run.use_model(name="<your-model-name>")
The use_model function returns the path of downloaded model files. Keep track of this path if you want to link this model later. In the preceding code snippet, the returned path is stored in a variable called downloaded_model_path.
Example: Download and use a logged model
For example, in the proceeding code snippet a user called the use_model API. They specified the name of the model artifact they want to fetch and they also provided a version/alias. They then stored the path that is returned from the API to the downloaded_model_path variable.
import wandb
entity ="luka"project ="NLP_Experiments"alias ="latest"# semantic nickname or identifier for the model versionmodel_artifact_name ="fine-tuned-model"# Initialize a runrun = wandb.init(project=project, entity=entity)
# Access and download model. Returns path to downloaded artifactdownloaded_model_path = run.use_model(name =f"{model_artifact_name}:{alias}")
See use_model in the API Reference guide for more information on possible parameters and return type.
Log and link a model to the W&B Model Registry
The link_model method is currently only compatible with the legacy W&B Model Registry, which will soon be deprecated. To learn how to link a model artifact to the new edition of model registry, visit the Registry docs.
Use the link_model method to log model files to a W&B run and link it to the W&B Model Registry. If no registered model exists, W&B will create a new one for you with the name you provide for the registered_model_name parameter.
You can think of linking a model similar to ‘bookmarking’ or ‘publishing’ a model to a centralized team repository of models that others members of your team can view and consume.
Note that when you link a model, that model is not duplicated in the Model Registry. That model is also not moved out of the project and intro the registry. A linked model is a pointer to the original model in your project.
Use the Model Registry to organize your best models by task, manage model lifecycle, facilitate easy tracking and auditing throughout the ML lifecyle, and automate downstream actions with webhooks or jobs.
A Registered Model is a collection or folder of linked model versions in the Model Registry. Registered models typically represent candidate models for a single modeling use case or task.
The proceeding code snippet shows how to link a model with the link_model API. Ensure to replace other the values enclosed in <> with your own:
import wandb
run = wandb.init(entity="<your-entity>", project="<your-project>")
run.link_model(path="<path-to-model>", registered_model_name="<registered-model-name>")
run.finish()
See link_model in the API Reference guide for more information on optional parameters.
If the registered-model-name matches the name of a registered model that already exists within the Model Registry, the model will be linked to that registered model. If no such registered model exists, a new one will be created and the model will be the first one linked.
For example, suppose you have an existing registered model named “Fine-Tuned-Review-Autocompletion” in your Model Registry (see example here). And suppose that a few model versions are already linked to it: v0, v1, v2. If you call link_model with registered-model-name="Fine-Tuned-Review-Autocompletion", the new model will be linked to this existing registered model as v3. If no registered model with this name exists, a new one will be created and the new model will be linked as v0.
Example: Log and link a model to the W&B Model Registry
For example, the proceeding code snippet logs model files and links the model to a registered model name "Fine-Tuned-Review-Autocompletion".
To do this, a user calls the link_model API. When they call the API, they provide a local filepath that points the content of the model (path) and they provide a name for the registered model to link it to (registered_model_name).
Reminder: A registered model houses a collection of bookmarked model versions.
6.6 - Log summary metrics
In addition to values that change over time during training, it is often important to track a single value that summarizes a model or a preprocessing step. Log this information in a W&B Run’s summary dictionary. A Run’s summary dictionary can handle numpy arrays, PyTorch tensors or TensorFlow tensors. When a value is one of these types we persist the entire tensor in a binary file and store high level metrics in the summary object, such as min, mean, variance, percentiles, and more.
The last value logged with wandb.log is automatically set as the summary dictionary in a W&B Run. If a summary metric dictionary is modified, the previous value is lost.
The proceeding code snippet demonstrates how to provide a custom summary metric to W&B:
You can update the summary attribute of an existing W&B Run after training has completed. Use the W&B Public API to update the summary attribute:
api = wandb.Api()
run = api.run("username/project/run_id")
run.summary["tensor"] = np.random.random(1000)
run.summary.update()
Customize summary metrics
Custom metric summaries are useful to capture model performance at the best step, instead of the last step, of training in your wandb.summary. For example, you might want to capture the maximum accuracy or the minimum loss value, instead of the final value.
Summary metrics can be controlled using the summary argument in define_metric which accepts the following values: "min", "max", "mean" ,"best", "last" and "none". The "best" parameter can only be used in conjunction with the optional objective argument which accepts values "minimize" and "maximize". Here’s an example of capturing the lowest value of loss and the maximum value of accuracy in the summary, instead of the default summary behavior, which uses the final value from history.
import wandb
import random
random.seed(1)
wandb.init()
# define a metric we are interested in the minimum ofwandb.define_metric("loss", summary="min")
# define a metric we are interested in the maximum ofwandb.define_metric("acc", summary="max")
for i in range(10):
log_dict = {
"loss": random.uniform(0, 1/ (i +1)),
"acc": random.uniform(1/ (i +1), 1),
}
wandb.log(log_dict)
Here’s what the resulting min and max summary values look like, in pinned columns in the sidebar on the Project Page workspace:
To define a Table, specify the columns you want to see for each row of data. Each row might be a single item in your training dataset, a particular step or epoch during training, a prediction made by your model on a test item, an object generated by your model, etc. Each column has a fixed type: numeric, text, boolean, image, video, audio, etc. You do not need to specify the type in advance. Give each column a name, and make sure to only pass data of that type into that column index. For a more detailed example, see this report.
Use the wandb.Table constructor in one of two ways:
List of Rows: Log named columns and rows of data. For example the proceeding code snippet generates a table with two rows and three columns:
Pandas DataFrame: Log a DataFrame using wandb.Table(dataframe=my_df). Column names will be extracted from the DataFrame.
From an existing array or dataframe
# assume a model has returned predictions on four images# with the following fields available:# - the image id# - the image pixels, wrapped in a wandb.Image()# - the model's predicted label# - the ground truth labelmy_data = [
[0, wandb.Image("img_0.jpg"), 0, 0],
[1, wandb.Image("img_1.jpg"), 8, 0],
[2, wandb.Image("img_2.jpg"), 7, 1],
[3, wandb.Image("img_3.jpg"), 1, 1],
]
# create a wandb.Table() with corresponding columnscolumns = ["id", "image", "prediction", "truth"]
test_table = wandb.Table(data=my_data, columns=columns)
Add data
Tables are mutable. As your script executes you can add more data to your table, up to 200,000 rows. There are two ways to add data to a table:
Add a Row: table.add_data("3a", "3b", "3c"). Note that the new row is not represented as a list. If your row is in list format, use the star notation, * ,to expand the list to positional arguments: table.add_data(*my_row_list). The row must contain the same number of entries as there are columns in the table.
Add a Column: table.add_column(name="col_name", data=col_data). Note that the length of col_data must be equal to the table’s current number of rows. Here, col_data can be a list data, or a NumPy NDArray.
Adding data incrementally
This code sample shows how to create and populate a W&B table incrementally. You define the table with predefined columns, including confidence scores for all possible labels, and add data row by row during inference. You can also add data to tables incrementally when resuming runs.
# Define the columns for the table, including confidence scores for each labelcolumns = ["id", "image", "guess", "truth"]
for digit in range(10): # Add confidence score columns for each digit (0-9) columns.append(f"score_{digit}")
# Initialize the table with the defined columnstest_table = wandb.Table(columns=columns)
# Iterate through the test dataset and add data to the table row by row# Each row includes the image ID, image, predicted label, true label, and confidence scoresfor img_id, img in enumerate(mnist_test_data):
true_label = mnist_test_data_labels[img_id] # Ground truth label guess_label = my_model.predict(img) # Predicted label test_table.add_data(
img_id, wandb.Image(img), guess_label, true_label
) # Add row data to the table
Adding data to resumed runs
You can incrementally update a W&B table in resumed runs by loading an existing table from an artifact, retrieving the last row of data, and adding the updated metrics. Then, reinitialize the table for compatibility and log the updated version back to W&B.
# Load the existing table from the artifactbest_checkpt_table = wandb.use_artifact(table_tag).get(table_name)
# Get the last row of data from the table for resumingbest_iter, best_metric_max, best_metric_min = best_checkpt_table.data[-1]
# Update the best metrics as needed# Add the updated data to the tablebest_checkpt_table.add_data(best_iter, best_metric_max, best_metric_min)
# Reinitialize the table with its updated data to ensure compatibilitybest_checkpt_table = wandb.Table(
columns=["col1", "col2", "col3"], data=best_checkpt_table.data
)
# Log the updated table to Weights & Biaseswandb.log({table_name: best_checkpt_table})
Retrieve data
Once data is in a Table, access it by column or by row:
Row Iterator: Users can use the row iterator of Table such as for ndx, row in table.iterrows(): ... to efficiently iterate over the data’s rows.
Get a Column: Users can retrieve a column of data using table.get_column("col_name") . As a convenience, users can pass convert_to="numpy" to convert the column to a NumPy NDArray of primitives. This is useful if your column contains media types such as wandb.Image so that you can access the underlying data directly.
Save tables
After you generate a table of data in your script, for example a table of model predictions, save it to W&B to visualize the results live.
Log a table to a run
Use wandb.log() to save your table to the run, like so:
Each time a table is logged to the same key, a new version of the table is created and stored in the backend. This means you can log the same table across multiple training steps to see how model predictions improve over time, or compare tables across different runs, as long as they’re logged to the same key. You can log up to 200,000 rows.
To log more than 200,000 rows, you can override the limit with:
wandb.Table.MAX_ARTIFACT_ROWS = X
However, this would likely cause performance issues, such as slower queries, in the UI.
Access tables programmatically
In the backend, Tables are persisted as Artifacts. If you are interested in accessing a specific version, you can do so with the artifact API:
with wandb.init() as run:
my_table = run.use_artifact("run-<run-id>-<table-name>:<tag>").get("<table-name>")
For more information on Artifacts, see the Artifacts Chapter in the Developer Guide.
Visualize tables
Any table logged this way will show up in your Workspace on both the Run Page and the Project Page. For more information, see Visualize and Analyze Tables.
Artifact tables
Use artifact.add() to log tables to the Artifacts section of your run instead of the workspace. This could be useful if you have a dataset that you want to log once and then reference for future runs.
run = wandb.init(project="my_project")
# create a wandb Artifact for each meaningful steptest_predictions = wandb.Artifact("mnist_test_preds", type="predictions")
# [build up your predictions data as above]test_table = wandb.Table(data=data, columns=columns)
test_predictions.add(test_table, "my_test_key")
run.log_artifact(test_predictions)
You can join tables you have locally constructed or tables you have retrieved from other artifacts using wandb.JoinedTable(table_1, table_2, join_key).
Args
Description
table_1
(str, wandb.Table, ArtifactEntry) the path to a wandb.Table in an artifact, the table object, or ArtifactEntry
table_2
(str, wandb.Table, ArtifactEntry) the path to a wandb.Table in an artifact, the table object, or ArtifactEntry
join_key
(str, [str, str]) key or keys on which to perform the join
To join two Tables you have logged previously in an artifact context, fetch them from the artifact and join the result into a new Table.
For example, demonstrates how to read one Table of original songs called 'original_songs' and another Table of synthesized versions of the same songs called 'synth_songs'. The proceeding code example joins the two tables on "song_id", and uploads the resulting table as a new W&B Table:
import wandb
run = wandb.init(project="my_project")
# fetch original songs tableorig_songs = run.use_artifact("original_songs:latest")
orig_table = orig_songs.get("original_samples")
# fetch synthesized songs tablesynth_songs = run.use_artifact("synth_songs:latest")
synth_table = synth_songs.get("synth_samples")
# join tables on "song_id"join_table = wandb.JoinedTable(orig_table, synth_table, "song_id")
join_at = wandb.Artifact("synth_summary", "analysis")
# add table to artifact and log to W&Bjoin_at.add(join_table, "synth_explore")
run.log_artifact(join_at)
Read this tutorial for an example on how to combine two previously stored tables stored in different Artifact objects.
We suggest you utilize W&B Artifacts to make it easier to re-use the contents of the CSV file easier to use.
To get started, first import your CSV file. In the proceeding code snippet, replace the iris.csv filename with the name of your CSV filename:
import wandb
import pandas as pd
# Read our CSV into a new DataFramenew_iris_dataframe = pd.read_csv("iris.csv")
Convert the CSV file to a W&B Table to utilize W&B Dashboards.
# Convert the DataFrame into a W&B Tableiris_table = wandb.Table(dataframe=new_iris_dataframe)
Next, create a W&B Artifact and add the table to the Artifact:
# Add the table to an Artifact to increase the row# limit to 200000 and make it easier to reuseiris_table_artifact = wandb.Artifact("iris_artifact", type="dataset")
iris_table_artifact.add(iris_table, "iris_table")
# Log the raw csv file within an artifact to preserve our datairis_table_artifact.add_file("iris.csv")
For more information about W&B Artifacts, see the Artifacts chapter.
Lastly, start a new W&B Run to track and log to W&B with wandb.init:
# Start a W&B run to log datarun = wandb.init(project="tables-walkthrough")
# Log the table to visualize with a run...run.log({"iris": iris_table})
# and Log as an Artifact to increase the available row limit!run.log_artifact(iris_table_artifact)
The wandb.init() API spawns a new background process to log data to a Run, and it synchronizes data to wandb.ai (by default). View live visualizations on your W&B Workspace Dashboard. The following image demonstrates the output of the code snippet demonstration.
The full script with the preceding code snippets is found below:
import wandb
import pandas as pd
# Read our CSV into a new DataFramenew_iris_dataframe = pd.read_csv("iris.csv")
# Convert the DataFrame into a W&B Tableiris_table = wandb.Table(dataframe=new_iris_dataframe)
# Add the table to an Artifact to increase the row# limit to 200000 and make it easier to reuseiris_table_artifact = wandb.Artifact("iris_artifact", type="dataset")
iris_table_artifact.add(iris_table, "iris_table")
# log the raw csv file within an artifact to preserve our datairis_table_artifact.add_file("iris.csv")
# Start a W&B run to log datarun = wandb.init(project="tables-walkthrough")
# Log the table to visualize with a run...run.log({"iris": iris_table})
# and Log as an Artifact to increase the available row limit!run.log_artifact(iris_table_artifact)
# Finish the run (useful in notebooks)run.finish()
Import and log your CSV of Experiments
In some cases, you might have your experiment details in a CSV file. Common details found in such CSV files include:
Configurations needed for your experiment (with the added benefit of being able to utilize our Sweeps Hyperparameter Tuning).
Experiment
Model Name
Notes
Tags
Num Layers
Final Train Acc
Final Val Acc
Training Losses
Experiment 1
mnist-300-layers
Overfit way too much on training data
[latest]
300
0.99
0.90
[0.55, 0.45, 0.44, 0.42, 0.40, 0.39]
Experiment 2
mnist-250-layers
Current best model
[prod, best]
250
0.95
0.96
[0.55, 0.45, 0.44, 0.42, 0.40, 0.39]
Experiment 3
mnist-200-layers
Did worse than the baseline model. Need to debug
[debug]
200
0.76
0.70
[0.55, 0.45, 0.44, 0.42, 0.40, 0.39]
…
…
…
…
…
…
…
Experiment N
mnist-X-layers
NOTES
…
…
…
…
[…, …]
W&B can take CSV files of experiments and convert it into a W&B Experiment Run. The proceeding code snippets and code script demonstrates how to import and log your CSV file of experiments:
To get started, first read in your CSV file and convert it into a Pandas DataFrame. Replace "experiments.csv" with the name of your CSV file:
import wandb
import pandas as pd
FILENAME ="experiments.csv"loaded_experiment_df = pd.read_csv(FILENAME)
PROJECT_NAME ="Converted Experiments"EXPERIMENT_NAME_COL ="Experiment"NOTES_COL ="Notes"TAGS_COL ="Tags"CONFIG_COLS = ["Num Layers"]
SUMMARY_COLS = ["Final Train Acc", "Final Val Acc"]
METRIC_COLS = ["Training Losses"]
# Format Pandas DataFrame to make it easier to work withfor i, row in loaded_experiment_df.iterrows():
run_name = row[EXPERIMENT_NAME_COL]
notes = row[NOTES_COL]
tags = row[TAGS_COL]
config = {}
for config_col in CONFIG_COLS:
config[config_col] = row[config_col]
metrics = {}
for metric_col in METRIC_COLS:
metrics[metric_col] = row[metric_col]
summaries = {}
for summary_col in SUMMARY_COLS:
summaries[summary_col] = row[summary_col]
Next, start a new W&B Run to track and log to W&B with wandb.init():
run = wandb.init(
project=PROJECT_NAME, name=run_name, tags=tags, notes=notes, config=config
)
As an experiment runs, you might want to log every instance of your metrics so they are available to view, query, and analyze with W&B. Use the run.log() command to accomplish this:
run.log({key: val})
You can optionally log a final summary metric to define the outcome of the run. Use the W&B define_metric API to accomplish this. In this example case, we will add the summary metrics to our run with run.summary.update():
Below is the full example script that converts the above sample table into a W&B Dashboard:
FILENAME ="experiments.csv"loaded_experiment_df = pd.read_csv(FILENAME)
PROJECT_NAME ="Converted Experiments"EXPERIMENT_NAME_COL ="Experiment"NOTES_COL ="Notes"TAGS_COL ="Tags"CONFIG_COLS = ["Num Layers"]
SUMMARY_COLS = ["Final Train Acc", "Final Val Acc"]
METRIC_COLS = ["Training Losses"]
for i, row in loaded_experiment_df.iterrows():
run_name = row[EXPERIMENT_NAME_COL]
notes = row[NOTES_COL]
tags = row[TAGS_COL]
config = {}
for config_col in CONFIG_COLS:
config[config_col] = row[config_col]
metrics = {}
for metric_col in METRIC_COLS:
metrics[metric_col] = row[metric_col]
summaries = {}
for summary_col in SUMMARY_COLS:
summaries[summary_col] = row[summary_col]
run = wandb.init(
project=PROJECT_NAME, name=run_name, tags=tags, notes=notes, config=config
)
for key, val in metrics.items():
if isinstance(val, list):
for _val in val:
run.log({key: _val})
else:
run.log({key: val})
run.summary.update(summaries)
run.finish()
7 - Track Jupyter notebooks
se W&B with Jupyter to get interactive visualizations without leaving your notebook.
Use W&B with Jupyter to get interactive visualizations without leaving your notebook. Combine custom analysis, experiments, and prototypes, all fully logged.
Use cases for W&B with Jupyter notebooks
Iterative experimentation: Run and re-run experiments, tweaking parameters, and have all the runs you do saved automatically to W&B without having to take manual notes along the way.
Code saving: When reproducing a model, it’s hard to know which cells in a notebook ran, and in which order. Turn on code saving on your settings page to save a record of cell execution for each experiment.
Custom analysis: Once runs are logged to W&B, it’s easy to get a dataframe from the API and do custom analysis, then log those results to W&B to save and share in reports.
Getting started in a notebook
Start your notebook with the following code to install W&B and link your account:
After running wandb.init() , start a new cell with %%wandb to see live graphs in the notebook. If you run this cell multiple times, data will be appended to the run.
Rendering live W&B interfaces directly in your notebooks
You can also display any existing dashboards, sweeps, or reports directly in your notebook using the %wandb magic:
# Display a project workspace
%wandb USERNAME/PROJECT
# Display a single run
%wandb USERNAME/PROJECT/runs/RUN_ID
# Display a sweep
%wandb USERNAME/PROJECT/sweeps/SWEEP_ID
# Display a report
%wandb USERNAME/PROJECT/reports/REPORT_ID
# Specify the height of embedded iframe
%wandb USERNAME/PROJECT -h 2048
As an alternative to the %%wandb or %wandb magics, after running wandb.init() you can end any cell with wandb.run to show in-line graphs, or call ipython.display(...) on any report, sweep, or run object returned from our apis.
# Initialize wandb.run firstwandb.init()
# If cell outputs wandb.run, you'll see live graphswandb.run
Easy authentication in Colab: When you call wandb.init for the first time in a Colab, we automatically authenticate your runtime if you’re currently logged in to W&B in your browser. On the overview tab of your run page, you’ll see a link to the Colab.
Jupyter Magic: Display dashboards, sweeps and reports directly in your notebooks. The %wandb magic accepts a path to your project, sweeps or reports and will render the W&B interface directly in the notebook.
Launch dockerized Jupyter: Call wandb docker --jupyter to launch a docker container, mount your code in it, ensure Jupyter is installed, and launch on port 8888.
Run cells in arbitrary order without fear: By default, we wait until the next time wandb.init is called to mark a run as finished. That allows you to run multiple cells (say, one to set up data, one to train, one to test) in whatever order you like and have them all log to the same run. If you turn on code saving in settings, you’ll also log the cells that were executed, in order and in the state in which they were run, enabling you to reproduce even the most non-linear of pipelines. To mark a run as complete manually in a Jupyter notebook, call run.finish.
import wandb
run = wandb.init()
# training script and logging goes hererun.finish()
8 - Experiments limits and performance
Keep your pages in W&B faster and more responsive by logging within these suggested bounds.
Keep your pages in W&B faster and more responsive by logging within the following suggested bounds.
Logged metrics
Use wandb.log to track experiment metrics. Once logged, these metrics generate charts and show up in tables. Too much logged data can make the app slow.
Distinct metric count
For faster performance, keep the total number of distinct metrics in a project under 10,000.
import wandb
wandb.log(
{
"a": 1, # "a" is a distinct metric"b": {
"c": "hello", # "b.c" is a distinct metric"d": [1, 2, 3], # "b.d" is a distinct metric },
}
)
W&B automatically flattens nested values. This means that if you pass a dictionary, W&B turns it into a dot-separated name. For config values, W&B supports 3 dots in the name. For summary values, W&B supports 4 dots.
If your workspace suddenly slows down, check whether recent runs have unintentionally logged thousands of new metrics. (This is easiest to spot by seeing sections with thousands of plots that have only one or two runs visible on them.) If they have, consider deleting those runs and recreating them with the desired metrics.
Value width
Limit the size of a single logged value to under 1 MB and the total size of a single wandb.log call to under 25 MB. This limit does not apply to wandb.Media types like wandb.Image, wandb.Audio, etc.
# ❌ not recommendedwandb.log({"wide_key": range(10000000)})
# ❌ not recommendedwith f as open("large_file.json", "r"):
large_data = json.load(f)
wandb.log(large_data)
Wide values can affect the plot load times for all metrics in the run, not just the metric with the wide values.
Data is saved and tracked even if you log values wider than the recommended amount. However, your plots may load more slowly.
Metric frequency
Pick a logging frequency that is appropriate to the metric you are logging. As a general rule of thumb, the wider the metric the less frequently you should log it. W&B recommends:
Scalars: <100,000 logged points per metric
Media: <50,000 logged points per metric
Histograms: <10,000 logged points per metric
# Training loop with 1m total stepsfor step in range(1000000):
# ❌ not recommended wandb.log(
{
"scalar": step, # 100,000 scalars"media": wandb.Image(...), # 100,000 images"histogram": wandb.Histogram(...), # 100,000 histograms }
)
# ✅ recommendedif step %1000==0:
wandb.log(
{
"histogram": wandb.Histogram(...), # 10,000 histograms },
commit=False,
)
if step %200==0:
wandb.log(
{
"media": wandb.Image(...), # 50,000 images },
commit=False,
)
if step %100==0:
wandb.log(
{
"scalar": step, # 100,000 scalars },
commit=True,
) # Commit batched, per-step metrics together
W&B continues to accept your logged data but pages may load more slowly if you exceed guidelines.
Config size
Limit the total size of your run config to less than 10 MB. Logging large values could slow down your project workspaces and runs table operations.
# ✅ recommendedwandb.init(
config={
"lr": 0.1,
"batch_size": 32,
"epochs": 4,
}
)
# ❌ not recommendedwandb.init(
config={
"steps": range(10000000),
}
)
# ❌ not recommendedwith f as open("large_config.json", "r"):
large_config = json.load(f)
wandb.init(config=large_config)
Run count
For faster loading times, keep the total number of runs in a single project under 10,000. Large run counts can slow down project workspaces and runs table operations, especially when grouping is enabled or runs have a large count of distinct metrics.
If you find that you or your team are frequently accessing the same set of runs (for example, recent runs), consider bulk moving other runs to a new project used as an archive, leaving a smaller set of runs in your working project.
Section count
Having hundreds of sections in a workspace can hurt performance. Consider creating sections based on high-level groupings of metrics and avoiding an anti-pattern of one section for each metric.
If you find you have too many sections and performance is slow, consider the workspace setting to create sections by prefix rather than suffix, which can result in fewer sections and better performance.
File count
Keep the total number of files uploaded for a single run under 1,000. You can use W&B Artifacts when you need to log a large number of files. Exceeding 1,000 files in a single run can slow down your run pages.
Python script performance
There are a few ways that the performance of your python script is reduced:
The size of your data is too large. Large data sizes could introduce a >1 ms overhead to the training loop.
The speed of your network and how the W&B backend is configured
Calling wandb.log more than a few times per second. This is due to a small latency added to the training loop every time wandb.log is called.
Is frequent logging slowing your training runs down? Check out this Colab for methods to get better performance by changing your logging strategy.
W&B does not assert any limits beyond rate limiting. The W&B Python SDK automatically completes an exponential “backoff” and “retry” requests that exceed limits. W&B Python SDK responds with a “Network failure” on the command line. For unpaid accounts, W&B may reach out in extreme cases where usage exceeds reasonable thresholds.
Rate limits
W&B SaaS Cloud API implements a rate limit to maintain system integrity and ensure availability. This measure prevents any single user from monopolizing available resources in the shared infrastructure, ensuring that the service remains accessible to all users. You may encounter a lower rate limit for a variety of reasons.
Rate limits are subject to change.
Rate limit HTTP headers
The preceding table describes rate limit HTTP headers:
Header name
Description
RateLimit-Limit
The amount of quota available per time window, scaled in the range of 0 to 1000
RateLimit-Remaining
The amount of quota in the current rate limit window, scaled in the range of 0 and 1000
RateLimit-Reset
The number of seconds until the current quota resets
Rate limits on metric logging API
The wandb.log calls in your script utilize a metrics logging API to log your training data to W&B. This API is engaged through either online or offline syncing. In either case, it imposes a rate limit quota limit in a rolling time window. This includes limits on total request size and request rate, where latter refers to the number of requests in a time duration.
W&B applies rate limits per W&B project. So if you have 3 projects in a team, each project has its own rate limit quota. Users on Teams and Enterprise plans have higher rate limits than those on the Free plan.
When you hit the rate limit while using the metrics logging API, you see a relevant message indicating the error in the standard output.
Suggestions for staying under the metrics logging API rate limit
Exceeding the rate limit may delay run.finish() until the rate limit resets. To avoid this, consider the following strategies:
Update your W&B Python SDK version: Ensure you are using the latest version of the W&B Python SDK. The W&B Python SDK is regularly updated and includes enhanced mechanisms for gracefully retrying requests and optimizing quota usage.
Reduce metric logging frequency:
Minimize the frequency of logging metrics to conserve your quota. For example, you can modify your code to log metrics every five epochs instead of every epoch:
if epoch %5==0: # Log metrics every 5 epochs wandb.log({"acc": accuracy, "loss": loss})
Manual data syncing: W&B store your run data locally if you are rate limited. You can manually sync your data with the command wandb sync <run-file-path>. For more details, see the wandb sync reference.
Rate limits on GraphQL API
The W&B Models UI and SDK’s public API make GraphQL requests to the server for querying and modifying data. For all GraphQL requests in SaaS Cloud, W&B applies rate limits per IP address for unauthorized requests and per user for authorized requests. The limit is based on request rate (request per second) within a fixed time window, where your pricing plan determines the default limits. For relevant SDK requests that specify a project path (for example, reports, runs, artifacts), W&B applies rate limits per project, measured by database query time.
Users on Teams and Enterprise plans receive higher rate limits than those on the Free plan.
When you hit the rate limit while using the W&B Models SDK’s public API, you see a relevant message indicating the error in the standard output.
Suggestions for staying under the GraphQL API rate limit
If you are fetching a large volume of data using the W&B Models SDK’s public API, consider waiting at least one second between requests. If you receive a 429 status code or see RateLimit-Remaining=0 in the response headers, wait for the number of seconds specified in RateLimit-Reset before retrying.
Browser considerations
The W&B app can be memory-intensive and performs best in Chrome. Depending on your computer’s memory, having W&B active in 3+ tabs at once can cause performance to degrade. If you encounter unexpectedly slow performance, consider closing other tabs or applications.
Reporting performance issues to W&B
W&B takes performance seriously and investigates every report of lag. To expedite investigation, when reporting slow loading times consider invoking W&B’s built-in performance logger that captures key metrics and performance events. Append &PERF_LOGGING to your URL, and share the output of your console.
9 - Import and export data
Import data from MLFlow, export or update data that you have saved to W&B
Export data or import data with W&B Public APIs.
This feature requires python>=3.8
Import data from MLFlow
W&B supports importing data from MLFlow, including experiments, runs, artifacts, metrics, and other metadata.
Install dependencies:
# note: this requires py38+pip install wandb[importers]
Log in to W&B. Follow the prompts if you have not logged in before.
By default, importer.collect_runs() collects all runs from the MLFlow server. If you prefer to upload a special subset, you can construct your own runs iterable and pass it to the importer.
import mlflow
from wandb.apis.importers.mlflow import MlflowRun
client = mlflow.tracking.MlflowClient(mlflow_tracking_uri)
runs: Iterable[MlflowRun] = []
for run in mlflow_client.search_runs(...):
runs.append(MlflowRun(run, client))
importer.import_runs(runs)
Set mlflow-tracking-uri="databricks" in the previous step.
To skip importing artifacts, you can pass artifacts=False:
importer.import_runs(runs, artifacts=False)
To import to a specific W&B entity and project, you can pass a Namespace:
from wandb.apis.importers import Namespace
importer.import_runs(runs, namespace=Namespace(entity, project))
Export Data
Use the Public API to export or update data that you have saved to W&B. Before using this API, log data from your script. Check the Quickstart for more details.
Use Cases for the Public API
Export Data: Pull down a dataframe for custom analysis in a Jupyter Notebook. Once you have explored the data, you can sync your findings by creating a new analysis run and logging results, for example: wandb.init(job_type="analysis")
Update Existing Runs: You can update the data logged in association with a W&B run. For example, you might want to update the config of a set of runs to include additional information, like the architecture or a hyperparameter that wasn’t originally logged.
Authenticate your machine with your API key in one of two ways:
Run wandb login on the command line and paste in your API key.
Set the WANDB_API_KEY environment variable to your API key.
Find the run path
To use the Public API, you’ll often need the run path which is <entity>/<project>/<run_id>. In the app UI, open a run page and click the Overview tab to get the run path.
Export Run Data
Download data from a finished or active run. Common usage includes downloading a dataframe for custom analysis in a Jupyter notebook, or using custom logic in an automated environment.
import wandb
api = wandb.Api()
run = api.run("<entity>/<project>/<run_id>")
The most commonly used attributes of a run object are:
Attribute
Meaning
run.config
A dictionary of the run’s configuration information, such as the hyperparameters for a training run or the preprocessing methods for a run that creates a dataset Artifact. Think of these as the run’s inputs.
run.history()
A list of dictionaries meant to store values that change while the model is training such as loss. The command wandb.log() appends to this object.
run.summary
A dictionary of information that summarizes the run’s results. This can be scalars like accuracy and loss, or large files. By default, wandb.log() sets the summary to the final value of a logged time series. The contents of the summary can also be set directly. Think of the summary as the run’s outputs.
You can also modify or update the data of past runs. By default a single instance of an api object will cache all network requests. If your use case requires real time information in a running script, call api.flush() to get updated values.
Understanding the Different Attributes
For the below run
n_epochs =5config = {"n_epochs": n_epochs}
run = wandb.init(project=project, config=config)
for n in range(run.config.get("n_epochs")):
run.log(
{"val": random.randint(0, 1000), "loss": (random.randint(0, 1000) /1000.00)}
)
run.finish()
these are the different outputs for the above run object attributes
run.config
{"n_epochs": 5}
run.history()
_step val loss _runtime _timestamp
00500 0.244 416443454121145 0.521 4164434541222240 0.785 416443454123331 0.305 4164434541244525 0.041 41644345412
The default history method samples the metrics to a fixed number of samples (the default is 500, you can change this with the samples __ argument). If you want to export all of the data on a large run, you can use the run.scan_history() method. For more details see the API Reference.
Querying Multiple Runs
This example script finds a project and outputs a CSV of runs with name, configs and summary stats. Replace <entity> and <project> with your W&B entity and the name of your project, respectively.
import pandas as pd
import wandb
api = wandb.Api()
entity, project ="<entity>", "<project>"runs = api.runs(entity +"/"+ project)
summary_list, config_list, name_list = [], [], []
for run in runs:
# .summary contains output keys/values for# metrics such as accuracy.# We call ._json_dict to omit large files summary_list.append(run.summary._json_dict)
# .config contains the hyperparameters.# We remove special values that start with _. config_list.append({k: v for k, v in run.config.items() ifnot k.startswith("_")})
# .name is the human-readable name of the run. name_list.append(run.name)
runs_df = pd.DataFrame(
{"summary": summary_list, "config": config_list, "name": name_list}
)
runs_df.to_csv("project.csv")
The W&B API also provides a way for you to query across runs in a project with api.runs(). The most common use case is exporting runs data for custom analysis. The query interface is the same as the one MongoDB uses.
Calling api.runs returns a Runs object that is iterable and acts like a list. By default the object loads 50 runs at a time in sequence as required, but you can change the number loaded per page with the per_page keyword argument.
api.runs also accepts an order keyword argument. The default order is -created_at. To order results ascending, specify +created_at. You can also sort by config or summary values. For example, summary.val_acc or config.experiment_name.
Error Handling
If errors occur while talking to W&B servers a wandb.CommError will be raised. The original exception can be introspected via the exc attribute.
Get the latest git commit through the API
In the UI, click on a run and then click the Overview tab on the run page to see the latest git commit. It’s also in the file wandb-metadata.json . Using the public API, you can get the git hash with run.commit.
Get a run’s name and ID during a run
After calling wandb.init() you can access the random run ID or the human readable run name from your script like this:
Unique run ID (8 character hash): wandb.run.id
Random run name (human readable): wandb.run.name
If you’re thinking about ways to set useful identifiers for your runs, here’s what we recommend:
Run ID: leave it as the generated hash. This needs to be unique across runs in your project.
Run name: This should be something short, readable, and preferably unique so that you can tell the difference between different lines on your charts.
Run notes: This is a great place to put a quick description of what you’re doing in your run. You can set this with wandb.init(notes="your notes here")
Run tags: Track things dynamically in run tags, and use filters in the UI to filter your table down to just the runs you care about. You can set tags from your script and then edit them in the UI, both in the runs table and the overview tab of the run page. See the detailed instructions here.
Public API Examples
Export data to visualize in matplotlib or seaborn
Check out our API examples for some common export patterns. You can also click the download button on a custom plot or on the expanded runs table to download a CSV from your browser.
Read metrics from a run
This example outputs timestamp and accuracy saved with wandb.log({"accuracy": acc}) for a run saved to "<entity>/<project>/<run_id>".
import wandb
api = wandb.Api()
run = api.run("<entity>/<project>/<run_id>")
if run.state =="finished":
for i, row in run.history().iterrows():
print(row["_timestamp"], row["accuracy"])
Filter runs
You can filters by using the MongoDB Query Language.
To pull specific metrics from a run, use the keys argument. The default number of samples when using run.history() is 500. Logged steps that do not include a specific metric will appear in the output dataframe as NaN. The keys argument will cause the API to sample steps that include the listed metric keys more frequently.
import wandb
api = wandb.Api()
run = api.run("<entity>/<project>/<run_id>")
if run.state =="finished":
for i, row in run.history(keys=["accuracy"]).iterrows():
print(row["_timestamp"], row["accuracy"])
Compare two runs
This will output the config parameters that are different between run1 and run2.
import pandas as pd
import wandb
api = wandb.Api()
# replace with your <entity>, <project>, and <run_id>run1 = api.run("<entity>/<project>/<run_id>")
run2 = api.run("<entity>/<project>/<run_id>")
df = pd.DataFrame([run1.config, run2.config]).transpose()
df.columns = [run1.name, run2.name]
print(df[df[run1.name] != df[run2.name]])
Update metrics for a run, after the run has finished
This example sets the accuracy of a previous run to 0.9. It also modifies the accuracy histogram of a previous run to be the histogram of numpy_array.
import wandb
api = wandb.Api()
run = api.run("<entity>/<project>/<run_id>")
run.summary["accuracy"] =0.9run.summary["accuracy_histogram"] = wandb.Histogram(numpy_array)
run.summary.update()
Rename a metric in a run, after the run has finished
This example renames a summary column in your tables.
import wandb
api = wandb.Api()
run = api.run("<entity>/<project>/<run_id>")
run.summary["new_name"] = run.summary["old_name"]
del run.summary["old_name"]
run.summary.update()
Renaming a column only applies to tables. Charts will still refer to metrics by their original names.
Update config for an existing run
This examples updates one of your configuration settings.
import wandb
api = wandb.Api()
run = api.run("<entity>/<project>/<run_id>")
run.config["key"] = updated_value
run.update()
Export system resource consumptions to a CSV file
The snippet below would find the system resource consumptions and then, save them to a CSV.
import wandb
run = wandb.Api().run("<entity>/<project>/<run_id>")
system_metrics = run.history(stream="events")
system_metrics.to_csv("sys_metrics.csv")
Get unsampled metric data
When you pull data from history, by default it’s sampled to 500 points. Get all the logged data points using run.scan_history(). Here’s an example downloading all the loss data points logged in history.
import wandb
api = wandb.Api()
run = api.run("<entity>/<project>/<run_id>")
history = run.scan_history()
losses = [row["loss"] for row in history]
Get paginated data from history
If metrics are being fetched slowly on our backend or API requests are timing out, you can try lowering the page size in scan_history so that individual requests don’t time out. The default page size is 500, so you can experiment with different sizes to see what works best:
import wandb
api = wandb.Api()
run = api.run("<entity>/<project>/<run_id>")
run.scan_history(keys=sorted(cols), page_size=100)
Export metrics from all runs in a project to a CSV file
This script pulls down the runs in a project and produces a dataframe and a CSV of runs including their names, configs, and summary stats. Replace <entity> and <project> with your W&B entity and the name of your project, respectively.
import pandas as pd
import wandb
api = wandb.Api()
entity, project ="<entity>", "<project>"runs = api.runs(entity +"/"+ project)
summary_list, config_list, name_list = [], [], []
for run in runs:
# .summary contains the output keys/values# for metrics such as accuracy.# We call ._json_dict to omit large files summary_list.append(run.summary._json_dict)
# .config contains the hyperparameters.# We remove special values that start with _. config_list.append({k: v for k, v in run.config.items() ifnot k.startswith("_")})
# .name is the human-readable name of the run. name_list.append(run.name)
runs_df = pd.DataFrame(
{"summary": summary_list, "config": config_list, "name": name_list}
)
runs_df.to_csv("project.csv")
Get the starting time for a run
This code snippet retrieves the time at which the run was created.
import wandb
api = wandb.Api()
run = api.run("entity/project/run_id")
start_time = run.created_at
Upload files to a finished run
The code snippet below uploads a selected file to a finished run.
import wandb
api = wandb.Api()
run = api.run("entity/project/run_id")
run.upload_file("file_name.extension")
Download a file from a run
This finds the file “model-best.h5” associated with run ID uxte44z7 in the cifar project and saves it locally.
import wandb
api = wandb.Api()
run = api.run("<entity>/<project>/<run_id>")
run.file("model-best.h5").download()
Download all files from a run
This finds all files associated with a run and saves them locally.
import wandb
api = wandb.Api()
run = api.run("<entity>/<project>/<run_id>")
for file in run.files():
file.download()
Get runs from a specific sweep
This snippet downloads all the runs associated with a particular sweep.
The best_run is the run with the best metric as defined by the metric parameter in the sweep config.
Download the best model file from a sweep
This snippet downloads the model file with the highest validation accuracy from a sweep with runs that saved model files to model.h5.
import wandb
api = wandb.Api()
sweep = api.sweep("<entity>/<project>/<sweep_id>")
runs = sorted(sweep.runs, key=lambda run: run.summary.get("val_acc", 0), reverse=True)
val_acc = runs[0].summary.get("val_acc", 0)
print(f"Best run {runs[0].name} with {val_acc}% val accuracy")
runs[0].file("model.h5").download(replace=True)
print("Best model saved to model-best.h5")
Delete all files with a given extension from a run
This snippet deletes files with a given extension from a run.
import wandb
api = wandb.Api()
run = api.run("<entity>/<project>/<run_id>")
extension =".png"files = run.files()
for file in files:
if file.name.endswith(extension):
file.delete()
Download system metrics data
This snippet produces a dataframe with all the system resource consumption metrics for a run and then saves it to a CSV.
import wandb
api = wandb.Api()
run = api.run("<entity>/<project>/<run_id>")
system_metrics = run.history(stream="events")
system_metrics.to_csv("sys_metrics.csv")
Update summary metrics
You can pass a dictionary to update summary metrics.
summary.update({"key": val})
Get the command that ran the run
Each run captures the command that launched it on the run overview page. To pull this command down from the API, you can run:
import wandb
api = wandb.Api()
run = api.run("<entity>/<project>/<run_id>")
meta = json.load(run.file("wandb-metadata.json").download())
program = ["python"] + [meta["program"]] + meta["args"]
10 - Environment variables
Set W&B environment variables.
When you’re running a script in an automated environment, you can control wandb with environment variables set before the script runs or within the script.
# This is secret and shouldn't be checked into version controlWANDB_API_KEY=$YOUR_API_KEY
# Name and notes optionalWANDB_NAME="My first run"WANDB_NOTES="Smaller learning rate, more regularization."
# Only needed if you don't check in the wandb/settings fileWANDB_ENTITY=$username
WANDB_PROJECT=$project
# If you don't want your script to sync to the cloudos.environ["WANDB_MODE"] ="offline"
Optional environment variables
Use these optional environment variables to do things like set up authentication on remote machines.
Variable name
Usage
WANDB_ANONYMOUS
Set this to allow, never, or must to let users create anonymous runs with secret urls.
WANDB_API_KEY
Sets the authentication key associated with your account. You can find your key on your settings page. This must be set if wandb login hasn’t been run on the remote machine.
WANDB_BASE_URL
If you’re using wandb/local you should set this environment variable to http://YOUR_IP:YOUR_PORT
WANDB_CACHE_DIR
This defaults to ~/.cache/wandb, you can override this location with this environment variable
WANDB_CONFIG_DIR
This defaults to ~/.config/wandb, you can override this location with this environment variable
WANDB_CONFIG_PATHS
Comma separated list of yaml files to load into wandb.config. See config.
WANDB_CONSOLE
Set this to “off” to disable stdout / stderr logging. This defaults to “on” in environments that support it.
WANDB_DIR
Set this to an absolute path to store all generated files here instead of the wandb directory relative to your training script. be sure this directory exists and the user your process runs as can write to it
WANDB_DISABLE_GIT
Prevent wandb from probing for a git repository and capturing the latest commit / diff.
WANDB_DISABLE_CODE
Set this to true to prevent wandb from saving notebooks or git diffs. We’ll still save the current commit if we’re in a git repo.
WANDB_DOCKER
Set this to a docker image digest to enable restoring of runs. This is set automatically with the wandb docker command. You can obtain an image digest by running wandb docker my/image/name:tag --digest
WANDB_ENTITY
The entity associated with your run. If you have run wandb init in the directory of your training script, it will create a directory named wandb and will save a default entity which can be checked into source control. If you don’t want to create that file or want to override the file you can use the environmental variable.
WANDB_ERROR_REPORTING
Set this to false to prevent wandb from logging fatal errors to its error tracking system.
WANDB_HOST
Set this to the hostname you want to see in the wandb interface if you don’t want to use the system provided hostname
WANDB_IGNORE_GLOBS
Set this to a comma separated list of file globs to ignore. These files will not be synced to the cloud.
WANDB_JOB_NAME
Specify a name for any jobs created by wandb.
WANDB_JOB_TYPE
Specify the job type, like “training” or “evaluation” to indicate different types of runs. See grouping for more info.
WANDB_MODE
If you set this to “offline” wandb will save your run metadata locally and not sync to the server. If you set this to disabled wandb will turn off completely.
WANDB_NAME
The human-readable name of your run. If not set it will be randomly generated for you
WANDB_NOTEBOOK_NAME
If you’re running in jupyter you can set the name of the notebook with this variable. We attempt to auto detect this.
WANDB_NOTES
Longer notes about your run. Markdown is allowed and you can edit this later in the UI.
WANDB_PROJECT
The project associated with your run. This can also be set with wandb init, but the environmental variable will override the value.
WANDB_RESUME
By default this is set to never. If set to auto wandb will automatically resume failed runs. If set to must forces the run to exist on startup. If you want to always generate your own unique ids, set this to allow and always set WANDB_RUN_ID.
WANDB_RUN_GROUP
Specify the experiment name to automatically group runs together. See grouping for more info.
WANDB_RUN_ID
Set this to a globally unique string (per project) corresponding to a single run of your script. It must be no longer than 64 characters. All non-word characters will be converted to dashes. This can be used to resume an existing run in cases of failure.
WANDB_SILENT
Set this to true to silence wandb log statements. If this is set all logs will be written to WANDB_DIR/debug.log
WANDB_SHOW_RUN
Set this to true to automatically open a browser with the run url if your operating system supports it.
WANDB_TAGS
A comma separated list of tags to be applied to the run.
WANDB_USERNAME
The username of a member of your team associated with the run. This can be used along with a service account API key to enable attribution of automated runs to members of your team.
WANDB_USER_EMAIL
The email of a member of your team associated with the run. This can be used along with a service account API key to enable attribution of automated runs to members of your team.
Singularity environments
If you’re running containers in Singularity you can pass environment variables by pre-pending the above variables with SINGULARITYENV_. More details about Singularity environment variables can be found here.
Running on AWS
If you’re running batch jobs in AWS, it’s easy to authenticate your machines with your W&B credentials. Get your API key from your settings page, and set the WANDB_API_KEY environment variable in the AWS batch job spec.