Use the interactive Queue monitoring dashboard to view when a launch queue is in heavy use or idle, visualize workloads that are running, and spot inefficient jobs. The launch queue dashboard is especially useful for deciding whether or not you are effectively using your compute hardware or cloud resources.
For deeper analysis, the page links to the W&B experiment tracking workspace and to external infrastructure monitoring providers like Datadog, NVIDIA Base Command, or cloud consoles.
Queue monitoring dashboards are currently available only in the W&B Multi-tenant Cloud deployment option.
Dashboard and plots
Use the Monitor tab to view the activity of a queue that occurred during the last seven days. Use the left panel to control time ranges, grouping, and filters.
The dashboard contains a number of plots answering common questions about performance and efficiency. The proceeding sections describe UI elements of queue dashboards.
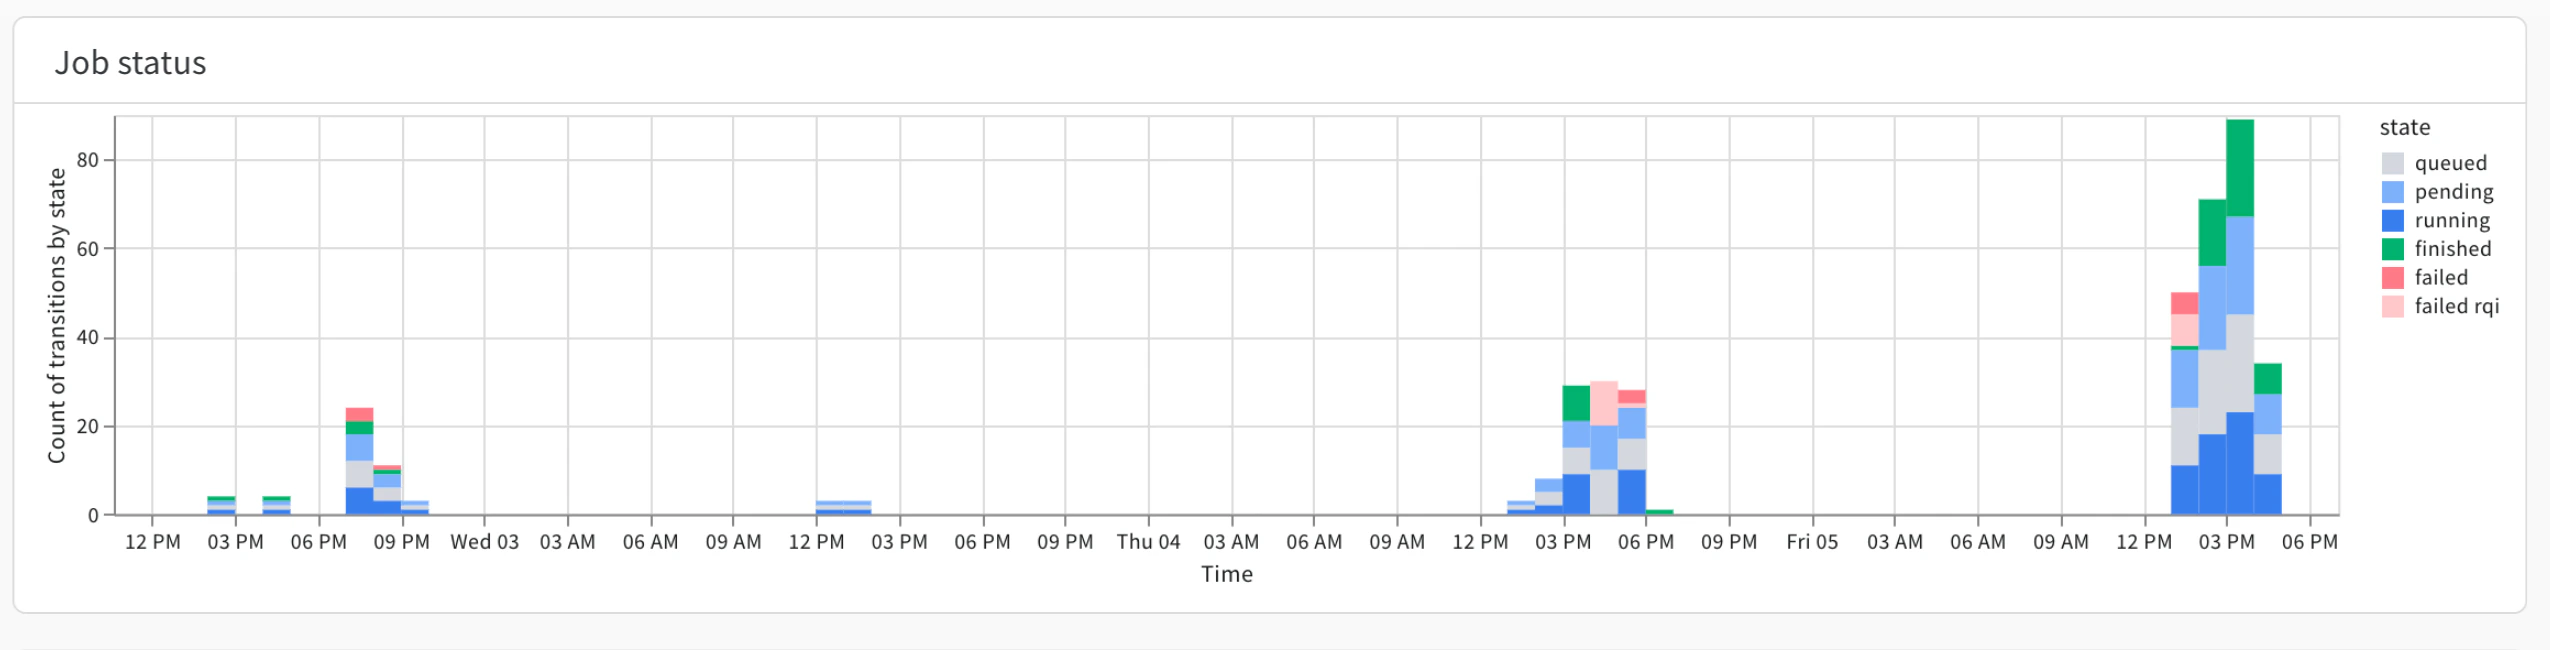
Job status
The Job status plot shows how many jobs are running, pending, queued, or completed in each time interval. Use the Job status plot for identifying periods of idleness in the queue.
For example, suppose you have a fixed resource (such as DGX BasePod). If you observe an idle queue with the fixed resource, this might suggest an opportunity to run lower-priority pre-emptible launch jobs such as sweeps.
On the other hand, suppose you use a cloud resource and you see periodic bursts of activity. Periodic bursts of activity might suggest an opportunity to save money by reserving resources for particular times.
To the right of the plot is a key that shows which colors represent the status of a launch job.
Queued items might indicate opportunities to shift workloads to other queues. A spike in failures can identify users who might need help with their launch job setup.
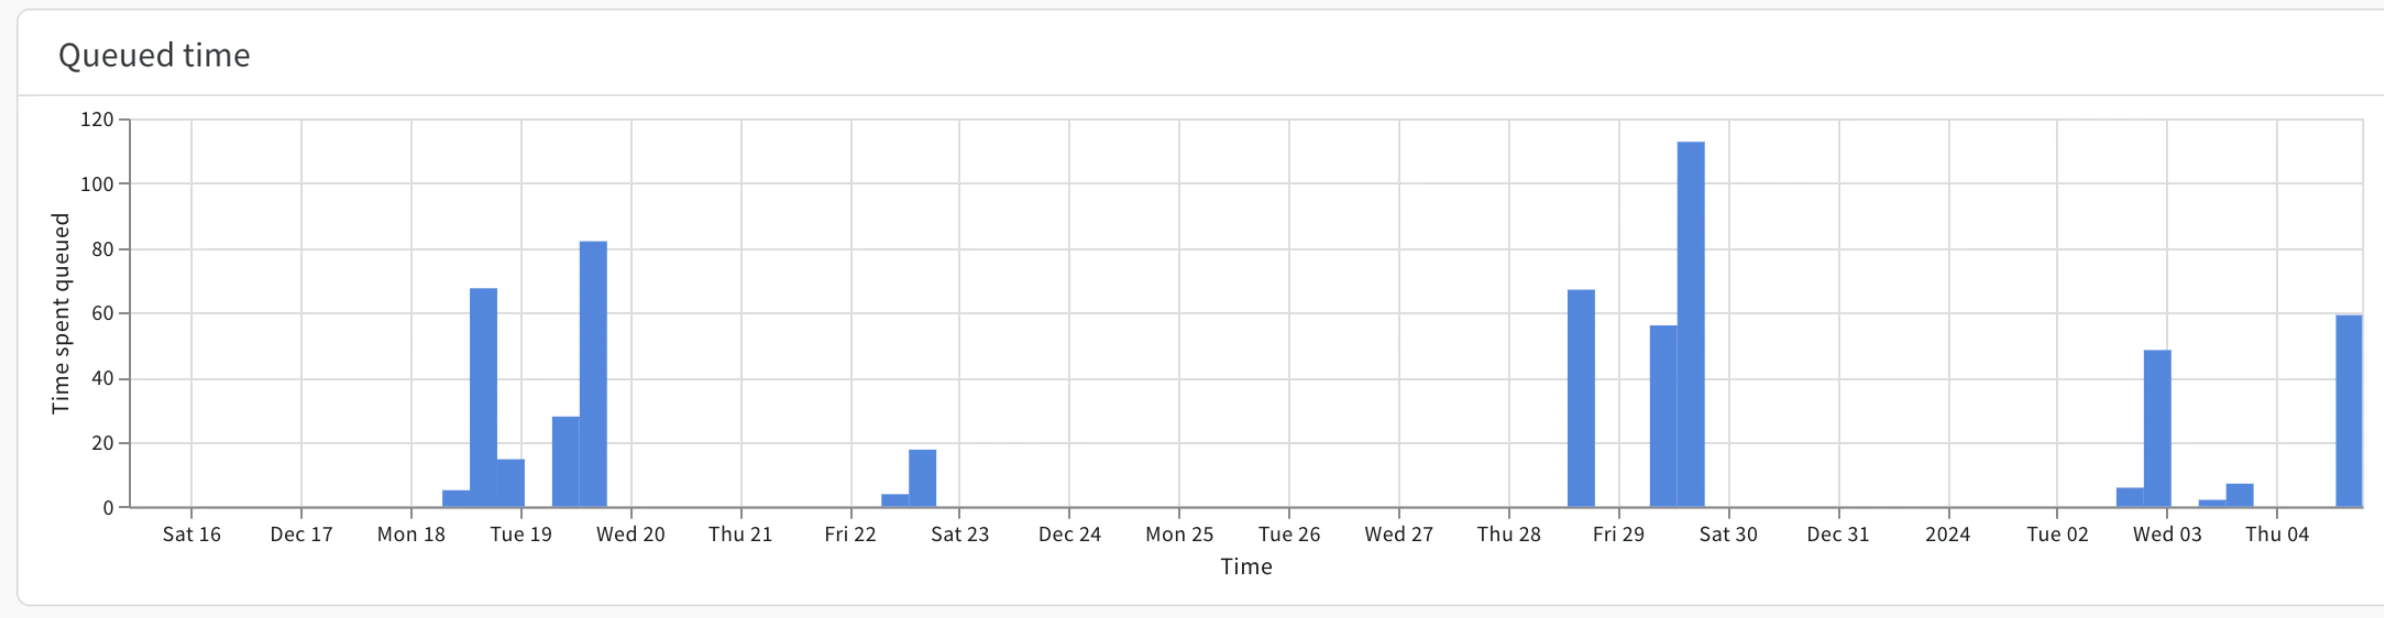
Queued time
The Queued time plots shows the amount of time (in seconds) that a launch job was on a queue for a given date or time range.
The x-axis shows a time frame that you specify and the y-axis shows the time (in seconds) a launch job was on a launch queue. For example, suppose on a given day there are 10 launch jobs queued. The Queue time plot shows 600 seconds if those 10 launch jobs wait an average of 60 seconds each.
Use the Queued time plot to identify users affected by long queue times.
Grouping control in the left bar.
which can be particularly helpful for identifying which users and jobs are feeling the pain of scarce queue capacity.
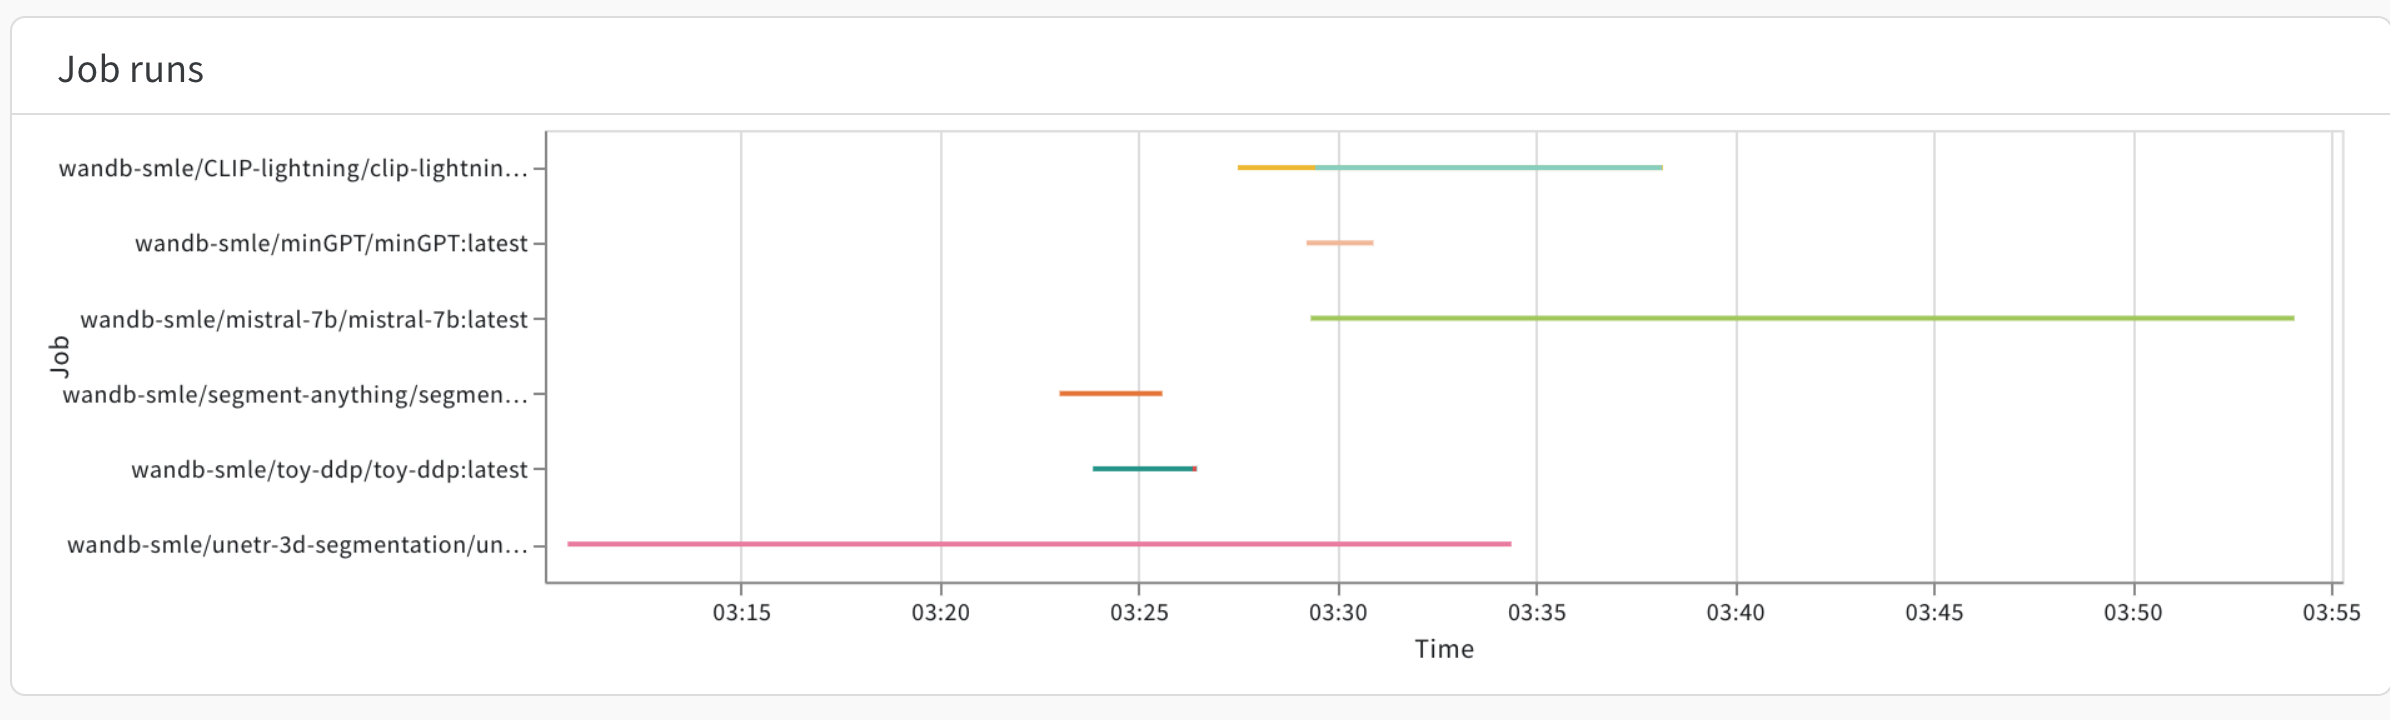
Job runs
This plot shows the start and end of every job executed in a time period, with distinct colors for each run. This makes it easy to see at a glance what workloads the queue was processing at a given time.
Use the Select tool in the bottom right of the panel to brush over jobs to populate details in the table below.
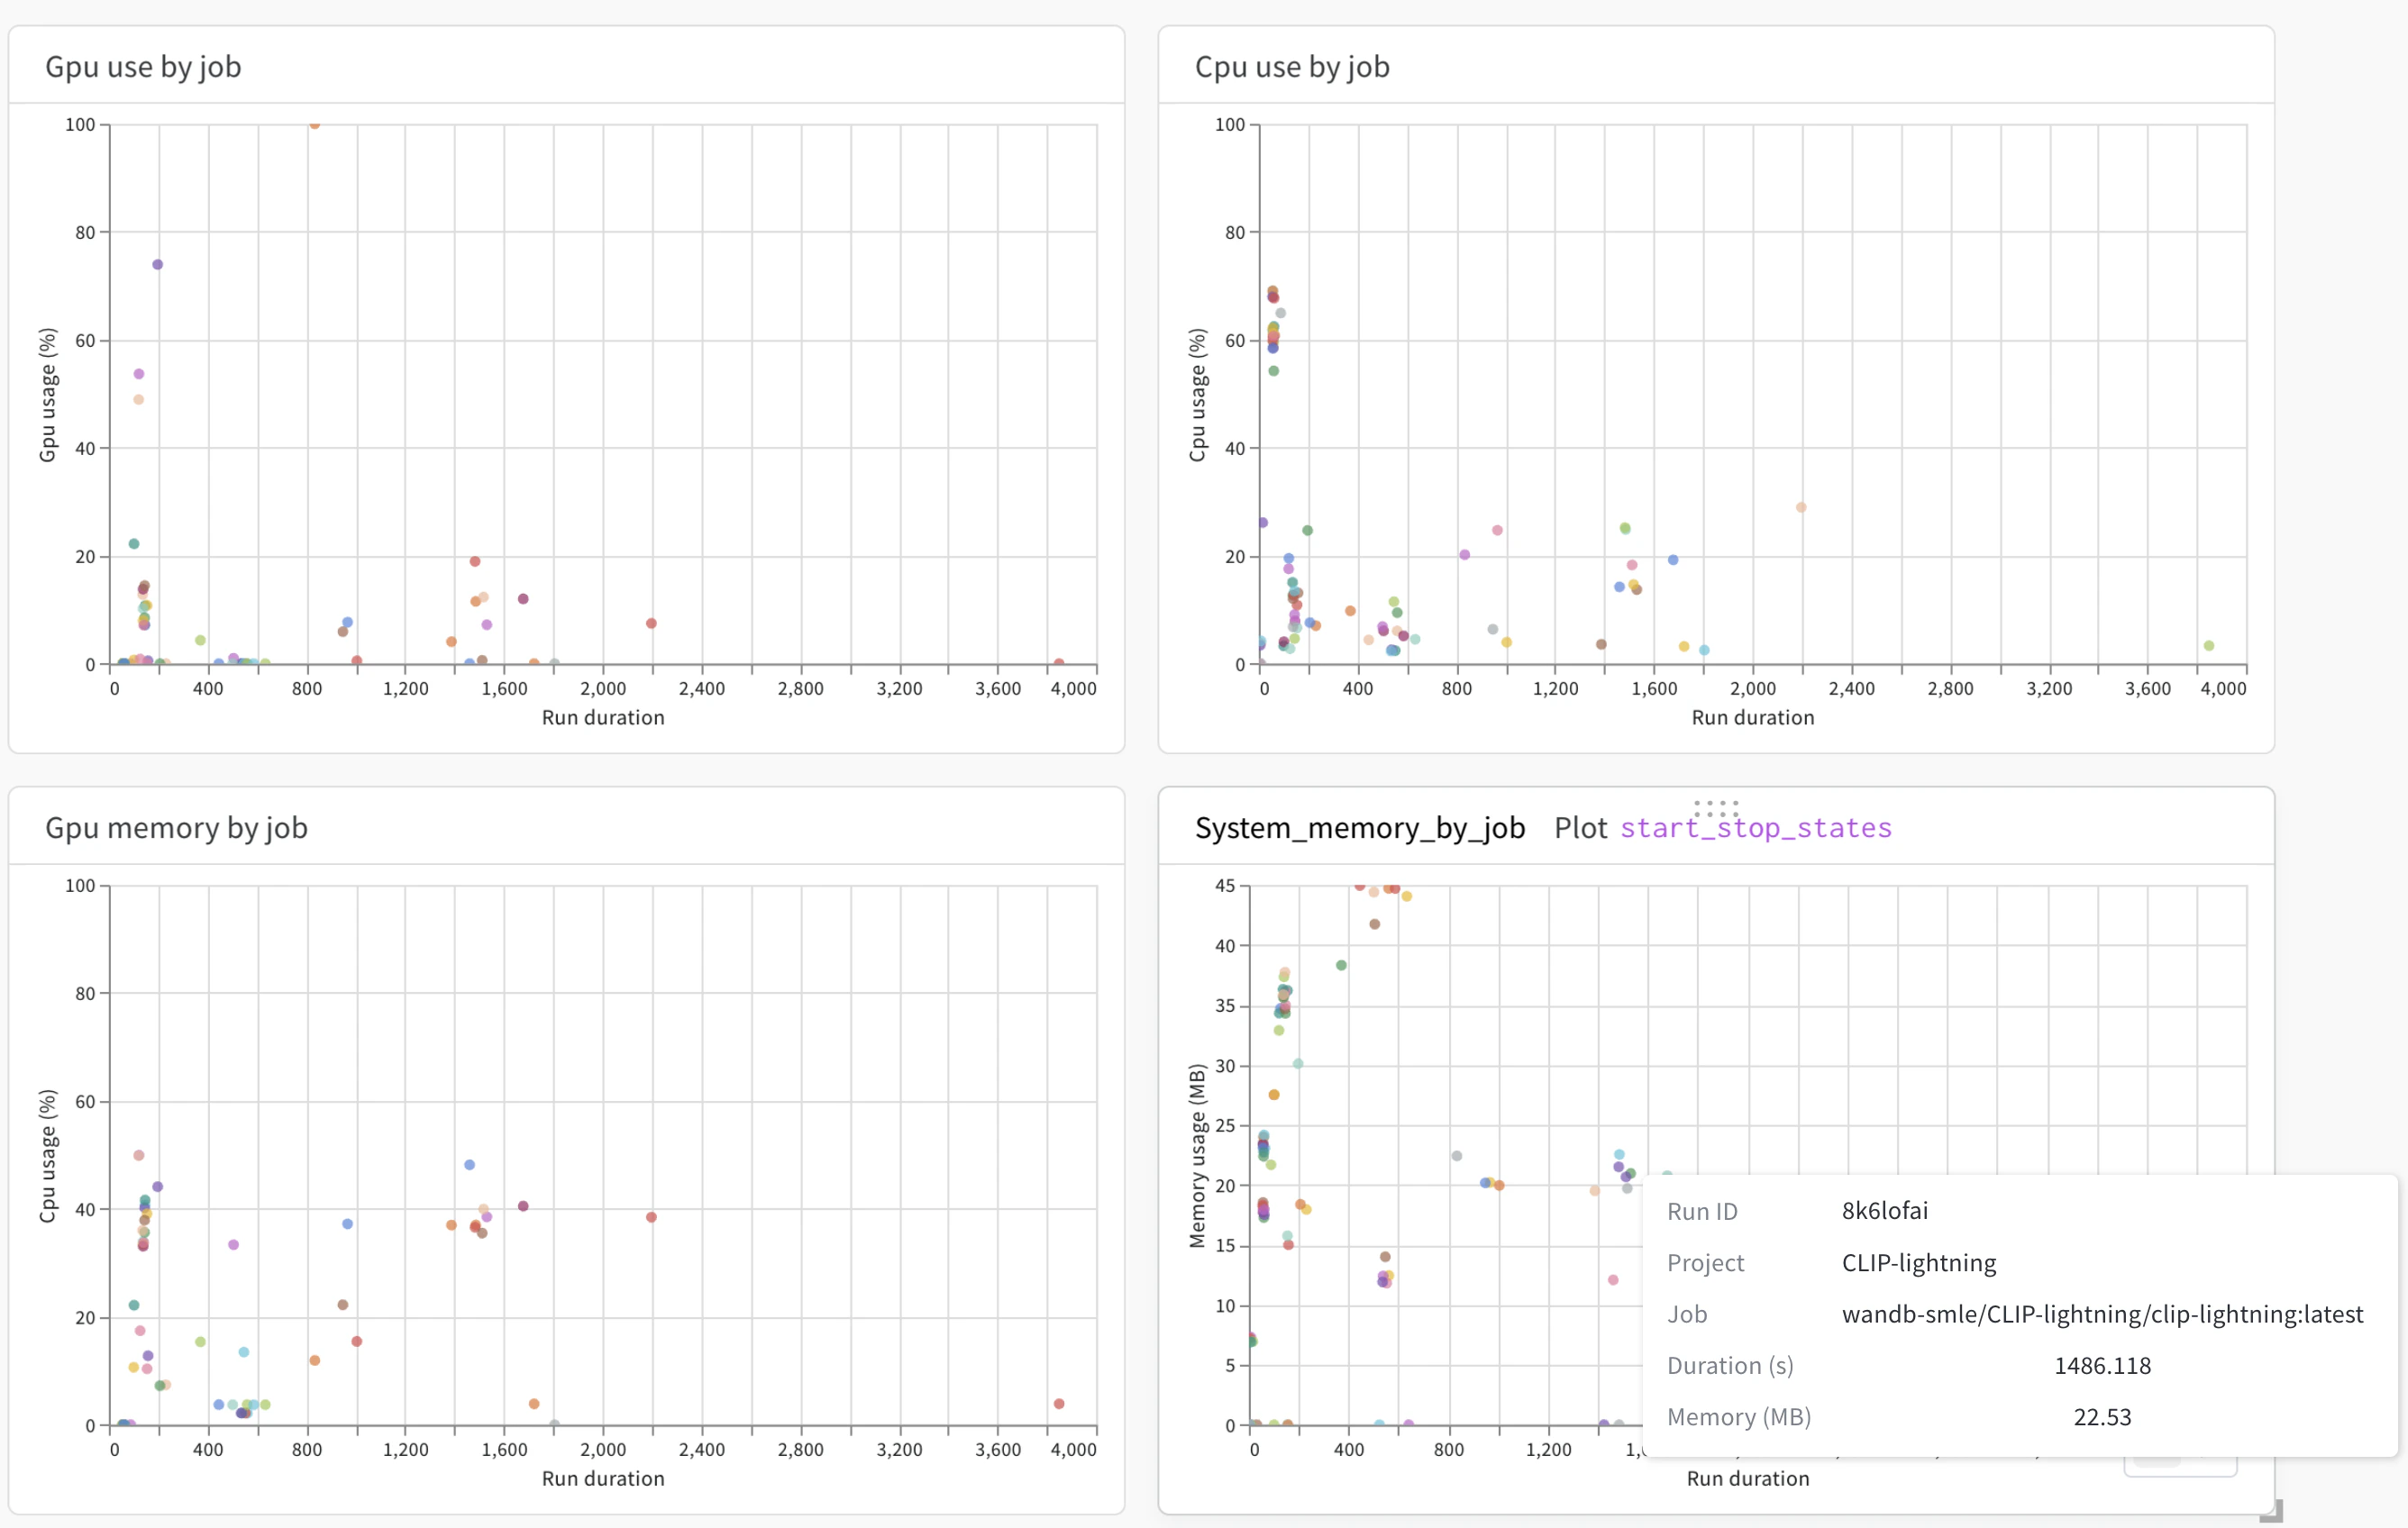
CPU and GPU usage
Use the GPU use by a job, CPU use by a job, GPU memory by job, and System memory by job to view the efficiency of your launch jobs.
For example, you can use the GPU memory by job to view if a W&B run took a long time to complete and whether or not it used a low percentage of its CPU cores.
The x-axis of each plot shows the duration of a W&B run (created by a launch job) in seconds. Hover your mouse over a data point to view information about a W&B run such as the run ID, the project the run belongs to, the launch job that created the W&B run and more.
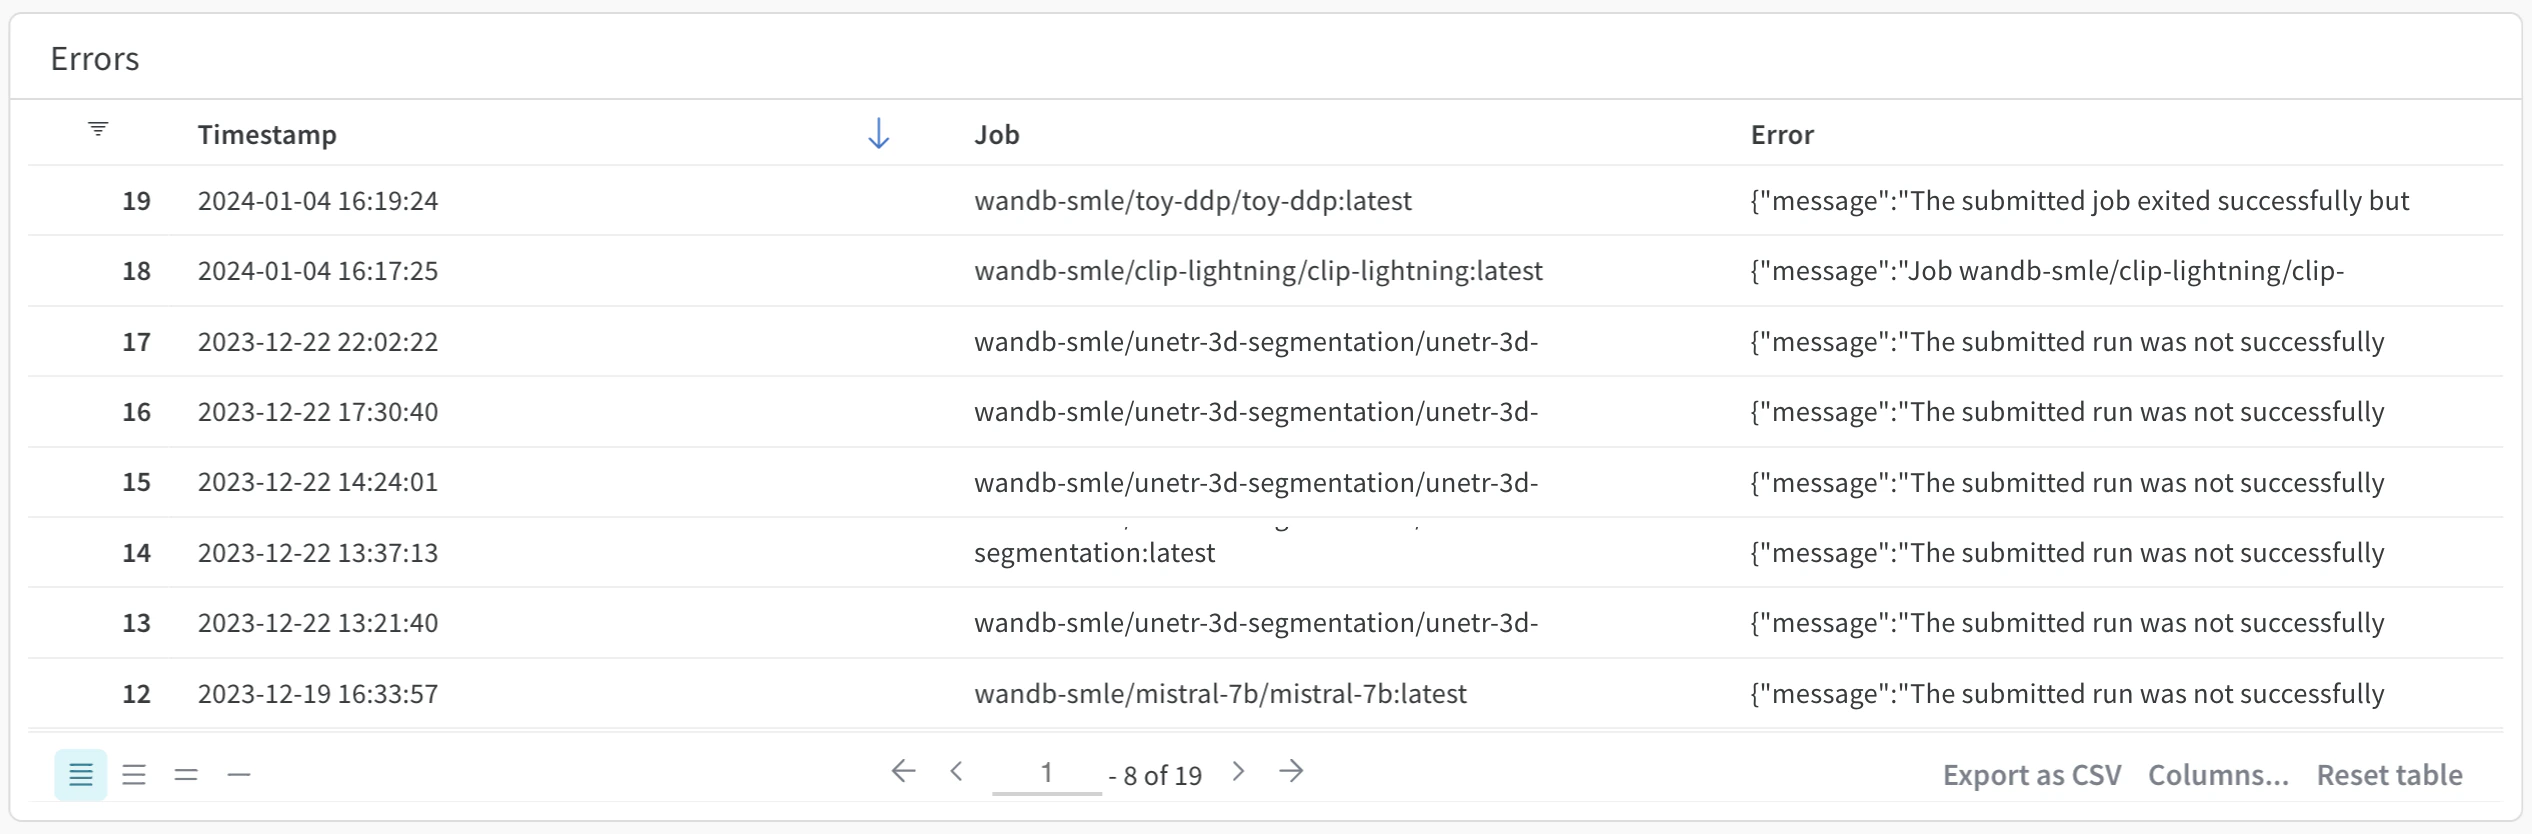
Errors
The Errors panel shows errors that occurred on a given launch queue. More specifically, the Errors panel shows a timestamp of when the error occurred, the name of the launch job where the error comes from, and the error message that was created. By default, errors are ordered from latest to oldest.
Use the Errors panel to identify and unblock users.
External links
The queue observability dashboard’s view is consistent across all queue types, but in many cases, it can be useful to jump directly into environment-specific monitors. To accomplish this, add a link from the console directly from the queue observability dashboard.
At the bottom of the page, click Manage Links to open a panel. Add the full URL of the page you want. Next, add a label. Links that you add appear in the External Links section.