Featured articles
Here are the most commonly asked questions across all categories.- What does
wandb.initdo to my training process? - How do I use custom CLI commands with sweeps?
- Is it possible to save metrics offline and sync them to W&B later?
- How can I configure the name of the run in my training code?
Still can't find what you are looking for?
Can I get an academic plan as a student?
Can I get an academic plan as a student?
- Visit the Pricing page on the wandb.com.
- Apply for the academic plan.
- Alternatively, start with a 30-day trial and convert it to an academic plan by visiting the W&B academic application page.
Who has access to my artifacts?
Who has access to my artifacts?
- In a private project, only team members can access artifacts.
- In a public project, all users can read artifacts, while only team members can create or modify them.
- In an open project, all users can read and write artifacts.
Artifacts Workflows
This section outlines workflows for managing and editing Artifacts. Many workflows utilize the W&B API, a component of the client library that provides access to W&B-stored data.How can I access the data logged to my runs directly and programmatically?
How can I access the data logged to my runs directly and programmatically?
wandb.log. Access the history object using the API:Is there a way to add extra values to a sweep, or do I need to start a new one?
Is there a way to add extra values to a sweep, or do I need to start a new one?
Is there a way to add more seats?
Is there a way to add more seats?
- Contact the Account Executive or support team ([email protected]) for assistance.
- Provide the organization name and the desired number of seats.
How do I add Plotly or Bokeh Charts into Tables?
How do I add Plotly or Bokeh Charts into Tables?
- Using Plotly
- Using Bokeh
Is it possible to add the same service account to multiple teams?
Is it possible to add the same service account to multiple teams?
Adding multiple authors to a report
Adding multiple authors to a report
If I am the admin of my local instance, how should I manage it?
If I am the admin of my local instance, how should I manage it?
Is there an anaconda package for Weights and Biases?
Is there an anaconda package for Weights and Biases?
pip or conda. For conda, obtain the package from the conda-forge channel.- pip
- conda
What are features that are not available to anonymous users?
What are features that are not available to anonymous users?
- No persistent data: Runs save for 7 days in an anonymous account. Claim anonymous run data by saving it to a real account.
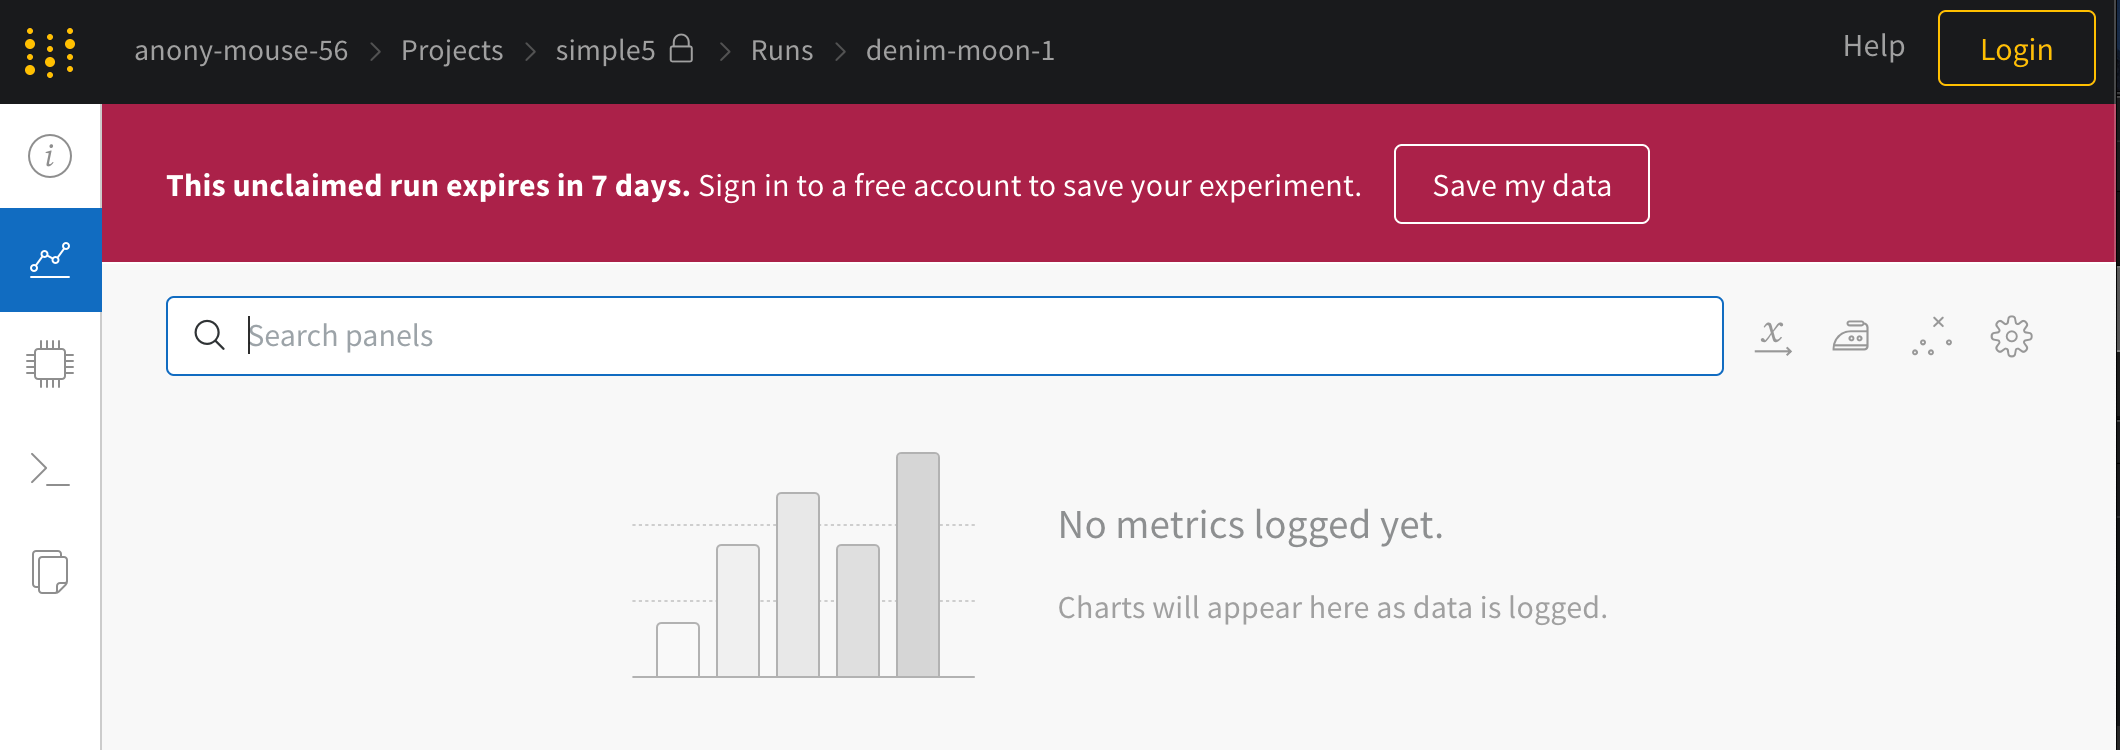
-
No artifact logging: A warning appears on the command line when attempting to log an artifact to an anonymous run:
- No profile or settings pages: The UI does not include certain pages, as they are only useful for real accounts.
How much storage does each artifact version use?
How much storage does each artifact version use?

animals that contains two image files, cat.png and dog.png:v0.When adding a new image, rat.png, a new artifact version, v1, is created with the following contents:v1 tracks a total of 6MB, but occupies only 3MB of space since it shares the remaining 3MB with v0. Deleting v1 reclaims the 3MB of storage associated with rat.png. Deleting v0 transfers the storage costs of cat.png and dog.png to v1, increasing its storage size to 6MB.Using artifacts with multiple architectures and runs?
Using artifacts with multiple architectures and runs?
- Create a new artifact for each distinct model architecture. Use the
metadataattribute of artifacts to provide detailed descriptions of the architecture, similar to the use ofconfigfor a run. - For each model, log checkpoints periodically with
log_artifact. W&B builds a history of these checkpoints, labeling the most recent one with thelatestalias. Refer to the latest checkpoint for any model architecture usingarchitecture-name:latest.
How do I best log models from runs in a sweep?
How do I best log models from runs in a sweep?
Best practices to organize hyperparameter searches
Best practices to organize hyperparameter searches
wandb.init(tags='your_tag'). This allows efficient filtering of project runs by selecting the corresponding tag in a Project Page’s Runs Table.For more information on wandb.init(), see the wandb.init() reference.Do you have a bug bounty program?
Do you have a bug bounty program?
How do I cancel my subscription?
How do I cancel my subscription?
- Contact the support team ([email protected]).
- Provide the organization name, email associated with the account, and username.
How can I change my account from corporate to academic?
How can I change my account from corporate to academic?
-
Link your academic email:
- Access account settings.
- Add and set the academic email as the primary email.
-
Apply for an academic plan:
- Visit the W&B academic application page.
- Submit the application for review.
How do I change my billing address?
How do I change my billing address?
How can I change the directory my sweep logs to locally?
How can I change the directory my sweep logs to locally?
WANDB_DIR. For example:Is it possible to change the group assigned to a run after completion?
Is it possible to change the group assigned to a run after completion?
Is it possible to change the username?
Is it possible to change the username?
Does the W&B client support Python 2?
Does the W&B client support Python 2?
pip install --upgrade wandb on a Python 2.7 system installs only new releases of the 0.10.x series. Support for the 0.10.x series includes critical bug fixes and patches only. The last version of the 0.10.x series that supports Python 2.7 is 0.10.33.Does the W&B client support Python 3.5?
Does the W&B client support Python 3.5?
How can I compare images or media across epochs or steps?
How can I compare images or media across epochs or steps?
How can I configure the name of the run in my training code?
How can I configure the name of the run in my training code?
wandb.init with an experiment name. For example: wandb.init(name="my_awesome_run").I converted my report to WYSIWYG but want to revert back to Markdown
I converted my report to WYSIWYG but want to revert back to Markdown
cmd+z to undo.If options to revert are unavailable because of a closed session, consider discarding the draft or editing from the last saved version. If neither works, contact W&B Support.If wandb crashes, will it possibly crash my training run?
If wandb crashes, will it possibly crash my training run?
Is it possible to create a new account with an email that was previously used for a deleted account?
Is it possible to create a new account with an email that was previously used for a deleted account?
Who can create a team? Who can add or delete people from a team? Who can delete projects?
Who can create a team? Who can add or delete people from a team? Who can delete projects?
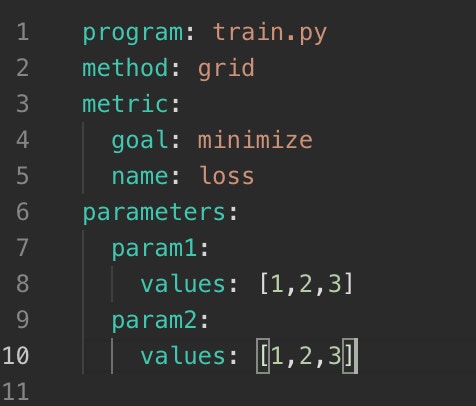
How do I use custom CLI commands with sweeps?
How do I use custom CLI commands with sweeps?
train.py, providing values that the script parses:command key in the YAML file. Based on the previous example, the configuration appears as follows:${args} key expands to all parameters in the sweep configuration, formatted for argparse as --param1 value1 --param2 value2.For additional arguments outside of argparse, implement the following:python might refer to Python 2. To ensure invocation of Python 3, use python3 in the command configuration:Is there a dark mode?
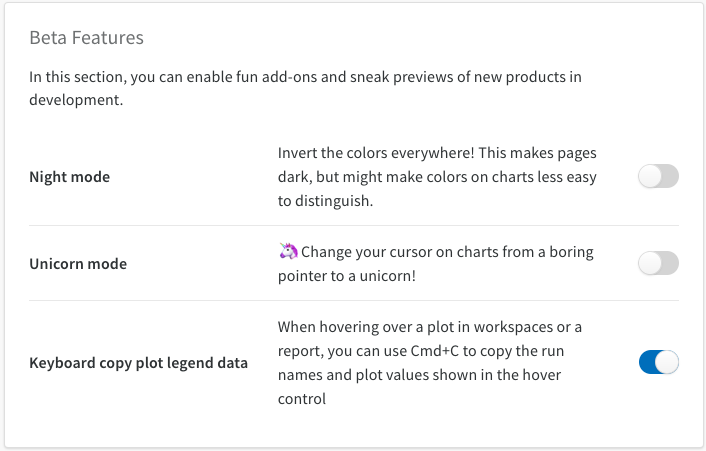
Is there a dark mode?
- Go to your W&B account settings.
- Scroll to the Public preview features section.
- In UI Display, select Dark mode from the dropdown.
How do I deal with network issues?
How do I deal with network issues?
wandb: Network error (ConnectionError), entering retry loop, use the following solutions:- Upgrade the SSL certificate. On an Ubuntu server, run
update-ca-certificates. A valid SSL certificate is essential for syncing training logs to mitigate security risks. - If the network connection is unstable, operate in offline mode by setting the optional environment variable
WANDB_MODEtooffline, and sync files later from a device with Internet access. - Consider using W&B Private Hosting, which runs locally and avoids syncing to cloud servers.
SSL CERTIFICATE_VERIFY_FAILED error, this issue might stem from a company firewall. Configure local CAs and execute:export REQUESTS_CA_BUNDLE=/etc/ssl/certs/ca-certificates.crtHow do you delete a custom chart preset?
How do you delete a custom chart preset?
How do I delete my organization account?
How do I delete my organization account?
How do I delete a panel grid?
How do I delete a panel grid?
How do I delete a team from my account?
How do I delete a team from my account?
- Access team settings as an admin.
- Click the Delete button at the bottom of the page.
I didn't name my run. Where is the run name coming from?
I didn't name my run. Where is the run name coming from?
pleasant-flower-4 and `misunderstood-glade-2.What is the difference between `.log()` and `.summary`?
What is the difference between `.log()` and `.summary`?
run.log() whenever accuracy changes. By default, run.log() updates the summary value unless set manually for that metric.The scatterplot and parallel coordinate plots use the summary value, while the line plot shows all values recorded by run.log.Some users prefer to set the summary manually to reflect the optimal accuracy instead of the most recent accuracy logged.What is the difference between team and entity? As a user - what does entity mean for me?
What is the difference between team and entity? As a user - what does entity mean for me?
wandb.init(entity="example-team").What is the difference between team and organization?
What is the difference between team and organization?
What is the difference between wandb.init modes?
What is the difference between wandb.init modes?
online(default): The client sends data to the wandb server.offline: The client stores data locally on the machine instead of sending it to the wandb server. Use thewandb synccommand to synchronize the data later.disabled: The client simulates operation by returning mocked objects and prevents any network communication. All logging is turned off, but all API method stubs remain callable. This mode is typically used for testing.
How is W&B different from TensorBoard?
How is W&B different from TensorBoard?
- Model Reproducibility: W&B facilitates experimentation, exploration, and model reproduction. It captures metrics, hyperparameters, code versions, and saves model checkpoints to ensure reproducibility.
- Automatic Organization: W&B streamlines project handoffs and vacations by providing an overview of all attempted models, which saves time by preventing the re-execution of old experiments.
- Quick Integration: Integrate W&B into your project in five minutes. Install the free open-source Python package and add a few lines of code. Logged metrics and records appear with each model run.
- Centralized Dashboard: Access a consistent dashboard regardless of where training occurs—locally, on lab clusters, or cloud spot instances. Eliminate the need to manage TensorBoard files across different machines.
- Robust Filtering Table: Search, filter, sort, and group results from various models efficiently. Easily identify the best-performing models for different tasks, an area where TensorBoard often struggles with larger projects.
- Collaboration Tools: W&B enhances collaboration for complex machine learning projects. Share project links and utilize private teams for result sharing. Create reports with interactive visualizations and markdown descriptions for work logs or presentations.
How do I downgrade my subscription plan?
How do I downgrade my subscription plan?
Who can edit and share reports?
Who can edit and share reports?
Embedding Reports
Embedding Reports
How do I enable code logging with Sweeps?
How do I enable code logging with Sweeps?
wandb.log_code() after initializing the W&B Run. This action is necessary even when code logging is enabled in the W&B profile settings. For advanced code logging, refer to the docs for wandb.log_code() here.Do environment variables overwrite the parameters passed to wandb.init()?
Do environment variables overwrite the parameters passed to wandb.init()?
wandb.init override environment variables. To set a default directory other than the system default when the environment variable isn’t set, use wandb.init(dir=os.getenv("WANDB_DIR", my_default_override)).What is the `Est. Runs` column?
What is the `Est. Runs` column?

expected_run_count attribute of the Sweep object within the W&B SDK:How do I export a list of users from my W&B Organisation?
How do I export a list of users from my W&B Organisation?
How can I fetch these Version IDs and ETags in W&B?
How can I fetch these Version IDs and ETags in W&B?
Which files should I check when my code crashes?
Which files should I check when my code crashes?
debug.log and debug-internal.log in wandb/run-<date>_<time>-<run-id>/logs in the directory where your code is running.How can I resolve the Filestream rate limit exceeded error?
How can I resolve the Filestream rate limit exceeded error?
- Reduce logging frequency or batch logs to decrease API requests.
- Stagger experiment start times to avoid simultaneous API requests.
- Verify that the issue does not arise from a temporary server-side problem by checking W&B status updates.
- Reach out to W&B support ([email protected]) with details of the experimental setup to request an increase in rate limits.
Filter and delete unwanted reports
Filter and delete unwanted reports
How do I find my API key?
How do I find my API key?
- Navigate to the W&B authorization page. Log in if necessary.
- Alternatively, access your profile:
- Click your user profile in the upper right corner.
- Select “User Settings.”
- Scroll to the “Danger Zone” section.
- Click “Reveal” next to “API Keys.”
How do I find an artifact from the best run in a sweep?
How do I find an artifact from the best run in a sweep?
How can I find the artifacts logged or consumed by a run? How can I find the runs that produced or consumed an artifact?
How can I find the artifacts logged or consumed by a run? How can I find the runs that produced or consumed an artifact?
- From an Artifact
- From a Run
Can we flag boolean variables as hyperparameters?
Can we flag boolean variables as hyperparameters?
${args_no_boolean_flags} macro in the command section of the configuration to pass hyperparameters as boolean flags. This macro automatically includes boolean parameters as flags. If param is True, the command receives --param. If param is False, the flag is omitted.What formula do you use for your smoothing algorithm?
What formula do you use for your smoothing algorithm?
What really good functionalities are hidden and where can I find those?
What really good functionalities are hidden and where can I find those?
Why is nothing showing up in my graphs?
Why is nothing showing up in my graphs?
wandb.log call. This situation may occur if the run takes a long time to complete a step. To expedite data logging, log multiple times per epoch instead of only at the end.How can I change the colors of each run in the same group?
How can I change the colors of each run in the same group?
Can you group runs by tags?
Can you group runs by tags?
Can I group runs without using the 'Group' feature?
Can I group runs without using the 'Group' feature?
Group button which is available in the Workspace and Runs views of the project.How can I be removed from a team?
How can I be removed from a team?
How can I define the local location for `wandb` files?
How can I define the local location for `wandb` files?
WANDB_DIR=<path>orwandb.init(dir=<path>): Controls the location of thewandbfolder created for your training script. Defaults to./wandb. This folder stores Run’s data and logsWANDB_ARTIFACT_DIR=<path>orwandb.Artifact().download(root="<path>"): Controls the location where artifacts are downloaded. Defaults to./artifactsWANDB_CACHE_DIR=<path>: This is the location where artifacts are created and stored when you callwandb.Artifact. Defaults to~/.cache/wandbWANDB_CONFIG_DIR=<path>: Where config files are stored. Defaults to~/.config/wandbWANDB_DATA_DIR=<PATH>: Controls the location used for staging artifacts during upload. Defaults to~/.cache/wandb-data/.
How can I delete multiple runs in bulk instead of one at a time?
How can I delete multiple runs in bulk instead of one at a time?
How can I delete my user account?
How can I delete my user account?
How can I disable logging of system metrics to W&B?
How can I disable logging of system metrics to W&B?
_disable_stats to True:How can I log in to W&B Server?
How can I log in to W&B Server?
- Set the environment variable
WANDB_BASE_URLto the Server URL. - Set the
--hostflag ofwandb loginto the Server URL.
How can I change how frequently to log system metrics?
How can I change how frequently to log system metrics?
_stats_sampling_interval to a number of seconds, expressed as a float. Default: 10.0.How can I fix an error like `AttributeError: module 'wandb' has no attribute ...`?
How can I fix an error like `AttributeError: module 'wandb' has no attribute ...`?
AttributeError: module 'wandb' has no attribute 'init' or AttributeError: module 'wandb' has no attribute 'login' when importing wandb in Python, wandb is not installed or the installation is corrupted, but a wandb directory exists in the current working directory. To fix this error, uninstall wandb, delete the directory, then install wandb:How can I see files that do not appear in the Files tab?
How can I see files that do not appear in the Files tab?
How do I fix the error `resume='must' but run (<run_id>) doesn't exist`?
How do I fix the error `resume='must' but run (<run_id>) doesn't exist`?
resume='must' but run (<run_id>) doesn't exist, the run you are attempting to resume does not exist within the project or entity. Ensure that you are logged in to the correct instance and that the project and entity are set:wandb login --relogin to verify that you are authenticated.Incorporating LaTeX
Incorporating LaTeX
/ and navigate to the inline equations tab to insert LaTeX content.How do I fix Invalid Authentication (401) errors with W&B Inference?
How do I fix Invalid Authentication (401) errors with W&B Inference?
Verify your API key
- Get a new API key at https://wandb.ai/authorize
- Check for extra spaces or missing characters when copying
- Store your API key securely
Check your project configuration
Ensure your project is formatted correctly as<your-team>/<your-project>:Python example:Common mistakes
- Using personal entity instead of team name
- Misspelling team or project name
- Missing forward slash between team and project
- Using an expired or deleted API key
Still having issues?
- Verify the team and project exist in your W&B account
- Ensure you have access to the specified team
- Try creating a new API key if the current one isn’t working
What are the best practices for handling W&B Inference errors?
What are the best practices for handling W&B Inference errors?
1. Always implement error handling
Wrap API calls in try-except blocks:2. Use retry logic with exponential backoff
3. Monitor your usage
- Track credit usage in the W&B Billing page
- Set up alerts before hitting limits
- Log API usage in your application
4. Handle specific error codes
5. Set appropriate timeouts
Configure reasonable timeouts for your use case:Additional tips
- Log errors with timestamps for debugging
- Use async operations for better concurrency handling
- Implement circuit breakers for production systems
- Cache responses when appropriate to reduce API calls
Why am I getting insufficient quota errors (402) with W&B Inference?
Why am I getting insufficient quota errors (402) with W&B Inference?
- Check your credit balance in the W&B Billing page
- Purchase more credits or upgrade your plan
- Request a limit increase from support
Why does W&B Inference say my country or region is not supported?
Why does W&B Inference say my country or region is not supported?
Why this happens
W&B Inference has geographic restrictions due to compliance and regulatory requirements. The service is only accessible from supported geographic locations.What you can do
-
Check the Terms of Service
- Review the Terms of Service for the current list of supported locations
-
Use from a supported location
- Access the service when in a supported country or region
- Consider using your organization’s resources in supported locations
-
Contact your account team
- Enterprise customers can discuss options with their account executive
- Some organizations may have special arrangements
Error details
When you see this error:Why am I getting rate limit errors (429) with W&B Inference?
Why am I getting rate limit errors (429) with W&B Inference?
- Reduce the number of parallel requests
- Add delays between requests
- Implement exponential backoff
- Note: Rate limits apply per W&B project
Best practices to avoid rate limits
-
Implement retry logic with exponential backoff:
- Use batch processing instead of parallel requests
- Monitor your usage in the W&B Billing page
Default spending caps
- Pro accounts: $6,000/month
- Enterprise accounts: $700,000/year
How do I fix server errors (500, 503) with W&B Inference?
How do I fix server errors (500, 503) with W&B Inference?
Error types
500 - Internal Server Error
Message: “The server had an error while processing your request”This is a temporary internal error on the server side.503 - Service Overloaded
Message: “The engine is currently overloaded, please try again later”The service is experiencing high traffic.How to handle server errors
-
Wait before retrying
- 500 errors: Wait 30-60 seconds
- 503 errors: Wait 60-120 seconds
-
Use exponential backoff
-
Set appropriate timeouts
- Increase timeout values for your HTTP client
- Consider async operations for better handling
When to contact support
Contact support if:- Errors persist for more than 10 minutes
- You see patterns of failures at specific times
- Error messages contain additional details
- Error messages and codes
- Time when errors occurred
- Your code snippet (remove API keys)
- W&B entity and project names
How do I resolve a run initialization timeout error in wandb?
How do I resolve a run initialization timeout error in wandb?
- Retry initialization: Attempt to restart the run.
- Check network connection: Confirm a stable internet connection.
- Update wandb version: Install the latest version of wandb.
- Increase timeout settings: Modify the
WANDB_INIT_TIMEOUTenvironment variable: - Enable debugging: Set
WANDB_DEBUG=trueandWANDB_CORE_DEBUG=truefor detailed logs. - Verify configuration: Check that the API key and project settings are correct.
- Review logs: Inspect
debug.log,debug-internal.log,debug-core.log, andoutput.logfor errors.
InitStartError: Error communicating with wandb process
InitStartError: Error communicating with wandb process
- Linux and OS X
- Google Colab
How do I insert a table?
How do I insert a table?
How do I install the wandb Python library in environments without gcc?
How do I install the wandb Python library in environments without gcc?
wandb that states:psutil directly from a pre-built wheel. Determine your Python version and operating system at https://pywharf.github.io/pywharf-pkg-repo/psutil.For example, to install psutil on Python 3.8 in Linux:psutil, run pip install wandb to complete the installation of wandb.What if I want to integrate W&B into my project, but I don't want to upload any images or media?
What if I want to integrate W&B into my project, but I don't want to upload any images or media?
What happens if internet connection is lost while I'm training a model?
What happens if internet connection is lost while I'm training a model?
WANDB_MODE=offline. This configuration stores metrics locally on the hard drive. Later, call wandb sync DIRECTORY to stream the data to the server.How do I get added to a team on W&B?
How do I get added to a team on W&B?
- Contact a team admin or someone with administrative privileges to request an invite.
- Check your email for the invitation, and follow the instructions to join the team.
Can I just log metrics, no code or dataset examples?
Can I just log metrics, no code or dataset examples?
- Set
WANDB_DISABLE_CODEtotrueto turn off all code tracking. This action prevents retrieval of the git SHA and the diff patch. - Set
WANDB_IGNORE_GLOBSto*.patchto stop syncing the diff patch to the servers, while keeping it available locally for application withwandb restore.
- Navigate to the settings of your team at
https://wandb.ai/<team>/settings. Where<team>is the name of your team. - Scroll to the Privacy section.
- Toggle Enable code saving by default.
Can I just set the run name to the run ID?
Can I just set the run name to the run ID?
How do I kill a job with wandb?
How do I kill a job with wandb?
Ctrl+D on the keyboard to stop a script instrumented with W&B.How do I launch multiple runs from one script?
How do I launch multiple runs from one script?
wandb.init() as a context manager
because this finishes the run and marks it as failed if your script raises an
exception:run.finish() explicitly:Multiple active runs
Starting with wandb 0.19.10, you can set thereinit setting to "create_new"
to create multiple simultaneously active runs.reinit="create_new", including caveats about W&B
integrations.On a local instance, which files should I check when I have issues?
On a local instance, which files should I check when I have issues?
Debug Bundle. An admin can retrieve it from the /system-admin page by selecting the W&B icon in the top right corner and then choosing Debug Bundle.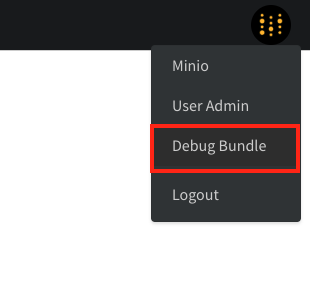
How can I log additional metrics after a run completes?
How can I log additional metrics after a run completes?
wandb.init() to a unique value for all processes within a single experiment. The Runs tab will group the table by group ID, ensuring that visualizations function properly. This approach enables concurrent experiments and training runs while logging results in one location.For simpler workflows, call wandb.init() with resume=True and id=UNIQUE_ID, then call wandb.init() again with the same id=UNIQUE_ID. Log normally with run.log() or run.summary(), and the run values will update accordingly.How do I log an artifact to an existing run?
How do I log an artifact to an existing run?
How do I log runs launched by continuous integration or internal tools?
How do I log runs launched by continuous integration or internal tools?
WANDB_USERNAME or WANDB_USER_EMAIL environment variables.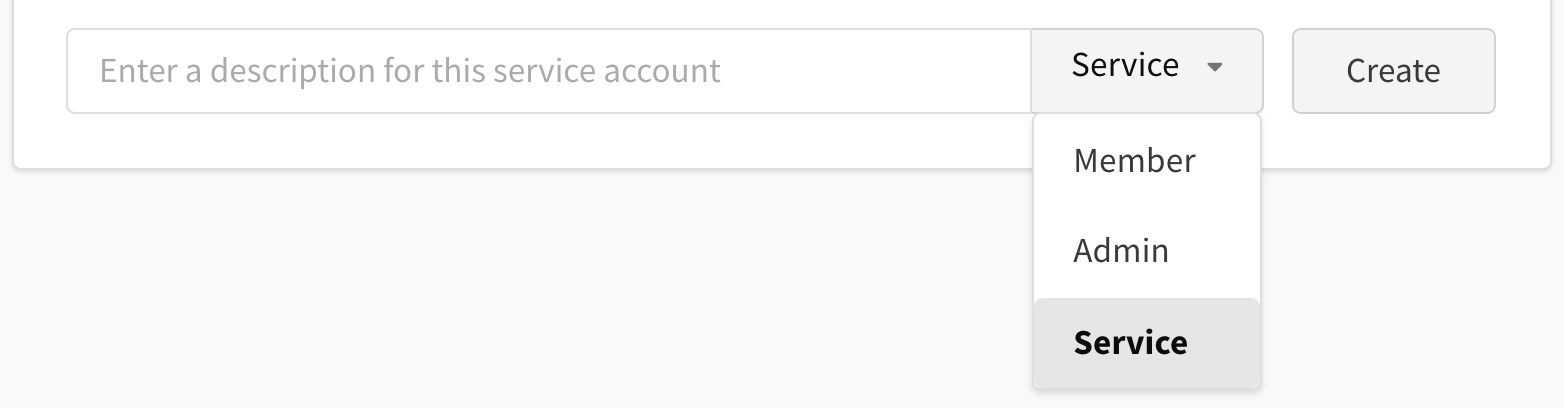
How do I log a list of values?
How do I log a list of values?
wandb.Run.log().- Using a dictionary
- As a histogram
How can I log a metric that doesn't change over time such as a final evaluation accuracy?
How can I log a metric that doesn't change over time such as a final evaluation accuracy?
run.log({'final_accuracy': 0.9}) updates the final accuracy correctly. By default, run.log({'final_accuracy': <value>}) updates run.settings['final_accuracy'], which reflects the value in the runs table.What if I want to log some metrics on batches and some metrics only on epochs?
What if I want to log some metrics on batches and some metrics only on epochs?
Can I log metrics on two different time scales?
Can I log metrics on two different time scales?
batch and epoch alongside your metrics. Use wandb.Run.log()({'train_accuracy': 0.9, 'batch': 200}) in one step and wandb.Run.log()({'val_accuracy': 0.8, 'epoch': 4}) in another. In the UI, set the desired value as the x-axis for each chart. To set a default x-axis for a specific index, use Run.define_metric(). For the example provided, use the following code:What happens when I log millions of steps to W&B? How is that rendered in the browser?
What happens when I log millions of steps to W&B? How is that rendered in the browser?
When should I log to my personal entity against my team entity?
When should I log to my personal entity against my team entity?
How do I log to the right wandb user on a shared machine?
How do I log to the right wandb user on a shared machine?
Does logging block my training?
Does logging block my training?
wandb.log function writes a line to a local file and does not block network calls. When calling wandb.init, a new process starts on the same machine. This process listens for filesystem changes and communicates with the web service asynchronously, allowing local operations to continue uninterrupted.How do I turn off logging?
How do I turn off logging?
wandb offline sets the environment variable WANDB_MODE=offline, preventing data from syncing to the remote W&B server. This action affects all projects, stopping the logging of data to W&B servers.To suppress warning messages, use the following code:Why can't I sort or filter metrics with certain characters?
Why can't I sort or filter metrics with certain characters?
Valid metric names
- Allowed characters: Letters (A-Z, a-z), digits (0-9), and underscores (_)
- Starting character: Names must start with a letter or underscore
- Pattern: Metric names should match
/^[_a-zA-Z][_a-zA-Z0-9]*$/
Examples
Valid metric names:Recommended solution
Replace invalid characters with valid characters such as underscores:- Instead of
"test acc", use"test_acc" - Instead of
"loss-train", use"loss_train" - Instead of
"acc,val", use"acc_val"
Is there a monthly subscription option for the teams plan?
Is there a monthly subscription option for the teams plan?
Is it possible to move a run from one project to another?
Is it possible to move a run from one project to another?
- Navigate to the project page with the run to be moved.
- Click on the Runs tab to open the runs table.
- Select the runs to move.
- Click the Move button.
- Choose the destination project and confirm the action.
wandb artifact get SDK command or the Api.artifact API to download the artifact, then use wandb artifact put or the Api.artifact API to upload it to the run’s new location.How to get multiple charts with different selected runs?
How to get multiple charts with different selected runs?
- Create multiple panel grids.
- Apply filters to select the desired run sets for each panel grid.
- Generate the desired charts within the panel grids.
How can I use wandb with multiprocessing, e.g. distributed training?
How can I use wandb with multiprocessing, e.g. distributed training?
wandb.init().Manage multiprocess training using these approaches:- Call
wandb.initin all processes and use the group keyword argument to create a shared group. Each process will have its own wandb run, and the UI will group the training processes together. - Call
wandb.initfrom only one process and pass data to log through multiprocessing queues.
Does W&B use the `multiprocessing` library?
Does W&B use the `multiprocessing` library?
multiprocessing library. An error message like the following indicates a possible issue:if __name__ == "__main__":. This protection is necessary when running W&B directly from the script.Do I need to provide values for all hyperparameters as part of the W&B Sweep. Can I set defaults?
Do I need to provide values for all hyperparameters as part of the W&B Sweep. Can I set defaults?
(run.config()), which acts like a dictionary.For runs outside a sweep, set wandb.Run.config() values by passing a dictionary to the config argument in wandb.init(). In a sweep, any configuration supplied to wandb.init() serves as a default value, which the sweep can override.Use rwandb.Run.config.setdefaults() for explicit behavior. The following code snippets illustrate both methods:- wandb.init()
- config.setdefaults()
Optimizing multiple metrics
Optimizing multiple metrics
How can I organize my logged charts and media in the W&B UI?
How can I organize my logged charts and media in the W&B UI?
/ character separates logged panels in the W&B UI. By default, the segment of the logged item’s name before the / defines a group of panels known as a “Panel Section.”/.How do I fix the 'overflows maximum values of a signed 64 bits integer' error?
How do I fix the 'overflows maximum values of a signed 64 bits integer' error?
?workspace=clear to the end of the URL and press Enter. This action directs you to a cleared version of the project page workspace.What happens if I pass a class attribute into wandb.Run.log()?
What happens if I pass a class attribute into wandb.Run.log()?
wandb.Run.log(). Attributes may change before the network call executes. When storing metrics as class attributes, use a deep copy to ensure the logged metric matches the attribute’s value at the time of the wandb.Run.log() call.Is it possible to plot the max of a metric rather than plot step by step?
Is it possible to plot the max of a metric rather than plot step by step?
How do I plot multiple lines on a plot with a legend?
How do I plot multiple lines on a plot with a legend?
wandb.plot.line_series(). Navigate to the project page to view the line chart. To add a legend, include the keys argument in wandb.plot.line_series(). For example:How do I programmatically access the human-readable run name?
How do I programmatically access the human-readable run name?
.name attribute of a wandb.Run is accessible as follows:How can I change the privacy of my project?
How can I change the privacy of my project?
- In the W&B App, from any page in the project, click Overview in the left navigation.
- At the top right, click Edit.
-
Choose a new value for Project visibility:
- Team (default): Only your team can view and edit the project.
- Restricted: Only invited members can access the project, and public access is turned off.
- Open: Anyone can submit runs or create reports, but only your team can edit it. Appropriate only for classroom settings, public benchmark competitions, or other non-durable contexts.
-
Public: Anyone can view the project, but only your team can edit it.
If your W&B admins have turned off Public visibility, you cannot choose it. Instead, you can share a view-only W&B Report, or contact your W&B organization’s admins for assistance.
- Click Save.
How do I handle the 'Failed to query for notebook' error?
How do I handle the 'Failed to query for notebook' error?
"Failed to query for notebook name, you can set it manually with the WANDB_NOTEBOOK_NAME environment variable," resolve it by setting the environment variable. Multiple methods accomplish this:- Notebook
- Python
How do I get the random run name in my script?
How do I get the random run name in my script?
.save() method to save the current run. Retrieve the name using the run object’s name attribute.Is it possible to recover an artifact after it has been deleted with a run?
Is it possible to recover an artifact after it has been deleted with a run?
How can I recover deleted runs?
How can I recover deleted runs?
- Navigate to the Project Overview page.
- Click the three dots in the top right corner.
- Select Undelete recently deleted runs.
- You can only restore runs deleted within the last 7 days.
- You can manually upload logs using the W&B API if undelete is not an option.
Refreshing data
Refreshing data
How can I regain access to my account if I cannot receive a password reset email?
How can I regain access to my account if I cannot receive a password reset email?
- Check Spam or Junk Folders: Ensure the email is not filtered there.
- Verify Email: Confirm the correct email associated with the account.
- Check for SSO Options: Use services like “Sign in with Google” if available.
- Contact Support: If issues persist, reach out to support ([email protected]) and provide your username and email for assistance.
How can I remove projects from a team space without admin privileges?
How can I remove projects from a team space without admin privileges?
- Request that a current admin remove the projects.
- Ask the admin to grant temporary access for project management.
How do I rename a project?
How do I rename a project?
- Navigate to the Project overview.
- Click on Edit Project.
- If the project name is protected, such as
model-registry, it cannot be renamed. Contact support for assistance with protected names.
How do I renew my expired license?
How do I renew my expired license?
My report looks different after converting from Markdown.
My report looks different after converting from Markdown.
My report is running slowly after the change to WYSIWYG
My report is running slowly after the change to WYSIWYG
Can I use Markdown in my reports?
Can I use Markdown in my reports?
How do I request the complete deletion of my W&B account?
How do I request the complete deletion of my W&B account?
Can I rerun a grid search?
Can I rerun a grid search?
How can I resolve login issues with my account?
How can I resolve login issues with my account?
- Verify access: Confirm you are using the correct email or username and check membership in relevant teams or projects.
- Browser troubleshooting:
- Use an incognito window to avoid cached data interference.
- Clear the browser cache.
- Attempt to log in from a different browser or device.
- SSO and permissions:
- Verify the identity provider (IdP) and Single Sign-On (SSO) settings.
- If using SSO, confirm inclusion in the appropriate SSO group.
- Technical problems:
- Take note of specific error messages for further troubleshooting.
- Contact the support team for additional assistance if issues persist.
How do I resolve permission errors when logging a run?
How do I resolve permission errors when logging a run?
- Verify entity and project names: Ensure correct spelling and case sensitivity of the W&B entity and project names in your code.
- Confirm permissions: Ensure necessary permissions have been granted by the administrator.
- Check log-in credentials: Confirm log-in to the correct W&B account. Test by creating a run with the following code:
- Set API key: Use the
WANDB_API_KEYenvironment variable: - Confirm host information: For custom deployments, set the host URL:
How do I use the resume parameter when resuming a run in W&B?
How do I use the resume parameter when resuming a run in W&B?
resume parameter in W&B , set the resume argument in wandb.init() with entity, project, and id specified. The resume argument accepts values of "must" or "allow".How can I resume a sweep using Python code?
How can I resume a sweep using Python code?
sweep_id to the wandb.agent() function.How do I set a retention or expiration policy on my artifact?
How do I set a retention or expiration policy on my artifact?
How can I rotate or revoke access?
How can I rotate or revoke access?
Do 'Run Finished' alerts work in notebooks?
Do 'Run Finished' alerts work in notebooks?
run.alert() in notebook environments instead.Why is a run marked crashed in W&B when it’s training fine locally?
Why is a run marked crashed in W&B when it’s training fine locally?
How does someone without an account see run results?
How does someone without an account see run results?
anonymous="allow":- Auto-create temporary account: W&B checks for a signed-in account. If none exists, W&B creates a new anonymous account and saves the API key for that session.
- Log results quickly: Users can repeatedly run the script and instantly view results in the W&B dashboard. These unclaimed anonymous runs remain available for 7 days.
- Claim data when it’s useful: Once a user identifies valuable results in W&B, they can click a button in the banner at the top of the page to save their run data to a real account. Without claiming, the run data deletes after 7 days.
How should I run sweeps on SLURM?
How should I run sweeps on SLURM?
wandb agent --count 1 SWEEP_ID in each scheduled job. This command executes a single training job and then exits, facilitating runtime predictions for resource requests while leveraging the parallelism of hyperparameter searches.Can I run wandb offline?
Can I run wandb offline?
- Set the environment variable
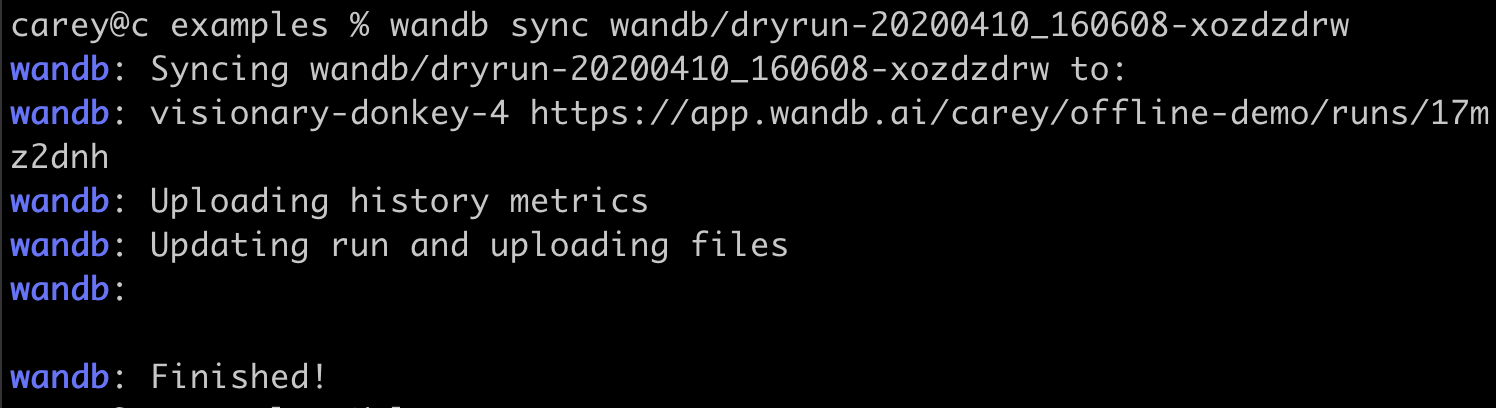
WANDB_MODE=offlineto save metrics locally without an internet connection. - When ready to upload, run
wandb initin your directory to set the project name. - Use
wandb sync YOUR_RUN_DIRECTORYto transfer metrics to the cloud service and access results in the hosted web app.
run.settings._offline or run.settings.mode after executing wandb.init().How many runs can I create per project?
How many runs can I create per project?
My run's state is `crashed` on the UI but is still running on my machine. What do I do to get my data back?
My run's state is `crashed` on the UI but is still running on my machine. What do I do to get my data back?
wandb sync [PATH_TO_RUN]. The path to your run is a folder in your wandb directory that matches the Run ID of the ongoing run.Why is the same metric appearing more than once?
Why is the same metric appearing more than once?
number, string, bool, other (primarily arrays), and any wandb data type such as Histogram or Image. Send only one type per key to prevent this issue.Metric names are case-insensitive. Avoid using names that differ only by case, such as "My-Metric" and "my-metric".How do I save code?
How do I save code?
save_code=True in wandb.init to save the main script or notebook that launches the run. To save all code for a run, version the code with Artifacts. The following example demonstrates this process:How can I save the git commit associated with my run?
How can I save the git commit associated with my run?
wandb.init is invoked, the system automatically collects git information, including the remote repository link and the SHA of the latest commit. This information appears on the run page. Ensure the current working directory when executing the script is within a git-managed folder to view this information.The git commit and the command used to run the experiment remain visible to the user but are hidden from external users. In public projects, these details remain private.Is it possible to save metrics offline and sync them to W&B later?
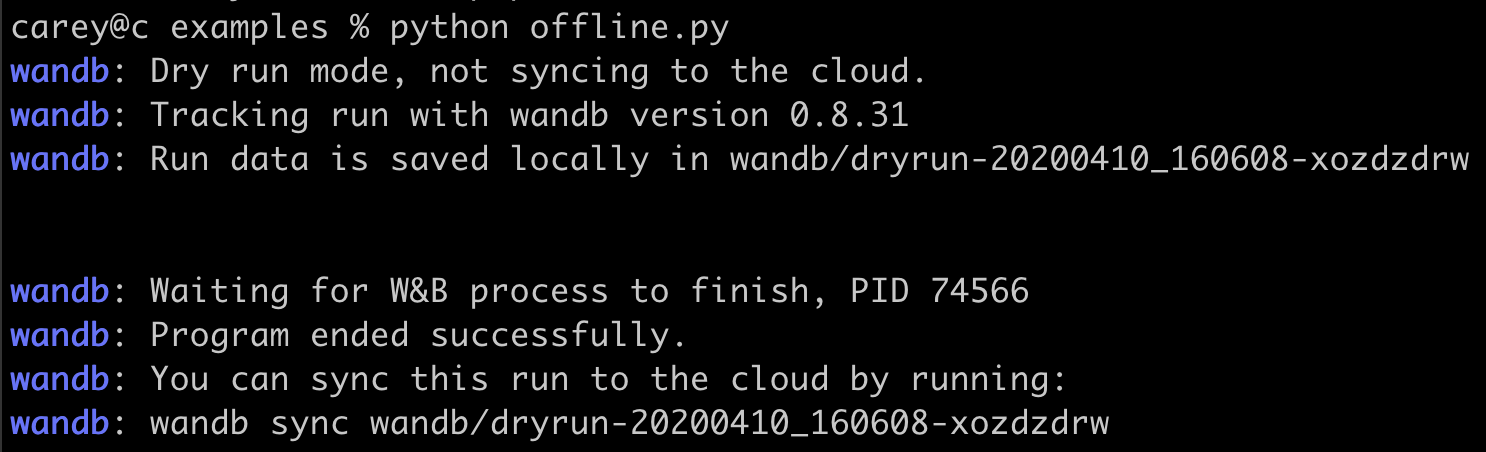
Is it possible to save metrics offline and sync them to W&B later?
wandb.init starts a process that syncs metrics in real time to the cloud. For offline use, set two environment variables to enable offline mode and sync later.Set the following environment variables:WANDB_API_KEY=$KEY, where$KEYis the API Key from your settings page.WANDB_MODE="offline".
How can I see the bytes stored, bytes tracked and tracked hours of my organization?
How can I see the bytes stored, bytes tracked and tracked hours of my organization?
- Navigate to your organization’s settings at
https://wandb.ai/account-settings/<organization-name>/settings. - Select the Billing tab.
- Within the Usage this billing period section, select View usage button.
<> with your organization’s name.Why am I seeing fewer data points than I logged?
Why am I seeing fewer data points than I logged?
Step, expect to see fewer data points. Metrics must log at the same Step to remain synchronized. Only metrics logged at the same Step are sampled while interpolating between samples.GuidelinesBundle metrics into a single log() call. For example, instead of:step value remains the same in both log() calls for the metrics to log under the same step and sample together. The step value must increase monotonically in each call. Otherwise, the step value is ignored.How can I send run alerts to Microsoft Teams?
How can I send run alerts to Microsoft Teams?
- Set up an email address for your Teams channel. Create an email address for the Teams channel where you want to receive alerts.
- Forward W&B alert emails to the Teams channel’s email address. Configure W&B to send alerts via email, then forward these emails to your Teams channel’s email.
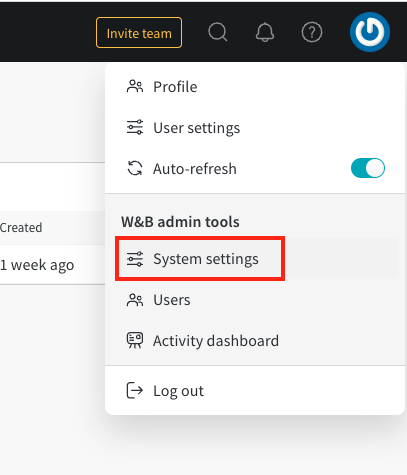
What is a service account, and why is it useful?
What is a service account, and why is it useful?
- No license consumption: Service accounts do not consume user seats or licenses
- Dedicated API keys: Secure credentials for automated workflows
- User attribution: Optionally attribute automated runs to human users
- Enterprise-ready: Built for production automation at scale
- Delegated operations: Service accounts operate on behalf of the user or organization that creates them
WANDB_USERNAME or WANDB_USER_EMAIL.For comprehensive information about service accounts, including best practices and detailed setup instructions, refer to Use service accounts to automate workflows. For information about how service accounts behave in team contexts, refer to Team Service Account Behavior.You can get the API key for a service account in your team at <WANDB_HOST_URL>/<your-team-name>/service-accounts. Alternatively you can go to the Team settings for your team and then refer to the Service Accounts tab.To create a new service account for your team:- Press the + New service account button in the Service Accounts tab of your team
- Provide a name in the Name field
- Select Generate API key (Built-in) as the authentication method
- Press the Create button
- Click the Copy API key button for the newly created service account and store it in a secret manager or another safe but accessible location
How do you show a 'step slider' in a custom chart?
How do you show a 'step slider' in a custom chart?
historyTable instead of a summaryTable provides the option to “Show step selector” in the custom chart editor. This feature includes a slider for selecting the step.How do I silence W&B info messages?
How do I silence W&B info messages?
logging.ERROR to only show errors, suppressing output of info-level log output.WANDB_QUIET environment variable to True. To turn off log output completely, set the WANDB_SILENT environment variable to True. In a notebook, set WANDB_QUIET or WANDB_SILENT before running wandb.login:- Notebook
- Python
Will wandb slow down my training?
Will wandb slow down my training?
Does W&B support SSO for Multi-tenant?
Does W&B support SSO for Multi-tenant?
- Create a Single Page Application (SPA) on the identity provider.
- Set the
grant_typetoimplicitflow. - Set the callback URI to
https://wandb.auth0.com/login/callback.
Client ID and Issuer URL for the application. W&B will establish an Auth0 connection using these details and enable SSO.How do I stop wandb from writing to my terminal or my Jupyter notebook output?
How do I stop wandb from writing to my terminal or my Jupyter notebook output?
WANDB_SILENT to true.- Python
- Notebook
- Command-Line
Why does the storage meter not update after deleting runs?
Why does the storage meter not update after deleting runs?
- The storage meter does not update immediately after deleting runs due to processing delays.
- The backend system requires time to synchronize and reflect changes in usage accurately.
- If the storage meter has not updated, wait for the changes to process.
How does wandb stream logs and writes to disk?
How does wandb stream logs and writes to disk?
WANDB_MODE=offline configuration, allowing synchronization after logging.In the terminal, observe the path to the local run directory. This directory includes a .wandb file, which serves as the datastore. For image logging, W&B stores images in the media/images subdirectory before uploading them to cloud storage.Can you use W&B Sweeps with cloud infrastructures such as AWS Batch, ECS, etc.?
Can you use W&B Sweeps with cloud infrastructures such as AWS Batch, ECS, etc.?
sweep_id so that any W&B Sweep agent can access it, implement a method for these agents to read and execute the sweep_id.For example, launch an Amazon EC2 instance and execute wandb agent on it. Use an SQS queue to broadcast the sweep_id to multiple EC2 instances. Each instance can then retrieve the sweep_id from the queue and initiate the process.Can I use Sweeps and SageMaker?
Can I use Sweeps and SageMaker?
requirements.txt file if using a built-in Amazon SageMaker estimator. For details on authentication and setting up the requirements.txt file, refer to the SageMaker integration guide.Access the Deploy Sentiment Analyzer Using SageMaker and W&B tutorial for deploying a sentiment analyzer using SageMaker and W&B.
How do I switch between accounts on the same machine?
How do I switch between accounts on the same machine?
How often are system metrics collected?
How often are system metrics collected?
What is a team and where can I find more information about it?
What is a team and where can I find more information about it?
Can I turn off wandb when testing my code?
Can I turn off wandb when testing my code?
wandb.init(mode="disabled") or set WANDB_MODE=disabled to configure W&B as a no-operation (NOOP) for testing purposes.wandb.init(mode="disabled") does not prevent W&B from saving artifacts to WANDB_CACHE_DIR.Does your tool track or store training data?
Does your tool track or store training data?
wandb.Run.config.update(...) to associate a dataset with a training run. W&B stores no data unless wandb.Run.save() is called with the local file name.What type of roles are available and what are the differences between them?
What type of roles are available and what are the differences between them?
How do we update our payment method?
How do we update our payment method?
- Go to your profile page: First, navigate to your user profile page.
- Select your Organization: Choose the relevant organization from the Account selector.
- Access Billing settings: Under Account, select Billing.
- Add a new payment method:
- Click Add payment method.
- Enter your new card details and select the option to make it your primary payment method.
Note: To manage billing, you must be assigned as the billing admin for your organization.
Upload a CSV to a report
Upload a CSV to a report
wandb.Table format. Load the CSV in your Python script and log it as a wandb.Table object. This action renders the data as a table in the report.Upload an image to a report
Upload an image to a report
/ on a new line, scroll to the Image option, and drag and drop an image into the report.
Can W&B team members see my data?
Can W&B team members see my data?
Is there a W&B outage?
Is there a W&B outage?
What does wandb.init do to my training process?
What does wandb.init do to my training process?
wandb.init() runs in a training script, an API call creates a run object on the servers. A new process starts to stream and collect metrics, allowing the primary process to function normally. The script writes to local files while the separate process streams data to the servers, including system metrics. To turn off streaming, run wandb off from the training directory or set the WANDB_MODE environment variable to offline.What happens if I edit my Python files while a sweep is running?
What happens if I edit my Python files while a sweep is running?
- If the
train.pyscript which the sweep uses changes, the sweep continues to use the originaltrain.py - If files that the
train.pyscript references change, such as helper functions in thehelper.pyscript, the sweep begins to use the updatedhelper.py.
Where are artifacts downloaded, and how can I control that?
Where are artifacts downloaded, and how can I control that?
artifacts/ folder. To change the location:-
Pass it to
wandb.Artifact().download: -
Set the
WANDB_ARTIFACT_DIRenvironment variable:
Why are steps missing from a CSV metric export?
Why are steps missing from a CSV metric export?
run.history API. To access the complete run history, download the run history artifact using Parquet format:Does this only work for Python?
Does this only work for Python?