3D 脳腫瘍セグメンテーション with MONAI

このチュートリアルでは、MONAIを使用して、マルチラベルの3D脳腫瘍セグメンテーションタスクのトレーニングワークフローを構築し、Weights & Biasesの実験管理とデータ可視化機能を使用する方法をデモンストレーションします。チュートリアルには以下の機能が含まれています。

  1. Weights & Biasesのrunを初期化し、再現性を確保するためにrunに関連するすべての設定を同期。
  2. MONAIトランスフォームAPI:
    1. 辞書形式のデータ用のMONAIトランスフォーム。
    2. MONAIのtransforms APIに従った新しいトランスフォームの定義方法。
    3. データ拡張のための強度をランダムに調整する方法。
  3. データのロードと可視化:
    1. メタデータでNifti画像をロードし、画像のリストをロードしてスタック。
    2. IOとトランスフォームをキャッシュしてトレーニングと検証を加速。
    3. wandb.TableとWeights & Biasesでインタラクティブなセグメンテーションオーバーレイを用いてデータを可視化。
  4. 3D SegResNetモデルのトレーニング
    1. MONAIのnetworks, losses, metrics APIsを使用。
    2. PyTorchトレーニングループを使用して3D SegResNetモデルをトレーニング。
    3. Weights & Biasesを使用してトレーニングの実験管理を追跡。
    4. Weights & Biases上でモデルのチェックポイントをモデルアーティファクトとしてログとバージョン管理。
  5. wandb.TableとWeights & Biasesでインタラクティブなセグメンテーションオーバーレイを使用して、検証データセット上の予測を可視化して比較。

セットアップとインストール

まず、MONAIとWeights & Biasesの最新バージョンをインストールします。

!python -c "import monai" || pip install -q -U "monai[nibabel, tqdm]"
!python -c "import wandb" || pip install -q -U wandb
import os

import numpy as np
from tqdm.auto import tqdm
import wandb

from monai.apps import DecathlonDataset
from monai.data import DataLoader, decollate_batch
from monai.losses import DiceLoss
from monai.inferers import sliding_window_inference
from monai.metrics import DiceMetric
from monai.networks.nets import SegResNet
from monai.transforms import (
    Activations,
    AsDiscrete,
    Compose,
    LoadImaged,
    MapTransform,
    NormalizeIntensityd,
    Orientationd,
    RandFlipd,
    RandScaleIntensityd,
    RandShiftIntensityd,
    RandSpatialCropd,
    Spacingd,
    EnsureTyped,
    EnsureChannelFirstd,
)
from monai.utils import set_determinism

import torch

次に、ColabインスタンスをW&Bで認証します。

wandb.login()

W&B Runの初期化

新しいW&B runを開始して実験を追跡します。

wandb.init(project="monai-brain-tumor-segmentation")

適切な設定システムの使用は、再現性のある機械学習のための推奨されるベストプラクティスです。W&Bを使用して、各実験のハイパーパラメーターを追跡できます。

config = wandb.config
config.seed = 0
config.roi_size = [224, 224, 144]
config.batch_size = 1
config.num_workers = 4
config.max_train_images_visualized = 20
config.max_val_images_visualized = 20
config.dice_loss_smoothen_numerator = 0
config.dice_loss_smoothen_denominator = 1e-5
config.dice_loss_squared_prediction = True
config.dice_loss_target_onehot = False
config.dice_loss_apply_sigmoid = True
config.initial_learning_rate = 1e-4
config.weight_decay = 1e-5
config.max_train_epochs = 50
config.validation_intervals = 1
config.dataset_dir = "./dataset/"
config.checkpoint_dir = "./checkpoints"
config.inference_roi_size = (128, 128, 64)
config.max_prediction_images_visualized = 20

また、ランダムシードを設定して、モジュールの決定的なトレーニングを有効または無効にする必要があります。

set_determinism(seed=config.seed)

# ディレクトリを作成
os.makedirs(config.dataset_dir, exist_ok=True)
os.makedirs(config.checkpoint_dir, exist_ok=True)

データのロードと変換

ここでは、monai.transforms APIを使用して、マルチクラスラベルをワンホット形式でのマルチラベルセグメンテーションタスクに変換するカスタムトランスフォームを作成します。

class ConvertToMultiChannelBasedOnBratsClassesd(MapTransform):
    """
    脳腫瘍クラスに基づいてラベルをマルチチャネルに変換します:
    ラベル 1 は腫瘍周辺の浮腫
    ラベル 2 はGD 増強腫瘍
    ラベル 3 は壊死および非増強腫瘍コア
    考えられるクラスはTC (腫瘍コア)、WT (全腫瘍)
    ET (増強腫瘍)です。

    参考:https://github.com/Project-MONAI/tutorials/blob/main/3d_segmentation/brats_segmentation_3d.ipynb

    """

    def __call__(self, data):
        d = dict(data)
        for key in self.keys:
            result = []
            # label 2 と label 3 を組み合わせて TC を構築
            result.append(torch.logical_or(d[key] == 2, d[key] == 3))
            # label 1, 2 と 3 を組み合わせて WT を構築
            result.append(
                torch.logical_or(
                    torch.logical_or(d[key] == 2, d[key] == 3), d[key] == 1
                )
            )
            # label 2 は ET
            result.append(d[key] == 2)
            d[key] = torch.stack(result, axis=0).float()
        return d

次に、トレーニングデータセットと検証データセット用にそれぞれトランスフォームを設定します。

train_transform = Compose(
    [
        # 4つの Nifti 画像を読み込み、それらをスタック
        LoadImaged(keys=["image", "label"]),
        EnsureChannelFirstd(keys="image"),
        EnsureTyped(keys=["image", "label"]),
        ConvertToMultiChannelBasedOnBratsClassesd(keys="label"),
        Orientationd(keys=["image", "label"], axcodes="RAS"),
        Spacingd(
            keys=["image", "label"],
            pixdim=(1.0, 1.0, 1.0),
            mode=("bilinear", "nearest"),
        ),
        RandSpatialCropd(
            keys=["image", "label"], roi_size=config.roi_size, random_size=False
        ),
        RandFlipd(keys=["image", "label"], prob=0.5, spatial_axis=0),
        RandFlipd(keys=["image", "label"], prob=0.5, spatial_axis=1),
        RandFlipd(keys=["image", "label"], prob=0.5, spatial_axis=2),
        NormalizeIntensityd(keys="image", nonzero=True, channel_wise=True),
        RandScaleIntensityd(keys="image", factors=0.1, prob=1.0),
        RandShiftIntensityd(keys="image", offsets=0.1, prob=1.0),
    ]
)
val_transform = Compose(
    [
        LoadImaged(keys=["image", "label"]),
        EnsureChannelFirstd(keys="image"),
        EnsureTyped(keys=["image", "label"]),
        ConvertToMultiChannelBasedOnBratsClassesd(keys="label"),
        Orientationd(keys=["image", "label"], axcodes="RAS"),
        Spacingd(
            keys=["image", "label"],
            pixdim=(1.0, 1.0, 1.0),
            mode=("bilinear", "nearest"),
        ),
        NormalizeIntensityd(keys="image", nonzero=True, channel_wise=True),
    ]
)

データセット

この実験で使用されるデータセットは、http://medicaldecathlon.com/ から入手可能です。マルチモーダルおよびマルチサイトMRIデータ(FLAIR, T1w, T1gd, T2w)を使用して、膠芽腫、壊死/活動中の腫瘍、および浮腫をセグメント化します。データセットは750個の4Dボリューム(484 トレーニング + 266 テスト)で構成されています。

DecathlonDataset を使用してデータセットを自動的にダウンロードし、抽出します。MONAI CacheDataset を継承し、cache_num=N を設定してトレーニングのために N アイテムをキャッシュし、メモリサイズに応じてデフォルト引数を使用して検証のためにすべてのアイテムをキャッシュできます。

train_dataset = DecathlonDataset(
    root_dir=config.dataset_dir,
    task="Task01_BrainTumour",
    transform=val_transform,
    section="training",
    download=True,
    cache_rate=0.0,
    num_workers=4,
)
val_dataset = DecathlonDataset(
    root_dir=config.dataset_dir,
    task="Task01_BrainTumour",
    transform=val_transform,
    section="validation",
    download=False,
    cache_rate=0.0,
    num_workers=4,
)

データセットの可視化

Weights & Biasesは画像、ビデオ、オーディオなどをサポートしています。リッチメディアをログに取り込み、結果を探索し、run、モデル、データセットを視覚的に比較できます。セグメンテーションマスクオーバーレイシステムを使用してデータボリュームを可視化します。 テーブルにセグメンテーションマスクをログに追加するには、テーブル内の各行にwandb.Image オブジェクトを提供する必要があります。

次の擬似コードは、その例です。

table = wandb.Table(columns=["ID", "Image"])

for id, img, label in zip(ids, images, labels):
    mask_img = wandb.Image(
        img,
        masks={
            "prediction": {"mask_data": label, "class_labels": class_labels}
            # ...
        },
    )

    table.add_data(id, img)

wandb.log({"Table": table})

次に、サンプル画像、ラベル、wandb.Table オブジェクトと関連するメタデータを受け取り、Weights & Biases ダッシュボードにログされるテーブルの行を埋めるユーティリティ関数を作成します。

def log_data_samples_into_tables(
    sample_image: np.array,
    sample_label: np.array,
    split: str = None,
    data_idx: int = None,
    table: wandb.Table = None,
):
    num_channels, _, _, num_slices = sample_image.shape
    with tqdm(total=num_slices, leave=False) as progress_bar:
        for slice_idx in range(num_slices):
            ground_truth_wandb_images = []
            for channel_idx in range(num_channels):
                ground_truth_wandb_images.append(
                    masks = {
                        "ground-truth/Tumor-Core": {
                            "mask_data": sample_label[0, :, :, slice_idx],
                            "class_labels": {0: "background", 1: "Tumor Core"},
                        },
                        "ground-truth/Whole-Tumor": {
                            "mask_data": sample_label[1, :, :, slice_idx] * 2,
                            "class_labels": {0: "background", 2: "Whole Tumor"},
                        },
                        "ground-truth/Enhancing-Tumor": {
                            "mask_data": sample_label[2, :, :, slice_idx] * 3,
                            "class_labels": {0: "background", 3: "Enhancing Tumor"},
                        },
                    }
                    wandb.Image(
                        sample_image[channel_idx, :, :, slice_idx],
                        masks=masks,
                    )
                )
            table.add_data(split, data_idx, slice_idx, *ground_truth_wandb_images)
            progress_bar.update(1)
    return table

次に、wandb.Table オブジェクトと、それが含む列を定義し、データ可視化を使用してそれを埋めます。

table = wandb.Table(
    columns=[
        "Split",
        "Data Index",
        "Slice Index",
        "Image-Channel-0",
        "Image-Channel-1",
        "Image-Channel-2",
        "Image-Channel-3",
    ]
)

次に、それぞれtrain_datasetval_dataset をループして、データサンプルの可視化を生成し、ダッシュボードにログを取るためのテーブルの行を埋めます。
# train_dataset の可視化を生成
max_samples = (
    min(config.max_train_images_visualized, len(train_dataset))
    if config.max_train_images_visualized > 0
    else len(train_dataset)
)
progress_bar = tqdm(
    enumerate(train_dataset[:max_samples]),
    total=max_samples,
    desc="Generating Train Dataset Visualizations:",
)
for data_idx, sample in progress_bar:
    sample_image = sample["image"].detach().cpu().numpy()
    sample_label = sample["label"].detach().cpu().numpy()
    table = log_data_samples_into_tables(
        sample_image,
        sample_label,
        split="train",
        data_idx=data_idx,
        table=table,
    )

# val_dataset の可視化を生成
max_samples = (
    min(config.max_val_images_visualized, len(val_dataset))
    if config.max_val_images_visualized > 0
    else len(val_dataset)
)
progress_bar = tqdm(
    enumerate(val_dataset[:max_samples]),
    total=max_samples,
    desc="Generating Validation Dataset Visualizations:",
)
for data_idx, sample in progress_bar:
    sample_image = sample["image"].detach().cpu().numpy()
    sample_label = sample["label"].detach().cpu().numpy()
    table = log_data_samples_into_tables(
        sample_image,
        sample_label,
        split="val",
        data_idx=data_idx,
        table=table,
    )

# ダッシュボードにテーブルをログ
wandb.log({"Tumor-Segmentation-Data": table})

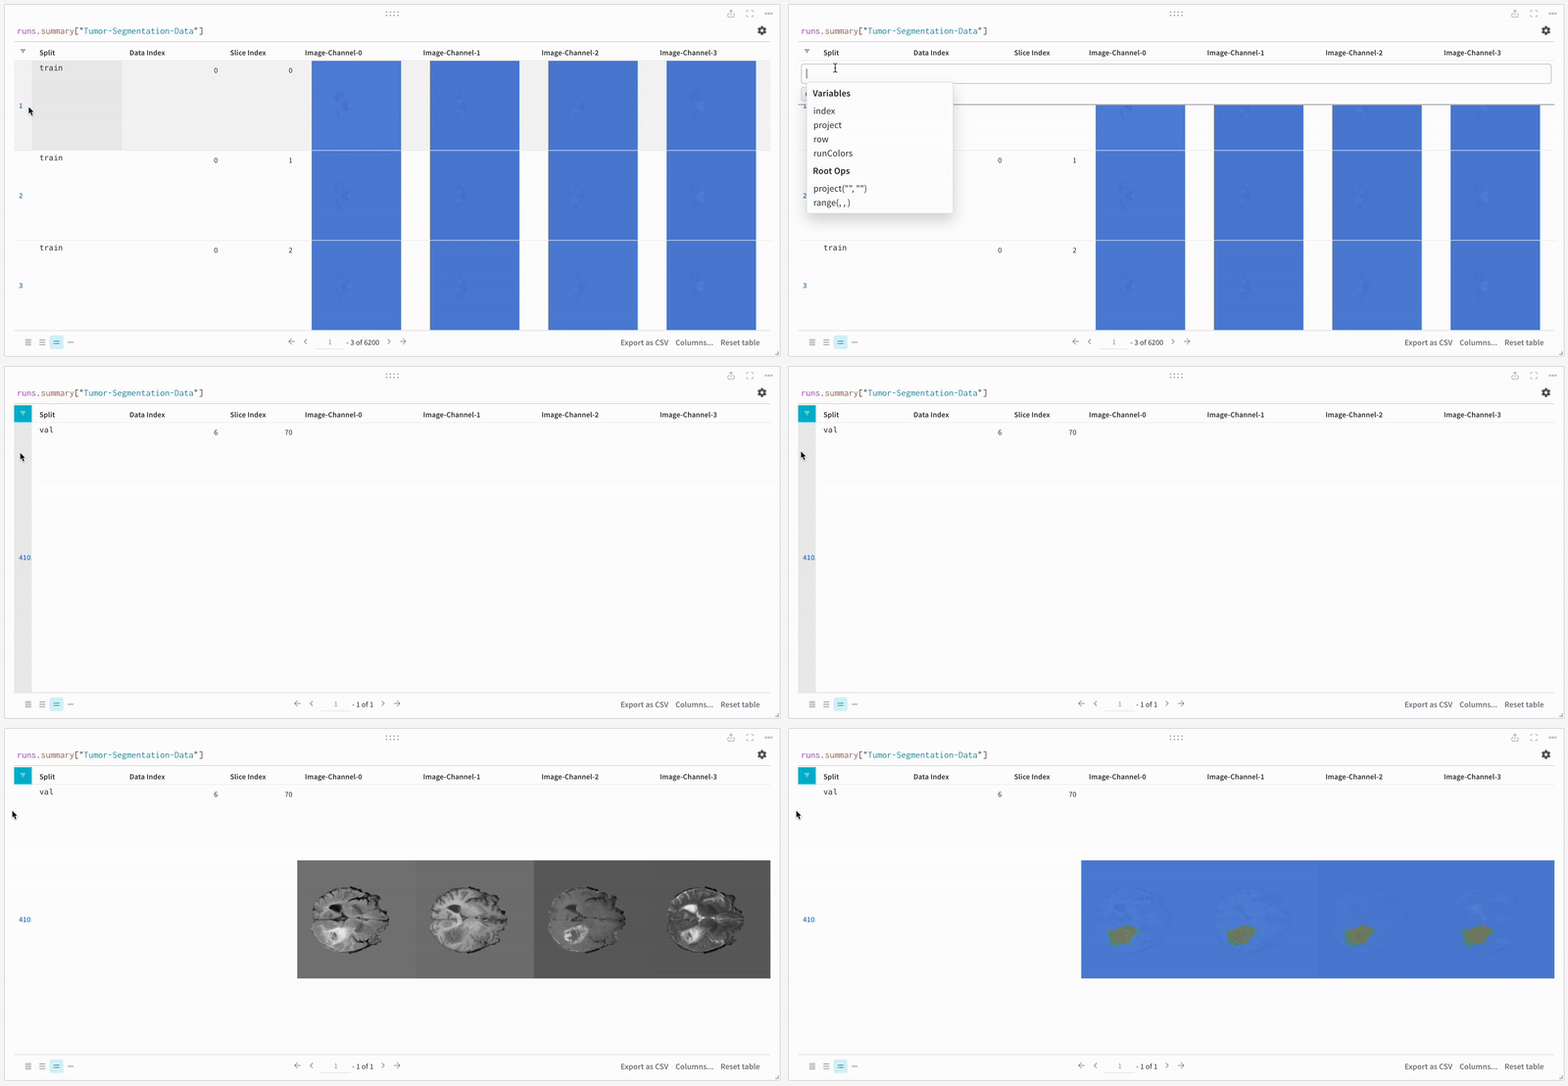
データはW&Bダッシュボード上でインタラクティブな表形式で表示されます。我々はデータボリュームの特定のスライスの各チャンネルを、各行の対応するセグメンテーションマスクと重ね合わせて見ることができます。テーブルのデータを論理的にフィルタリングして、特定の行に集中するために Weave クエリ を書くことができます。

An example of logged table data.
ログされたテーブルデータの例。

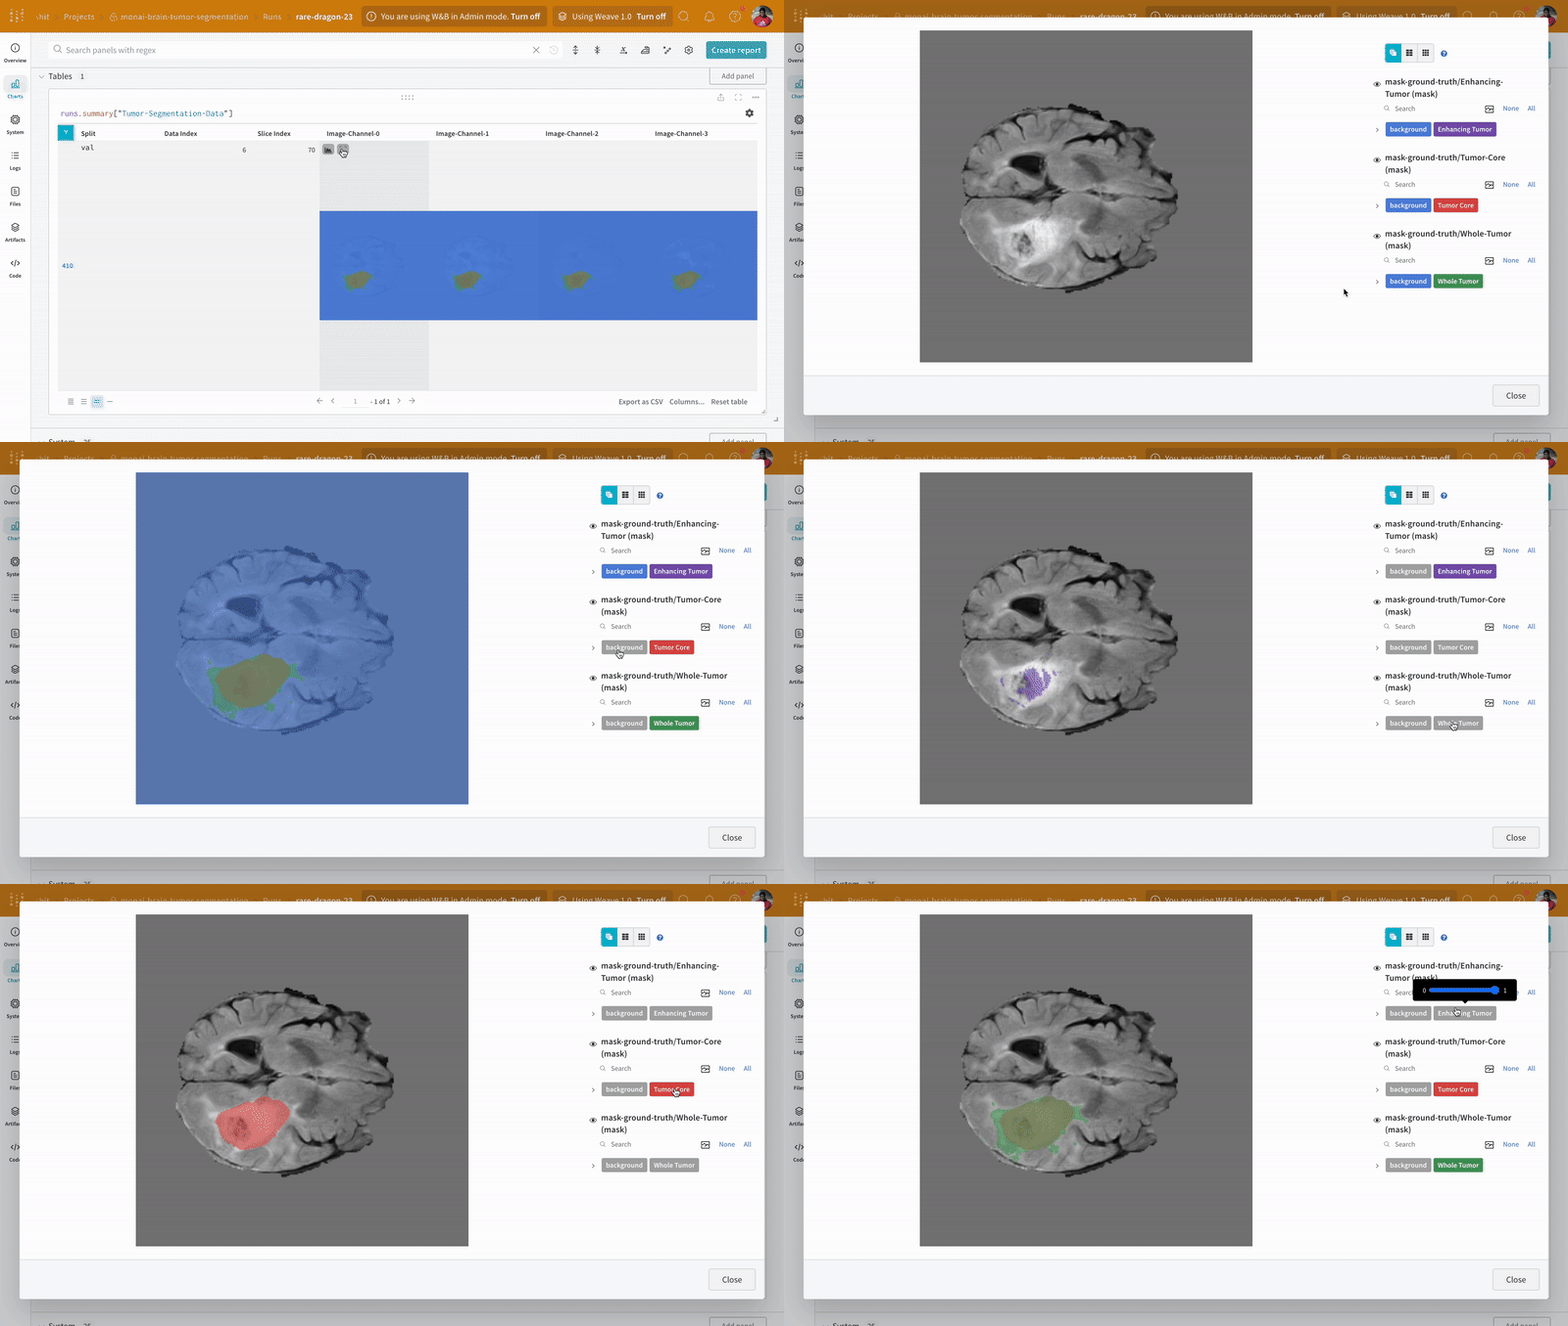
画像を開き、インタラクティブなオーバーレイを使用して、各セグメンテーションマスクをどのように操作できるかを見てみてください。

An example of visualized segmentation maps.
セグメンテーションマップの可視化例。

データのロード

データセットからデータをロードするための PyTorch DataLoaders を作成します。 DataLoaders を作成する前に、train_datasettransformtrain_transform に設定して、トレーニング用のデータを前処理および変換します。

# トレーニングデータセットにtrain_transformsを適用
train_dataset.transform = train_transform

# train_loaderを作成
train_loader = DataLoader(
    train_dataset,
    batch_size=config.batch_size,
    shuffle=True,
    num_workers=config.num_workers,
)

# val_loaderを作成
val_loader = DataLoader(
    val_dataset,
    batch_size=config.batch_size,
    shuffle=False,
    num_workers=config.num_workers,
)

モデル、損失、およびオプティマイザーの作成

このチュートリアルでは、 3D MRI brain tumor segmentation using auto-encoder regularization に基づいた SegResNet モデルを作成します。SegResNet モデルは、 monai.networks API の一部として PyTorch モジュールとして実装されています。これはオプティマイザーと学習率スケジューラともに利用可能です。

device = torch.device("cuda:0")

# モデルの作成
model = SegResNet(
    blocks_down=[1, 2, 2, 4],
    blocks_up=[1, 1, 1],
    init_filters=16,
    in_channels=4,
    out_channels=3,
    dropout_prob=0.2,
).to(device)

# オプティマイザーの作成
optimizer = torch.optim.Adam(
    model.parameters(),
    config.initial_learning_rate,
    weight_decay=config.weight_decay,
)

# 学習率スケジューラの作成
lr_scheduler = torch.optim.lr_scheduler.CosineAnnealingLR(
    optimizer, T_max=config.max_train_epochs
)

損失を monai.losses API を使用してマルチラベル DiceLoss として定義し、それに対応するダイスメトリクスを monai.metrics API を使用して定義します。

loss_function = DiceLoss(
    smooth_nr=config.dice_loss_smoothen_numerator,
    smooth_dr=config.dice_loss_smoothen_denominator,
    squared_pred=config.dice_loss_squared_prediction,
    to_onehot_y=config.dice_loss_target_onehot,
    sigmoid=config.dice_loss_apply_sigmoid,
)

dice_metric = DiceMetric(include_background=True, reduction="mean")
dice_metric_batch = DiceMetric(include_background=True, reduction="mean_batch")
post_trans = Compose([Activations(sigmoid=True), AsDiscrete(threshold=0.5)])

# 自動混合精度を使用してトレーニングを加速
scaler = torch.cuda.amp.GradScaler()
torch.backends.cudnn.benchmark = True

混合精度推論のための小さなユーティリティを定義します。これはトレーニングプロセスの検証ステップおよびトレーニング後にモデルを実行したいときに役立ちます。

def inference(model, input):
    def _compute(input):
        return sliding_window_inference(
            inputs=input,
            roi_size=(240, 240, 160),
            sw_batch_size=1,
            predictor=model,
            overlap=0.5,
        )

    with torch.cuda.amp.autocast():
        return _compute(input)

トレーニングと検証

トレーニングの前に、トレーニングと検証の実験管理を追跡するために wandb.log() でログを取るメトリクスプロパティを定義します。

wandb.define_metric("epoch/epoch_step")
wandb.define_metric("epoch/*", step_metric="epoch/epoch_step")
wandb.define_metric("batch/batch_step")
wandb.define_metric("batch/*", step_metric="batch/batch_step")
wandb.define_metric("validation/validation_step")
wandb.define_metric("validation/*", step_metric="validation/validation_step")

batch_step = 0
validation_step = 0
metric_values = []
metric_values_tumor_core = []
metric_values_whole_tumor = []
metric_values_enhanced_tumor = []

標準的な PyTorch トレーニングループの実行

# W&B アーティファクトオブジェクトを定義
artifact = wandb.Artifact(
    name=f"{wandb.run.id}-checkpoint", type="model"
)

epoch_progress_bar = tqdm(range(config.max_train_epochs), desc="Training:")

for epoch in epoch_progress_bar:
    model.train()
    epoch_loss = 0

    total_batch_steps = len(train_dataset) // train_loader.batch_size
    batch_progress_bar = tqdm(train_loader, total=total_batch_steps, leave=False)
    
    # トレーニングステップ
    for batch_data in batch_progress_bar:
        inputs, labels = (
            batch_data["image"].to(device),
            batch_data["label"].to(device),
        )
        optimizer.zero_grad()
        with torch.cuda.amp.autocast():
            outputs = model(inputs)
            loss = loss_function(outputs, labels)
        scaler.scale(loss).backward()
        scaler.step(optimizer)
        scaler.update()
        epoch_loss += loss.item()
        batch_progress_bar.set_description(f"train_loss: {loss.item():.4f}:")
        ## バッチ単位のトレーニング損失を W&B にログ
        wandb.log({"batch/batch_step": batch_step, "batch/train_loss": loss.item()})
        batch_step += 1

    lr_scheduler.step()
    epoch_loss /= total_batch_steps
    ## エポック単位のトレーニング損失と学習率を W&B にログ
    wandb.log(
        {
            "epoch/epoch_step": epoch,
            "epoch/mean_train_loss": epoch_loss,
            "epoch/learning_rate": lr_scheduler.get_last_lr()[0],
        }
    )
    epoch_progress_bar.set_description(f"Training: train_loss: {epoch_loss:.4f}:")

    # 検証とモデルのチェックポイントステップ
    if (epoch + 1) % config.validation_intervals == 0:
        model.eval()
        with torch.no_grad():
            for val_data in val_loader:
                val_inputs, val_labels = (
                    val_data["image"].to(device),
                    val_data["label"].to(device),
                )
                val_outputs = inference(model, val_inputs)
                val_outputs = [post_trans(i) for i in decollate_batch(val_outputs)]
                dice_metric(y_pred=val_outputs, y=val_labels)
                dice_metric_batch(y_pred=val_outputs, y=val_labels)

            metric_values.append(dice_metric.aggregate().item())
            metric_batch = dice_metric_batch.aggregate()
            metric_values_tumor_core.append(metric_batch[0].item())
            metric_values_whole_tumor.append(metric_batch[1].item())
            metric_values_enhanced_tumor.append(metric_batch[2].item())
            dice_metric.reset()
            dice_metric_batch.reset()

            checkpoint_path = os.path.join(config.checkpoint_dir, "model.pth")
            torch.save(model.state_dict(), checkpoint_path)
            
            # W&Bアーティファクトを使用してモデルのチェックポイントをログとバージョン管理。
            artifact.add_file(local_path=checkpoint_path)
            wandb.log_artifact(artifact, aliases=[f"epoch_{epoch}"])

            # W&Bダッシュボードに検証メトリクスをログ。
            wandb.log(
                {
                    "validation/validation_step": validation_step,
                    "validation/mean_dice": metric_values[-1],
                    "validation/mean_dice_tumor_core": metric_values_tumor_core[-1],
                    "validation/mean_dice_whole_tumor": metric_values_whole_tumor[-1],
                    "validation/mean_dice_enhanced_tumor": metric_values_enhanced_tumor[-1],
                }
            )
            validation_step += 1


# このアーティファクトがログを終了するのを待ちます。
artifact.wait()

コードを wandb.log で計装することで、トレーニングと検証プロセスに関連するメトリクスすべてを追跡するだけでなく、W&Bダッシュボード上のすべてのシステムメトリクス(この場合はCPUとGPU)も追跡できます。
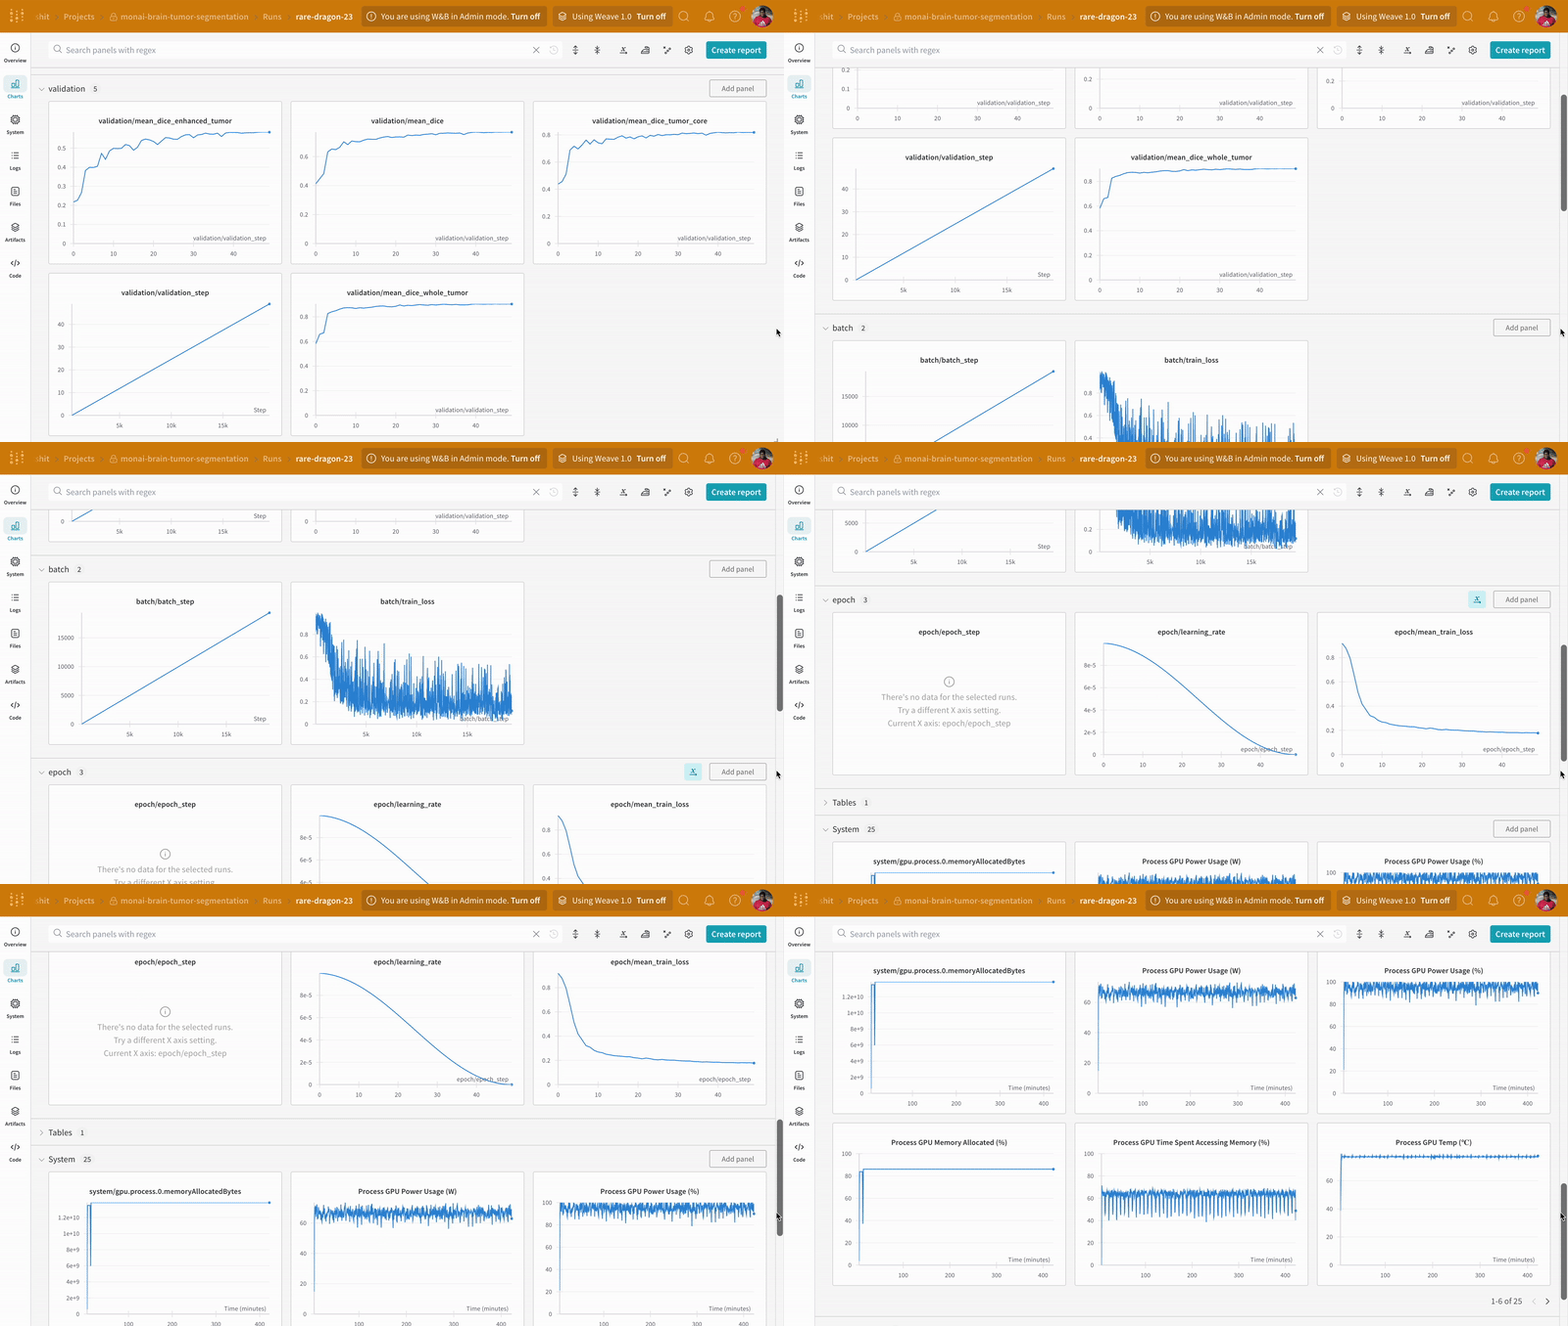
An example of training and validation process tracking on W&B.
W&Bでのトレーニングと検証プロセス追跡の例。

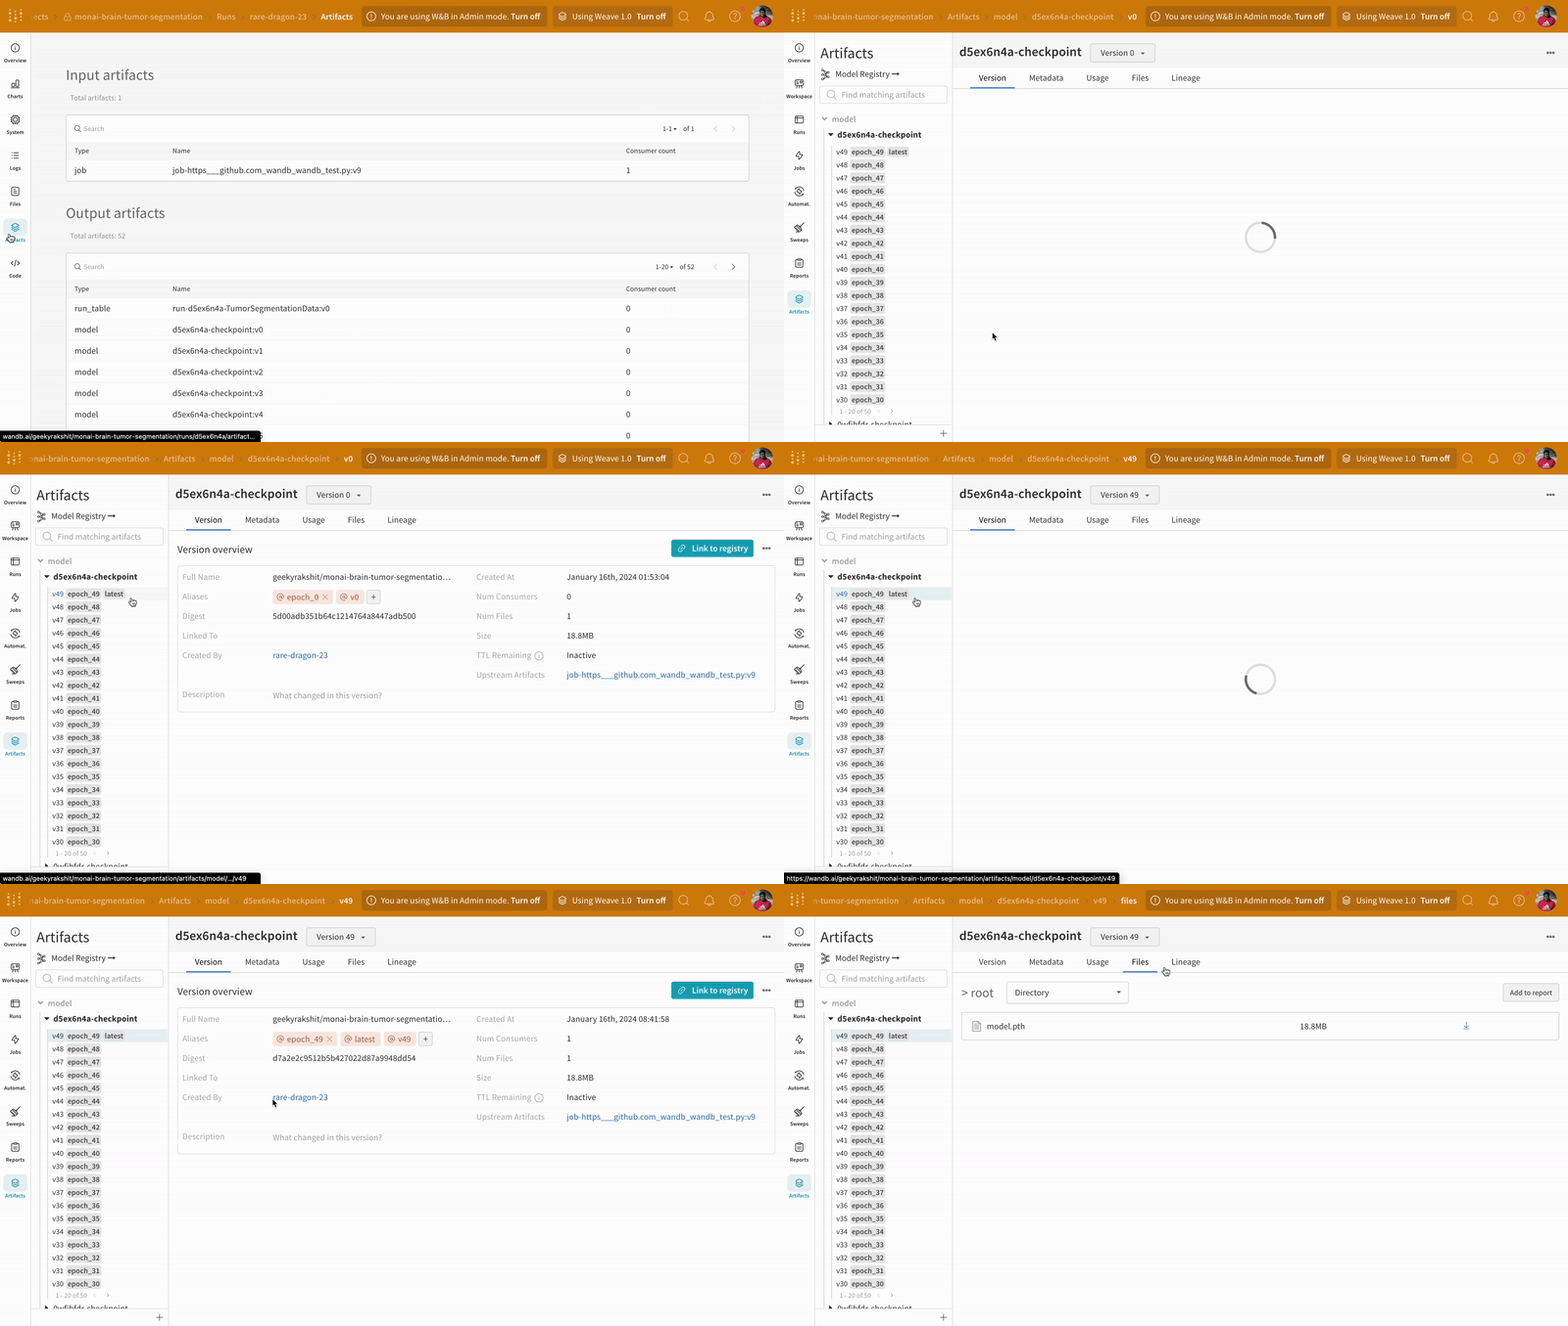
W&Bの run ダッシュボードのアーティファクトタブに移動して、トレーニング中にログされたモデルチェックポイントアーティファクトの異なるバージョンにアクセスします。

An example of model checkpoints logging and versioning on W&B.
W&Bでのモデルチェックポイントのログとバージョン管理の例。

推論

アーティファクトインターフェースを使用して、このケースでは平均エポック単位のトレーニング損失が最良のモデルチェックポイントであるアーティファクトのバージョンを選択できます。アーティファクト全体のリネージを探索し、必要なバージョンを使用することもできます。
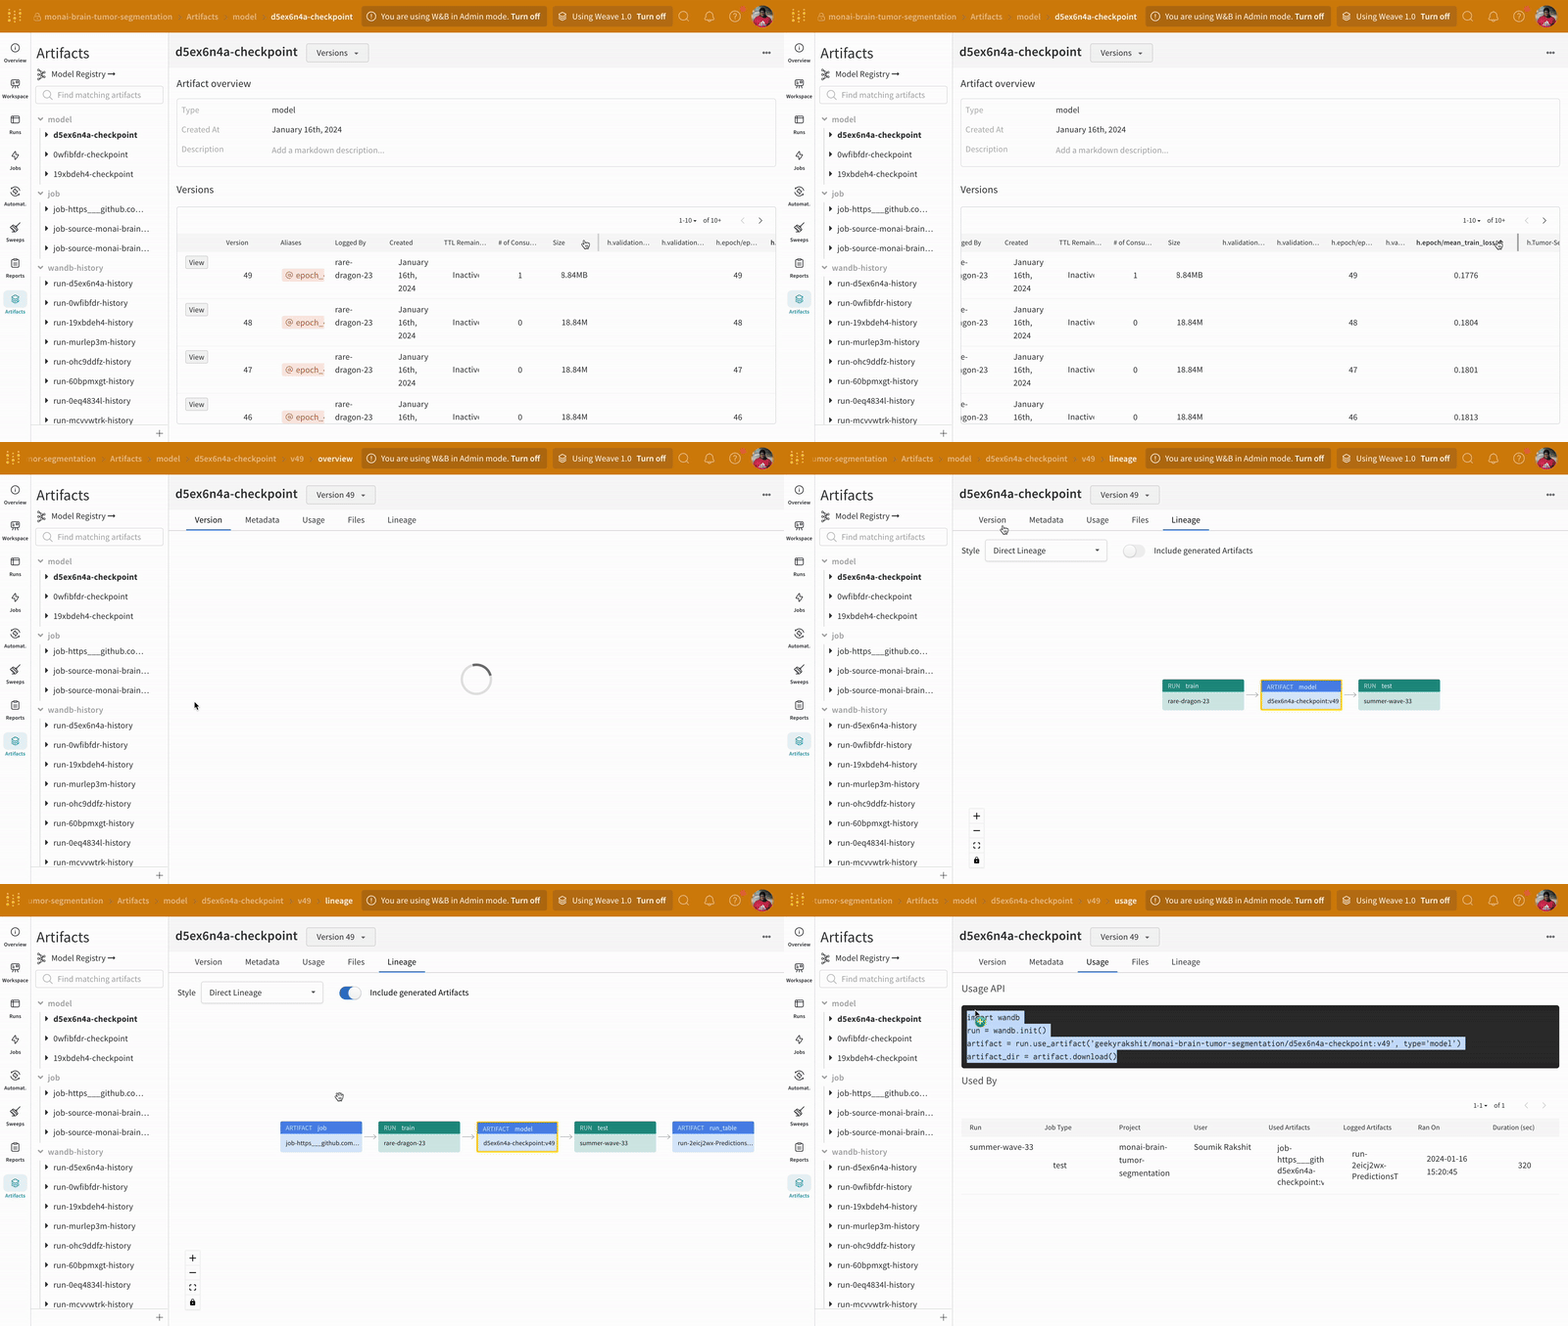
An example of model artifact tracking on W&B.
W&Bでのモデルアーティファクト追跡の例。

最良のエポック単位の平均トレーニング損失を持つモデルアーティファクトのバージョンをフェッチし、チェックポイントステート辞書をモデルにロードします。

model_artifact = wandb.use_artifact(
    "geekyrakshit/monai-brain-tumor-segmentation/d5ex6n4a-checkpoint:v49",
    type="model",
)
model_artifact_dir = model_artifact.download()
model.load_state_dict(torch.load(os.path.join(model_artifact_dir, "model.pth")))
model.eval()

予測の可視化と正解ラベルとの比較

予測されたセグメンテーションマスクと対応する正解のセグメンテーションマスクをインタラクティブなセグメンテーションマスクオーバーレイを使用して視覚化するためのユーティリティ関数を作成します。
def log_predictions_into_tables(
    sample_image: np.array,
    sample_label: np.array,
    predicted_label: np.array,
    split: str = None,
    data_idx: int = None,
    table: wandb.Table = None,
):
    num_channels, _, _, num_slices = sample_image.shape
    with tqdm(total=num_slices, leave=False) as progress_bar:
        for slice_idx in range(num_slices):
            wandb_images = []
            for channel_idx in range(num_channels):
                wandb_images += [
                    wandb.Image(
                        sample_image[channel_idx, :, :, slice_idx],
                        masks={
                            "ground-truth/Tumor-Core": {
                                "mask_data": sample_label[0, :, :, slice_idx],
                                "class_labels": {0: "background", 1: "Tumor Core"},
                            },
                            "prediction/Tumor-Core": {
                                "mask_data": predicted_label[0, :, :, slice_idx] * 2,
                                "class_labels": {0: "background", 2: "Tumor Core"},
                            },
                        },
                    ),
                    wandb.Image(
                        sample_image[channel_idx, :, :, slice_idx],
                        masks={
                            "ground-truth/Whole-Tumor": {
                                "mask_data": sample_label[1, :, :, slice_idx],
                                "class_labels": {0: "background", 1: "Whole Tumor"},
                            },
                            "prediction/Whole-Tumor": {
                                "mask_data": predicted_label[1, :, :, slice_idx] * 2,
                                "class_labels": {0: "background", 2: "Whole Tumor"},
                            },
                        },
                    ),
                    wandb.Image(
                        sample_image[channel_idx, :, :, slice_idx],
                        masks={
                            "ground-truth/Enhancing-Tumor": {
                                "mask_data": sample_label[2, :, :, slice_idx],
                                "class_labels": {0: "background", 1: "Enhancing Tumor"},
                            },
                            "prediction/Enhancing-Tumor": {
                                "mask_data": predicted_label[2, :, :, slice_idx] * 2,
                                "class_labels": {0: "background", 2: "Enhancing Tumor"},
                            },
                        },
                    ),
                ]
            table.add_data(split, data_idx, slice_idx, *wandb_images)
            progress_bar.update(1)
    return table

予測結果を予測テーブルにログします。

# 予測テーブルを作成
prediction_table = wandb.Table(
    columns=[
        "Split",
        "Data Index",
        "Slice Index",
        "Image-Channel-0/Tumor-Core",
        "Image-Channel-1/Tumor-Core",
        "Image-Channel-2/Tumor-Core",
        "Image-Channel-3/Tumor-Core",
        "Image-Channel-0/Whole-Tumor",
        "Image-Channel-1/Whole-Tumor",
        "Image-Channel-2/Whole-Tumor",
        "Image-Channel-3/Whole-Tumor",
        "Image-Channel-0/Enhancing-Tumor",
        "Image-Channel-1/Enhancing-Tumor",
        "Image-Channel-2/Enhancing-Tumor",
        "Image-Channel-3/Enhancing-Tumor",
    ]
)

# 推論と可視化を実行
with torch.no_grad():
    config.max_prediction_images_visualized
    max_samples = (
        min(config.max_prediction_images_visualized, len(val_dataset))
        if config.max_prediction_images_visualized > 0
        else len(val_dataset)
    )
    progress_bar = tqdm(
        enumerate(val_dataset[:max_samples]),
        total=max_samples,
        desc="Generating Predictions:",
    )
    for data_idx, sample in progress_bar:
        val_input = sample["image"].unsqueeze(0).to(device)
        val_output = inference(model, val_input)
        val_output = post_trans(val_output[0])
        prediction_table = log_predictions_into_tables(
            sample_image=sample["image"].cpu().numpy(),
            sample_label=sample["label"].cpu().numpy(),
            predicted_label=val_output.cpu().numpy(),
            data_idx=data_idx,
            split="validation",
            table=prediction_table,
        )

    wandb.log({"Predictions/Tumor-Segmentation-Data": prediction_table})


# 実験終了
wandb.finish()

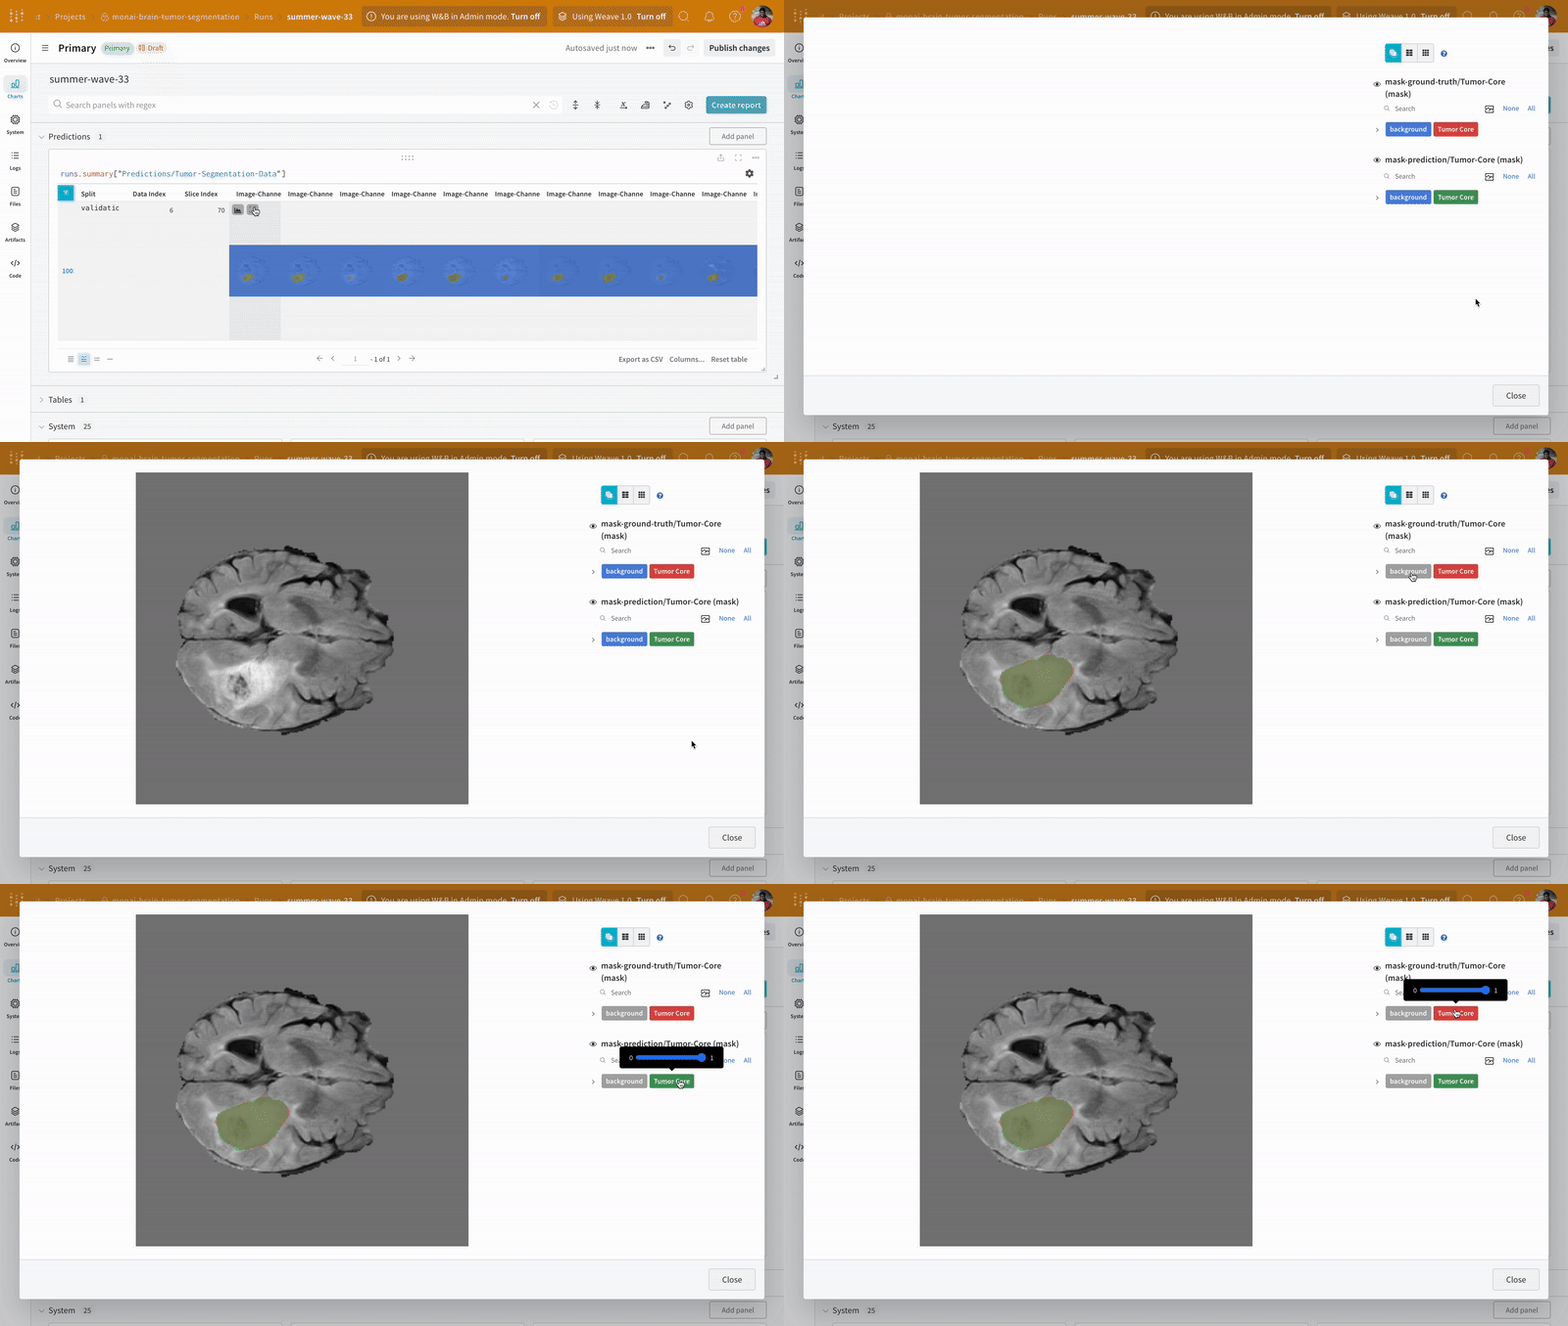
インタラクティブなセグメンテーションマスクオーバーレイを使用して、予測されたセグメンテーションマスクと各クラスの正解ラベルを分析および比較します。

An example of predictions and ground-truth visualization on W&B.
W&Bでの予測と正解の可視化例。

謝辞と追加リソース