# Weights & Biases Documentation
> Weights & Biases Documentation Site
# Guides
> An overview of what is W&B along with links on how to get started if you are a first time user.
## What is W&B?
Weights & Biases (W&B) is the AI developer platform, with tools for training models, fine-tuning models, and leveraging foundation models.
{{< img src="/images/general/architecture.png" alt="" >}}
W&B consists of three major components: [Models]({{< relref "/guides/models.md" >}}), [Weave](https://wandb.github.io/weave/), and [Core]({{< relref "/guides/core/" >}}):
**[W&B Models]({{< relref "/guides/models/" >}})** is a set of lightweight, interoperable tools for machine learning practitioners training and fine-tuning models.
- [Experiments]({{< relref "/guides/models/track/" >}}): Machine learning experiment tracking
- [Sweeps]({{< relref "/guides/models/sweeps/" >}}): Hyperparameter tuning and model optimization
- [Registry]({{< relref "/guides/core/registry/" >}}): Publish and share your ML models and datasets
**[W&B Weave]({{< relref "/guides/weave/" >}})** is a lightweight toolkit for tracking and evaluating LLM applications.
**[W&B Core]({{< relref "/guides/core/" >}})** is set of powerful building blocks for tracking and visualizing data and models, and communicating results.
- [Artifacts]({{< relref "/guides/core/artifacts/" >}}): Version assets and track lineage
- [Tables]({{< relref "/guides/models/tables/" >}}): Visualize and query tabular data
- [Reports]({{< relref "/guides/core/reports/" >}}): Document and collaborate on your discoveries
{{% alert %}}
Learn about recent releases in the [W&B release notes]({{< relref "/ref/release-notes/" >}}).
{{% /alert %}}
## How does W&B work?
Read the following sections in this order if you are a first-time user of W&B and you are interested in training, tracking, and visualizing machine learning models and experiments:
1. Learn about [runs]({{< relref "/guides/models/track/runs/" >}}), W&B's basic unit of computation.
2. Create and track machine learning experiments with [Experiments]({{< relref "/guides/models/track/" >}}).
3. Discover W&B's flexible and lightweight building block for dataset and model versioning with [Artifacts]({{< relref "/guides/core/artifacts/" >}}).
4. Automate hyperparameter search and explore the space of possible models with [Sweeps]({{< relref "/guides/models/sweeps/" >}}).
5. Manage the model lifecycle from training to production with [Registry]({{< relref "/guides/core/registry/" >}}).
6. Visualize predictions across model versions with our [Data Visualization]({{< relref "/guides/models/tables/" >}}) guide.
7. Organize runs, embed and automate visualizations, describe your findings, and share updates with collaborators with [Reports]({{< relref "/guides/core/reports/" >}}).
## Are you a first-time user of W&B?
Try the [quickstart]({{< relref "/guides/quickstart/" >}}) to learn how to install W&B and how to add W&B to your code.
# Launch
> Easily scale and manage ML jobs using W&B Launch.
# launch-library
## Classes
[`class LaunchAgent`](./launchagent.md): Launch agent class which polls run given run queues and launches runs for wandb launch.
## Functions
[`launch(...)`](./launch.md): Launch a W&B launch experiment.
[`launch_add(...)`](./launch_add.md): Enqueue a W&B launch experiment. With either a source uri, job or docker_image.
# Reference
> Generated documentation for Weights & Biases APIs
{{< cardpane >}}
{{< card >}}
A beta query language to select and aggregate data.
{{< /card >}}
{{< /cardpane >}}
{{% alert %}}
Looking for Weave API? See the [W&B Weave Docs](https://weave-docs.wandb.ai/).
{{% /alert %}}
# Search Results
# Tutorials
> Get started using Weights & Biases with interactive tutorials.
## Fundamentals
The following tutorials take you through the fundamentals of W&B for machine learning experiment tracking, model evaluation, hyperparameter tuning, model and dataset versioning, and more.
{{< cardpane >}}
{{< card >}}
Use W&B Sweeps to create an organized way to automatically search through combinations of hyperparameter values such as the learning rate, batch size, number of hidden layers, and more.
Track your ML experiment pipelines using W&B Artifacts.
{{< /card >}}
{{< /cardpane >}}
## Popular ML framework tutorials
See the following tutorials for step by step information on how to use popular ML frameworks and libraries with W&B:
{{< cardpane >}}
{{< card >}}
Use W&B and XGBoost for machine learning experiment tracking, dataset versioning, and project collaboration.
{{< /card >}}
{{< /cardpane >}}
## Other resources
Visit the W&B AI Academy to learn how to train, fine-tune and use LLMs in your applications. Implement MLOps and LLMOps solutions. Tackle real-world ML challenges with W&B courses.
- Large Language Models (LLMs)
- [LLM Engineering: Structured Outputs](https://www.wandb.courses/courses/steering-language-models?utm_source=wandb_docs&utm_medium=code&utm_campaign=tutorials)
- [Building LLM-Powered Apps](https://www.wandb.courses/courses/building-llm-powered-apps?utm_source=wandb_docs&utm_medium=code&utm_campaign=tutorials)
- [Training and Fine-tuning Large Language Models](https://www.wandb.courses/courses/training-fine-tuning-LLMs?utm_source=wandb_docs&utm_medium=code&utm_campaign=tutorials)
- Effective MLOps
- [Model CI/CD](https://www.wandb.courses/courses/enterprise-model-management?utm_source=wandb_docs&utm_medium=code&utm_campaign=tutorials)
- [Effective MLOps: Model Development](https://www.wandb.courses/courses/effective-mlops-model-development?utm_source=wandb_docs&utm_medium=code&utm_campaign=tutorials)
- [CI/CD for Machine Learning (GitOps)](https://www.wandb.courses/courses/ci-cd-for-machine-learning?utm_source=wandb_docs&utm_medium=code&utm_campaign=tutorials)
- [Data Validation in Production ML Pipelines](https://www.wandb.courses/courses/data-validation-for-machine-learning?utm_source=wandb_docs&utm_medium=code&utm_campaign=tutorials)
- [Machine Learning for Business Decision Optimization](https://www.wandb.courses/courses/decision-optimization?utm_source=wandb_docs&utm_medium=code&utm_campaign=tutorials)
- W&B Models
- [W&B 101](https://wandb.ai/site/courses/101/?utm_source=wandb_docs&utm_medium=code&utm_campaign=tutorials)
- [W&B 201: Model Registry](https://www.wandb.courses/courses/201-model-registry?utm_source=wandb_docs&utm_medium=code&utm_campaign=tutorials)
# Guides
> An overview of what is W&B along with links on how to get started if you are a first time user.
## What is W&B?
Weights & Biases (W&B) is the AI developer platform, with tools for training models, fine-tuning models, and leveraging foundation models.
{{< img src="/images/general/architecture.png" alt="" >}}
W&B consists of three major components: [Models]({{< relref "/guides/models.md" >}}), [Weave](https://wandb.github.io/weave/), and [Core]({{< relref "/guides/core/" >}}):
**[W&B Models]({{< relref "/guides/models/" >}})** is a set of lightweight, interoperable tools for machine learning practitioners training and fine-tuning models.
- [Experiments]({{< relref "/guides/models/track/" >}}): Machine learning experiment tracking
- [Sweeps]({{< relref "/guides/models/sweeps/" >}}): Hyperparameter tuning and model optimization
- [Registry]({{< relref "/guides/core/registry/" >}}): Publish and share your ML models and datasets
**[W&B Weave]({{< relref "/guides/weave/" >}})** is a lightweight toolkit for tracking and evaluating LLM applications.
**[W&B Core]({{< relref "/guides/core/" >}})** is set of powerful building blocks for tracking and visualizing data and models, and communicating results.
- [Artifacts]({{< relref "/guides/core/artifacts/" >}}): Version assets and track lineage
- [Tables]({{< relref "/guides/models/tables/" >}}): Visualize and query tabular data
- [Reports]({{< relref "/guides/core/reports/" >}}): Document and collaborate on your discoveries
{{% alert %}}
Learn about recent releases in the [W&B release notes]({{< relref "/ref/release-notes/" >}}).
{{% /alert %}}
## How does W&B work?
Read the following sections in this order if you are a first-time user of W&B and you are interested in training, tracking, and visualizing machine learning models and experiments:
1. Learn about [runs]({{< relref "/guides/models/track/runs/" >}}), W&B's basic unit of computation.
2. Create and track machine learning experiments with [Experiments]({{< relref "/guides/models/track/" >}}).
3. Discover W&B's flexible and lightweight building block for dataset and model versioning with [Artifacts]({{< relref "/guides/core/artifacts/" >}}).
4. Automate hyperparameter search and explore the space of possible models with [Sweeps]({{< relref "/guides/models/sweeps/" >}}).
5. Manage the model lifecycle from training to production with [Registry]({{< relref "/guides/core/registry/" >}}).
6. Visualize predictions across model versions with our [Data Visualization]({{< relref "/guides/models/tables/" >}}) guide.
7. Organize runs, embed and automate visualizations, describe your findings, and share updates with collaborators with [Reports]({{< relref "/guides/core/reports/" >}}).
## Are you a first-time user of W&B?
Try the [quickstart]({{< relref "/guides/quickstart/" >}}) to learn how to install W&B and how to add W&B to your code.
# W&B Quickstart
> W&B Quickstart
Install W&B to track, visualize, and manage machine learning experiments of any size.
{{% alert %}}
Are you looking for information on W&B Weave? See the [Weave Python SDK quickstart](https://weave-docs.wandb.ai/quickstart) or [Weave TypeScript SDK quickstart](https://weave-docs.wandb.ai/reference/generated_typescript_docs/intro-notebook).
{{% /alert %}}
## Sign up and create an API key
To authenticate your machine with W&B, generate an API key from your user profile or at [wandb.ai/authorize](https://wandb.ai/authorize). Copy the API key and store it securely.
## Install the `wandb` library and log in
{{< tabpane text=true >}}
{{% tab header="Command Line" value="cli" %}}
1. Set the `WANDB_API_KEY` [environment variable]({{< relref "/guides/models/track/environment-variables.md" >}}).
```bash
export WANDB_API_KEY=
```
2. Install the `wandb` library and log in.
```shell
pip install wandb
wandb login
```
{{% /tab %}}
{{% tab header="Python" value="python" %}}
```bash
pip install wandb
```
```python
import wandb
wandb.login()
```
{{% /tab %}}
{{% tab header="Python notebook" value="notebook" %}}
```notebook
!pip install wandb
import wandb
wandb.login()
```
{{% /tab %}}
{{< /tabpane >}}
## Start a run and track hyperparameters
In your Python script or notebook, initialize a W&B run object with [`wandb.init()`]({{< relref "/ref/python/run.md" >}}). Use a dictionary for the `config` parameter to specify hyperparameter names and values.
```python
run = wandb.init(
project="my-awesome-project", # Specify your project
config={ # Track hyperparameters and metadata
"learning_rate": 0.01,
"epochs": 10,
},
)
```
A [run]({{< relref "/guides/models/track/runs/" >}}) serves as the core element of W&B, used to [track metrics]({{< relref "/guides/models/track/" >}}), [create logs]({{< relref "/guides/models/track/log/" >}}), and more.
## Assemble the components
This mock training script logs simulated accuracy and loss metrics to W&B:
```python
# train.py
import wandb
import random
wandb.login()
epochs = 10
lr = 0.01
run = wandb.init(
project="my-awesome-project", # Specify your project
config={ # Track hyperparameters and metadata
"learning_rate": lr,
"epochs": epochs,
},
)
offset = random.random() / 5
print(f"lr: {lr}")
# Simulate a training run
for epoch in range(2, epochs):
acc = 1 - 2**-epoch - random.random() / epoch - offset
loss = 2**-epoch + random.random() / epoch + offset
print(f"epoch={epoch}, accuracy={acc}, loss={loss}")
wandb.log({"accuracy": acc, "loss": loss})
# run.log_code()
```
Visit [wandb.ai/home](https://wandb.ai/home) to view recorded metrics such as accuracy and loss and how they changed during each training step. The following image shows the loss and accuracy tracked from each run. Each run object appears in the **Runs** column with generated names.
{{< img src="/images/quickstart/quickstart_image.png" alt="Shows loss and accuracy tracked from each run." >}}
## Next steps
Explore more features of the W&B ecosystem:
1. Read the [W&B Integration tutorials]({{< relref "guides/integrations/" >}}) that combine W&B with frameworks like PyTorch, libraries like Hugging Face, and services like SageMaker.
2. Organize runs, automate visualizations, summarize findings, and share updates with collaborators using [W&B Reports]({{< relref "/guides/core/reports/" >}}).
3. Create [W&B Artifacts]({{< relref "/guides/core/artifacts/" >}}) to track datasets, models, dependencies, and results throughout your machine learning pipeline.
4. Automate hyperparameter searches and optimize models with [W&B Sweeps]({{< relref "/guides/models/sweeps/" >}}).
5. Analyze runs, visualize model predictions, and share insights on a [central dashboard]({{< relref "/guides/models/tables/" >}}).
6. Visit [W&B AI Academy](https://wandb.ai/site/courses/) to learn about LLMs, MLOps, and W&B Models through hands-on courses.
7. Visit the [official W&B Weave documentation](https://weave-docs.wandb.ai/) to learn how to track track, experiment with, evaluate, deploy, and improve your LLM-based applications using Weave.
# W&B Models
W&B Models is the system of record for ML Practitioners who want to organize their models, boost productivity and collaboration, and deliver production ML at scale.
{{< img src="/images/general/architecture.png" alt="" >}}
With W&B Models, you can:
- Track and visualize all [ML experiments]({{< relref "/guides/models/track/" >}}).
- Optimize and fine-tune models at scale with [hyperparameter sweeps]({{< relref "/guides/models/sweeps/" >}}).
- [Maintain a centralized hub of all models]({{< relref "/guides/core/registry/" >}}), with a seamless handoff point to devops and deployment
- Configure custom automations that trigger key workflows for [model CI/CD]({{< relref "/guides/core/automations/" >}}).
Machine learning practitioners rely on W&B Models as their ML system of record to track and visualize experiments, manage model versions and lineage, and optimize hyperparameters.
# W&B Weave
{{% alert %}}
Are you looking for the official Weave documentation? Head over to [https://weave-docs.wandb.ai/](https://weave-docs.wandb.ai/).
{{% /alert %}}
W&B Weave is a framework for tracking, experimenting with, evaluating, deploying, and improving LLM-based applications. Designed for flexibility and scalability, Weave supports every stage of your LLM application development workflow:
- **Tracing & Monitoring**: Track LLM calls and application logic to debug and analyze production systems.
- **Systematic Iteration**: Refine and iterate on prompts, datasets and models.
- **Experimentation**: Experiment with different models and prompts in the LLM Playground.
- **Evaluation**: Use custom or pre-built scorers alongside our comparison tools to systematically assess and enhance application performance.
- **Guardrails**: Protect your application with safeguards for content moderation, prompt safety, and more.
## Get started with Weave
Are you new to Weave? Set up and start using Weave with the [Python quickstart](https://weave-docs.wandb.ai/quickstart) or [TypeScript quickstart](https://weave-docs.wandb.ai/reference/generated_typescript_docs/intro-notebook).
## Advanced guides
Learn more about advanced topics:
- [Integrations](https://weave-docs.wandb.ai/guides/integrations/): Use Weave with popular LLM providers, local models, frameworks, and third-party services.
- [Cookbooks](https://weave-docs.wandb.ai/reference/gen_notebooks/intro_notebook): Build with Weave using Python and TypeScript. Tutorials are available as interactive notebooks.
- [W&B AI Academy](https://www.wandb.courses/pages/w-b-courses): Build advanced RAG systems, improve LLM prompting, fine-tune LLMs, and more.
- [Weave Python SDK](https://weave-docs.wandb.ai/reference/python-sdk/weave/)
- [Weave TypeScript SDK](https://weave-docs.wandb.ai/reference/typescript-sdk/weave/)
- [Weave Service API](https://weave-docs.wandb.ai/reference/service-api/call-start-call-start-post)
# W&B Core
W&B Core is the foundational framework supporting [W&B Models]({{< relref "/guides/models/" >}}) and [W&B Weave]({{< relref "/guides/weave/" >}}), and is itself supported by the [W&B Platform]({{< relref "/guides/hosting/" >}}).
{{< img src="/images/general/core.png" alt="" >}}
W&B Core provides capabilities across the entire ML lifecycle. With W&B Core, you can:
- [Version and manage ML]({{< relref "/guides/core/artifacts/" >}}) pipelines with full lineage tracing for easy auditing and reproducibility.
- Explore and evaluate data and metrics using [interactive, configurable visualizations]({{< relref "/guides/models/tables/" >}}).
- [Document and share]({{< relref "/guides/core/reports/" >}}) insights across the entire organization by generating live reports in digestible, visual formats that are easily understood by non-technical stakeholders.
- [Query and create visualizations of your data]({{< relref "/guides/models/app/features/panels/query-panels/" >}}) that serve your custom needs.
- [Protect sensitive strings using secrets]({{< relref "/guides/core/secrets.md" >}}).
- Configure automations that trigger key workflows for [model CI/CD]({{< relref "/guides/core/automations/" >}}).
# W&B Platform
W&B Platform is the foundational infrastructure, tooling and governance scaffolding which supports the W&B products like [Core]({{< relref "/guides/core" >}}), [Models]({{< relref "/guides/models/" >}}) and [Weave]({{< relref "/guides/weave/" >}}).
W&B Platform is available in three different deployment options:
* [W&B Multi-tenant Cloud]({{< relref "#wb-multi-tenant-cloud" >}})
* [W&B Dedicated Cloud]({{< relref "#wb-dedicated-cloud" >}})
* [W&B Customer-managed]({{< relref "#wb-customer-managed" >}})
The following responsibility matrix outlines some of the key differences:
| | Multi-tenant Cloud | Dedicated Cloud | Customer-managed |
|--------------------------------------|-----------------------------------|---------------------------------------------------------------------|------------------|
| MySQL / DB management | Fully hosted and managed by W&B | Fully hosted & managed by W&B on cloud or region of customer choice | Fully hosted and managed by customer |
| Object Storage (S3/GCS/Blob storage) | **Option 1**: Fully hosted by W&B **Option 2**: Customer can configure their own bucket per team, using the [Secure Storage Connector]({{< relref "/guides/hosting/data-security/secure-storage-connector.md" >}}) | **Option 1**: Fully hosted by W&B **Option 2**: Customer can configure their own bucket per instance or team, using the [Secure Storage Connector]({{< relref "/guides/hosting/data-security/secure-storage-connector.md" >}}) | Fully hosted and managed by customer |
| SSO Support | W&B managed via Auth0 | **Option 1**: Customer managed **Option 2**: Managed by W&B via Auth0 | Fully managed by customer |
| W&B Service (App) | Fully managed by W&B | Fully managed by W&B | Fully managed by customer |
| App security | Fully managed by W&B | Shared responsibility of W&B and customer | Fully managed by customer |
| Maintenance (upgrades, backups, etc.)| Managed by W&B | Managed by W&B | Managed by customer |
| Support | Support SLA | Support SLA | Support SLA |
| Supported cloud infrastructure | GCP | AWS, GCP, Azure | AWS, GCP, Azure, On-Prem bare-metal |
## Deployment options
The following sections provide an overview of each deployment type.
### W&B Multi-tenant Cloud
W&B Multi-tenant Cloud is a fully managed service deployed in W&B's cloud infrastructure, where you can seamlessly access the W&B products at the desired scale, with cost-efficient options for pricing, and with continuous updates for the latest features and functionalities. W&B recommends to use the Multi-tenant Cloud for your product trial, or to manage your production AI workflows if you do not need the security of a private deployment, self-service onboarding is important, and cost efficiency is critical.
See [W&B Multi-tenant Cloud]({{< relref "./hosting-options/saas_cloud.md" >}}) for more information.
### W&B Dedicated Cloud
W&B Dedicated Cloud is a single-tenant, fully managed service deployed in W&B's cloud infrastructure. It is the best place to onboard W&B if your organization requires conformance to strict governance controls including data residency, have need of advanced security capabilities, and are looking to optimize their AI operating costs by not having to build & manage the required infrastructure with security, scale & performance characteristics.
See [W&B Dedicated Cloud]({{< relref "/guides/hosting/hosting-options/dedicated_cloud/" >}}) for more information.
### W&B Customer-Managed
With this option, you can deploy and manage W&B Server on your own managed infrastructure. W&B Server is a self-contained packaged mechanism to run the W&B Platform & its supported W&B products. W&B recommends this option if all your existing infrastructure is on-prem, or your organization has strict regulatory needs that are not satisfied by W&B Dedicated Cloud. With this option, you are fully responsible to manage the provisioning, and continuous maintenance & upgrades of the infrastructure required to support W&B Server.
See [W&B Self Managed]({{< relref "/guides/hosting/hosting-options/self-managed/" >}}) for more information.
## Next steps
If you're looking to try any of the W&B products, W&B recommends using the [Multi-tenant Cloud](https://wandb.ai/home). If you're looking for an enterprise-friendly setup, choose the appropriate deployment type for your trial [here](https://wandb.ai/site/enterprise-trial).
# Integrations
W&B integrations make it fast and easy to set up experiment tracking and data versioning inside existing projects. Check out integrations for ML frameworks such as [PyTorch]({{< relref "pytorch.md" >}}), ML libraries such as [Hugging Face]({{< relref "huggingface.md" >}}), or cloud services such as [Amazon SageMaker]({{< relref "sagemaker.md" >}}).
## Related resources
* [Examples](https://github.com/wandb/examples): Try the code with notebook and script examples for each integration.
* [Video Tutorials](https://www.youtube.com/playlist?list=PLD80i8An1OEGajeVo15ohAQYF1Ttle0lk): Learn to use W&B with YouTube video tutorials
# W&B Models
W&B Models is the system of record for ML Practitioners who want to organize their models, boost productivity and collaboration, and deliver production ML at scale.
{{< img src="/images/general/architecture.png" alt="" >}}
With W&B Models, you can:
- Track and visualize all [ML experiments]({{< relref "/guides/models/track/" >}}).
- Optimize and fine-tune models at scale with [hyperparameter sweeps]({{< relref "/guides/models/sweeps/" >}}).
- [Maintain a centralized hub of all models]({{< relref "/guides/core/registry/" >}}), with a seamless handoff point to devops and deployment
- Configure custom automations that trigger key workflows for [model CI/CD]({{< relref "/guides/core/automations/" >}}).
Machine learning practitioners rely on W&B Models as their ML system of record to track and visualize experiments, manage model versions and lineage, and optimize hyperparameters.
# Experiments
> Track machine learning experiments with W&B.
{{< cta-button productLink="https://wandb.ai/stacey/deep-drive/workspace?workspace=user-lavanyashukla" colabLink="https://colab.research.google.com/github/wandb/examples/blob/master/colabs/intro/Intro_to_Weights_%26_Biases.ipynb" >}}
Track machine learning experiments with a few lines of code. You can then review the results in an [interactive dashboard]({{< relref "/guides/models/track/workspaces.md" >}}) or export your data to Python for programmatic access using our [Public API]({{< relref "/ref/python/public-api/" >}}).
Utilize W&B Integrations if you use popular frameworks such as [PyTorch]({{< relref "/guides/integrations/pytorch.md" >}}), [Keras]({{< relref "/guides/integrations/keras.md" >}}), or [Scikit]({{< relref "/guides/integrations/scikit.md" >}}). See our [Integration guides]({{< relref "/guides/integrations/" >}}) for a for a full list of integrations and information on how to add W&B to your code.
{{< img src="/images/experiments/experiments_landing_page.png" alt="" >}}
The image above shows an example dashboard where you can view and compare metrics across multiple [runs]({{< relref "/guides/models/track/runs/" >}}).
## How it works
Track a machine learning experiment with a few lines of code:
1. Create a [W&B run]({{< relref "/guides/models/track/runs/" >}}).
2. Store a dictionary of hyperparameters, such as learning rate or model type, into your configuration ([`run.config`]({{< relref "./config.md" >}})).
3. Log metrics ([`run.log()`]({{< relref "/guides/models/track/log/" >}})) over time in a training loop, such as accuracy and loss.
4. Save outputs of a run, like the model weights or a table of predictions.
The following code demonstrates a common W&B experiment tracking workflow:
```python
# Start a run.
#
# When this block exits, it waits for logged data to finish uploading.
# If an exception is raised, the run is marked failed.
with wandb.init(entity="", project="my-project-name") as run:
# Save mode inputs and hyperparameters.
run.config.learning_rate = 0.01
# Run your experiment code.
for epoch in range(num_epochs):
# Do some training...
# Log metrics over time to visualize model performance.
run.log({"loss": loss})
# Upload model outputs as artifacts.
run.log_artifact(model)
```
## Get started
Depending on your use case, explore the following resources to get started with W&B Experiments:
* Read the [W&B Quickstart]({{< relref "/guides/quickstart.md" >}}) for a step-by-step outline of the W&B Python SDK commands you could use to create, track, and use a dataset artifact.
* Explore this chapter to learn how to:
* Create an experiment
* Configure experiments
* Log data from experiments
* View results from experiments
* Explore the [W&B Python Library]({{< relref "/ref/python/" >}}) within the [W&B API Reference Guide]({{< relref "/ref/" >}}).
## Best practices and tips
For best practices and tips for experiments and logging, see [Best Practices: Experiments and Logging](https://wandb.ai/wandb/pytorch-lightning-e2e/reports/W-B-Best-Practices-Guide--VmlldzozNTU1ODY1#w&b-experiments-and-logging).
# Sweeps
> Hyperparameter search and model optimization with W&B Sweeps
{{< cta-button productLink="https://wandb.ai/stacey/deep-drive/workspace?workspace=user-lavanyashukla" colabLink="https://colab.research.google.com/github/wandb/examples/blob/master/colabs/pytorch/Organizing_Hyperparameter_Sweeps_in_PyTorch_with_W%26B.ipynb" >}}
Use W&B Sweeps to automate hyperparameter search and visualize rich, interactive experiment tracking. Pick from popular search methods such as Bayesian, grid search, and random to search the hyperparameter space. Scale and parallelize sweep across one or more machines.
{{< img src="/images/sweeps/intro_what_it_is.png" alt="Draw insights from large hyperparameter tuning experiments with interactive dashboards." >}}
### How it works
Create a sweep with two [W&B CLI]({{< relref "/ref/cli/" >}}) commands:
1. Initialize a sweep
```bash
wandb sweep --project
```
2. Start the sweep agent
```bash
wandb agent
```
{{% alert %}}
The preceding code snippet, and the colab linked on this page, show how to initialize and create a sweep with wht W&B CLI. See the Sweeps [Walkthrough]({{< relref "./walkthrough.md" >}}) for a step-by-step outline of the W&B Python SDK commands to use to define a sweep configuration, initialize a sweep, and start a sweep.
{{% /alert %}}
### How to get started
Depending on your use case, explore the following resources to get started with W&B Sweeps:
* Read through the [sweeps walkthrough]({{< relref "./walkthrough.md" >}}) for a step-by-step outline of the W&B Python SDK commands to use to define a sweep configuration, initialize a sweep, and start a sweep.
* Explore this chapter to learn how to:
* [Add W&B to your code]({{< relref "./add-w-and-b-to-your-code.md" >}})
* [Define sweep configuration]({{< relref "/guides/models/sweeps/define-sweep-configuration/" >}})
* [Initialize sweeps]({{< relref "./initialize-sweeps.md" >}})
* [Start sweep agents]({{< relref "./start-sweep-agents.md" >}})
* [Visualize sweep results]({{< relref "./visualize-sweep-results.md" >}})
* Explore a [curated list of Sweep experiments]({{< relref "./useful-resources.md" >}}) that explore hyperparameter optimization with W&B Sweeps. Results are stored in W&B Reports.
For a step-by-step video, see: [Tune Hyperparameters Easily with W&B Sweeps](https://www.youtube.com/watch?v=9zrmUIlScdY\&ab_channel=Weights%26Biases).
# Tables
> Iterate on datasets and understand model predictions
{{< cta-button productLink="https://wandb.ai/wandb/examples/reports/AlphaFold-ed-Proteins-in-W-B-Tables--Vmlldzo4ODc0MDc" colabLink="https://colab.research.google.com/github/wandb/examples/blob/master/colabs/datasets-predictions/W%26B_Tables_Quickstart.ipynb" >}}
Use W&B Tables to visualize and query tabular data. For example:
* Compare how different models perform on the same test set
* Identify patterns in your data
* Look at sample model predictions visually
* Query to find commonly misclassified examples
{{< img src="/images/data_vis/tables_sample_predictions.png" alt="" >}}
The above image shows a table with semantic segmentation and custom metrics. View this table here in this [sample project from the W&B ML Course](https://wandb.ai/av-team/mlops-course-001).
## How it works
A Table is a two-dimensional grid of data where each column has a single type of data. Tables support primitive and numeric types, as well as nested lists, dictionaries, and rich media types.
## Log a Table
Log a table with a few lines of code:
- [`wandb.init()`]({{< relref "/ref/python/init.md" >}}): Create a [run]({{< relref "/guides/models/track/runs/" >}}) to track results.
- [`wandb.Table()`]({{< relref "/ref/python/data-types/table.md" >}}): Create a new table object.
- `columns`: Set the column names.
- `data`: Set the contents of the table.
- [`run.log()`]({{< relref "/ref/python/log.md" >}}): Log the table to save it to W&B.
```python
import wandb
run = wandb.init(project="table-test")
my_table = wandb.Table(columns=["a", "b"], data=[["a1", "b1"], ["a2", "b2"]])
run.log({"Table Name": my_table})
```
## How to get started
* [Quickstart]({{< relref "./tables-walkthrough.md" >}}): Learn to log data tables, visualize data, and query data.
* [Tables Gallery]({{< relref "./tables-gallery.md" >}}): See example use cases for Tables.
# W&B App UI
This section provides details to help you use the W&B App UI. Manage workspaces, teams, and registries, visualize and observe experiments, create panels and reports, configure automations, and more.
Access the W&B App in a web browser.
- A W&B Multi-tenant deployment is accessible on the public web at https://wandb.ai/.
- A W&B Dedicated Cloud deployment is accessible at the domain you configured when you signed up for W&B Dedicated Cloud. An admin user can update the domain in the W&B Management Console. Click on the icon in the top right corner and then click **System console**.
- A W&B Self-Managed deployment is accessible at the hostname you configured when you deployed W&B. For example, if you deploy using Helm, the hostname is configured in `values.global.host`. An admin user can update the domain in the W&B Management Console. Click on the icon in the top right corner and then click **System console**.
Learn more:
- [Track experiments]({{< relref "/guides/models/track/" >}}) using runs or sweeps.
- [Configure deployment settings]({{< relref "settings-page/" >}}) and [defaults]({{< relref "features/cascade-settings.md" >}}).
- [Add panels]({{< relref "/guides/models/app/features/panels/" >}}) to visualize your experiments, such as line plots, bar plots, media panels, query panels, and tables.
- [Add custom charts]({{< relref "/guides/models/app/features/custom-charts/" >}}).
- [Create and share reports]({{< relref "/guides/core/reports/" >}}).
# W&B Weave
{{% alert %}}
Are you looking for the official Weave documentation? Head over to [https://weave-docs.wandb.ai/](https://weave-docs.wandb.ai/).
{{% /alert %}}
W&B Weave is a framework for tracking, experimenting with, evaluating, deploying, and improving LLM-based applications. Designed for flexibility and scalability, Weave supports every stage of your LLM application development workflow:
- **Tracing & Monitoring**: Track LLM calls and application logic to debug and analyze production systems.
- **Systematic Iteration**: Refine and iterate on prompts, datasets and models.
- **Experimentation**: Experiment with different models and prompts in the LLM Playground.
- **Evaluation**: Use custom or pre-built scorers alongside our comparison tools to systematically assess and enhance application performance.
- **Guardrails**: Protect your application with safeguards for content moderation, prompt safety, and more.
## Get started with Weave
Are you new to Weave? Set up and start using Weave with the [Python quickstart](https://weave-docs.wandb.ai/quickstart) or [TypeScript quickstart](https://weave-docs.wandb.ai/reference/generated_typescript_docs/intro-notebook).
## Advanced guides
Learn more about advanced topics:
- [Integrations](https://weave-docs.wandb.ai/guides/integrations/): Use Weave with popular LLM providers, local models, frameworks, and third-party services.
- [Cookbooks](https://weave-docs.wandb.ai/reference/gen_notebooks/intro_notebook): Build with Weave using Python and TypeScript. Tutorials are available as interactive notebooks.
- [W&B AI Academy](https://www.wandb.courses/pages/w-b-courses): Build advanced RAG systems, improve LLM prompting, fine-tune LLMs, and more.
- [Weave Python SDK](https://weave-docs.wandb.ai/reference/python-sdk/weave/)
- [Weave TypeScript SDK](https://weave-docs.wandb.ai/reference/typescript-sdk/weave/)
- [Weave Service API](https://weave-docs.wandb.ai/reference/service-api/call-start-call-start-post)
# W&B Core
W&B Core is the foundational framework supporting [W&B Models]({{< relref "/guides/models/" >}}) and [W&B Weave]({{< relref "/guides/weave/" >}}), and is itself supported by the [W&B Platform]({{< relref "/guides/hosting/" >}}).
{{< img src="/images/general/core.png" alt="" >}}
W&B Core provides capabilities across the entire ML lifecycle. With W&B Core, you can:
- [Version and manage ML]({{< relref "/guides/core/artifacts/" >}}) pipelines with full lineage tracing for easy auditing and reproducibility.
- Explore and evaluate data and metrics using [interactive, configurable visualizations]({{< relref "/guides/models/tables/" >}}).
- [Document and share]({{< relref "/guides/core/reports/" >}}) insights across the entire organization by generating live reports in digestible, visual formats that are easily understood by non-technical stakeholders.
- [Query and create visualizations of your data]({{< relref "/guides/models/app/features/panels/query-panels/" >}}) that serve your custom needs.
- [Protect sensitive strings using secrets]({{< relref "/guides/core/secrets.md" >}}).
- Configure automations that trigger key workflows for [model CI/CD]({{< relref "/guides/core/automations/" >}}).
# Artifacts
> Overview of W&B Artifacts, how they work, and how to get started using them.
{{< cta-button productLink="https://wandb.ai/wandb/arttest/artifacts/model/iv3_trained/5334ab69740f9dda4fed/lineage" colabLink="https://colab.research.google.com/github/wandb/examples/blob/master/colabs/wandb-artifacts/Artifact_fundamentals.ipynb" >}}
Use W&B Artifacts to track and version data as the inputs and outputs of your [W&B Runs]({{< relref "/guides/models/track/runs/" >}}). For example, a model training run might take in a dataset as input and produce a trained model as output. You can log hyperparameters, metadata, and metrics to a run, and you can use an artifact to log, track, and version the dataset used to train the model as input and another artifact for the resulting model checkpoints as output.
## Use cases
You can use artifacts throughout your entire ML workflow as inputs and outputs of [runs]({{< relref "/guides/models/track/runs/" >}}). You can use datasets, models, or even other artifacts as inputs for processing.
{{< img src="/images/artifacts/artifacts_landing_page2.png" >}}
| Use Case | Input | Output |
|------------------------|-----------------------------|------------------------------|
| Model Training | Dataset (training and validation data) | Trained Model |
| Dataset Pre-Processing | Dataset (raw data) | Dataset (pre-processed data) |
| Model Evaluation | Model + Dataset (test data) | [W&B Table]({{< relref "/guides/models/tables/" >}}) |
| Model Optimization | Model | Optimized Model |
{{% alert %}}
The proceeding code snippets are meant to be run in order.
{{% /alert %}}
## Create an artifact
Create an artifact with four lines of code:
1. Create a [W&B run]({{< relref "/guides/models/track/runs/" >}}).
2. Create an artifact object with the [`wandb.Artifact`]({{< relref "/ref/python/artifact.md" >}}) API.
3. Add one or more files, such as a model file or dataset, to your artifact object.
4. Log your artifact to W&B.
For example, the proceeding code snippet shows how to log a file called `dataset.h5` to an artifact called `example_artifact`:
```python
import wandb
run = wandb.init(project="artifacts-example", job_type="add-dataset")
artifact = wandb.Artifact(name="example_artifact", type="dataset")
artifact.add_file(local_path="./dataset.h5", name="training_dataset")
artifact.save()
# Logs the artifact version "my_data" as a dataset with data from dataset.h5
```
{{% alert %}}
See the [track external files]({{< relref "./track-external-files.md" >}}) page for information on how to add references to files or directories stored in external object storage, like an Amazon S3 bucket.
{{% /alert %}}
## Download an artifact
Indicate the artifact you want to mark as input to your run with the [`use_artifact`]({{< relref "/ref/python/run.md#use_artifact" >}}) method.
Following the preceding code snippet, this next code block shows how to use the `training_dataset` artifact:
```python
artifact = run.use_artifact(
"training_dataset:latest"
) # returns a run object using the "my_data" artifact
```
This returns an artifact object.
Next, use the returned object to download all contents of the artifact:
```python
datadir = (
artifact.download()
) # downloads the full `my_data` artifact to the default directory.
```
{{% alert %}}
You can pass a custom path into the `root` [parameter]({{< relref "/ref/python/artifact.md" >}}) to download an artifact to a specific directory. For alternate ways to download artifacts and to see additional parameters, see the guide on [downloading and using artifacts]({{< relref "./download-and-use-an-artifact.md" >}}).
{{% /alert %}}
## Next steps
* Learn how to [version]({{< relref "./create-a-new-artifact-version.md" >}}) and [update]({{< relref "./update-an-artifact.md" >}}) artifacts.
* Learn how to trigger downstream workflows or notify a Slack channel in response to changes to your artifacts with [automations]({{< relref "/guides/core/automations/" >}}).
* Learn about the [registry]({{< relref "/guides/core/registry/" >}}), a space that houses trained models.
* Explore the [Python SDK]({{< relref "/ref/python/artifact.md" >}}) and [CLI]({{< relref "/ref/cli/wandb-artifact/" >}}) reference guides.
# Secrets
> Overview of W&B secrets, how they work, and how to get started using them.
W&B Secret Manager allows you to securely and centrally store, manage, and inject _secrets_, which are sensitive strings such as access tokens, bearer tokens, API keys, or passwords. W&B Secret Manager removes the need to add sensitive strings directly to your code or when configuring a webhook's header or [payload]({{< relref "/guides/core/automations/" >}}).
Secrets are stored and managed in each team's Secret Manager, in the **Team secrets** section of the [team settings]({{< relref "/guides/models/app/settings-page/team-settings/" >}}).
{{% alert %}}
* Only W&B Admins can create, edit, or delete a secret.
* Secrets are included as a core part of W&B, including in [W&B Server deployments]({{< relref "/guides/hosting/" >}}) that you host in Azure, GCP, or AWS. Connect with your W&B account team to discuss how you can use secrets in W&B if you use a different deployment type.
* In W&B Server, you are responsible for configuring security measures that satisfy your security needs.
- W&B strongly recommends that you store secrets in a W&B instance of a cloud provider's secrets manager provided by AWS, GCP, or Azure, which are configured with advanced security capabilities.
- W&B recommends against using a Kubernetes cluster as the backend of your secrets store unless you are unable to use a W&B instance of a cloud secrets manager (AWS, GCP, or Azure), and you understand how to prevent security vulnerabilities that can occur if you use a cluster.
{{% /alert %}}
## Add a secret
To add a secret:
1. If the receiving service requires it to authenticate incoming webhooks, generate the required token or API key. If necessary, save the sensitive string securely, such as in a password manager.
1. Log in to W&B and go to the team's **Settings** page.
1. In the **Team Secrets** section, click **New secret**.
1. Using letters, numbers, and underscores (`_`), provide a name for the secret.
1. Paste the sensitive string into the **Secret** field.
1. Click **Add secret**.
Specify the secrets you want to use for your webhook automation when you configure the webhook. See the [Configure a webhook]({{< relref "#configure-a-webhook" >}}) section for more information.
{{% alert %}}
Once you create a secret, you can access that secret in a [webhook automation's payload]({{< relref "/guides/core/automations/create-automations/webhook.md" >}}) using the format `${SECRET_NAME}`.
{{% /alert %}}
## Rotate a secret
To rotate a secret and update its value:
1. Click the pencil icon in the secret's row to open the secret's details.
1. Set **Secret** to the new value. Optionally click **Reveal secret** to verify the new value.
1. Click **Add secret**. The secret's value updates and no longer resolves to the previous value.
{{% alert %}}
After a secret is created or updated, you can no longer reveal its current value. Instead, rotate the secret to a new value.
{{% /alert %}}
## Delete a secret
To delete a secret:
1. Click the trash icon in the secret's row.
1. Read the confirmation dialog, then click **Delete**. The secret is deleted immediately and permanently.
## Manage access to secrets
A team's automations can use the team's secrets. Before you remove a secret, update or remove automations that use it so they don't stop working.
# Registry
{{< cta-button colabLink="https://colab.research.google.com/github/wandb/examples/blob/master/colabs/wandb_registry/zoo_wandb.ipynb" >}}
{{% alert %}}
W&B Registry is now in public preview. Visit [this]({{< relref "./#enable-wb-registry" >}}) section to learn how to enable it for your deployment type.
{{% /alert %}}
W&B Registry is a curated central repository of [artifact]({{< relref "/guides/core/artifacts/" >}}) versions within your organization. Users who [have permission]({{< relref "./configure_registry.md" >}}) within your organization can [download]({{< relref "./download_use_artifact.md" >}}), share, and collaboratively manage the lifecycle of all artifacts, regardless of the team that user belongs to.
You can use the Registry to [track artifact versions]({{< relref "./link_version.md" >}}), audit the history of an artifact's usage and changes, ensure governance and compliance of your artifacts, and [automate downstream processes such as model CI/CD]({{< relref "/guides/core/automations/" >}}).
In summary, use W&B Registry to:
- [Promote]({{< relref "./link_version.md" >}}) artifact versions that satisfy a machine learning task to other users in your organization.
- Organize [artifacts with tags]({{< relref "./organize-with-tags.md" >}}) so that you can find or reference specific artifacts.
- Track an [artifact’s lineage]({{< relref "/guides/core/registry/lineage.md" >}}) and audit the history of changes.
- [Automate]({{< relref "/guides/core/automations/" >}}) downstream processes such as model CI/CD.
- [Limit who in your organization]({{< relref "./configure_registry.md" >}}) can access artifacts in each registry.
{{< img src="/images/registry/registry_landing_page.png" alt="" >}}
The preceding image shows the Registry App with "Model" and "Dataset" core registries along with custom registries.
## Learn the basics
Each organization initially contains two registries that you can use to organize your model and dataset artifacts called **Models** and **Datasets**, respectively. You can create [additional registries to organize other artifact types based on your organization's needs]({{< relref "./registry_types.md" >}}).
Each [registry]({{< relref "./configure_registry.md" >}}) consists of one or more [collections]({{< relref "./create_collection.md" >}}). Each collection represents a distinct task or use case.
{{< img src="/images/registry/homepage_registry.png" >}}
To add an artifact to a registry, you first log a [specific artifact version to W&B]({{< relref "/guides/core/artifacts/create-a-new-artifact-version.md" >}}). Each time you log an artifact, W&B automatically assigns a version to that artifact. Artifact versions use 0 indexing, so the first version is `v0`, the second version is `v1`, and so on.
Once you log an artifact to W&B, you can then link that specific artifact version to a collection in the registry.
{{% alert %}}
The term "link" refers to pointers that connect where W&B stores the artifact and where the artifact is accessible in the registry. W&B does not duplicate artifacts when you link an artifact to a collection.
{{% /alert %}}
As an example, the proceeding code example shows how to log and link a model artifact called "my_model.txt" to a collection named "first-collection" in the [core registry]({{< relref "./registry_types.md" >}}):
1. Initialize a W&B run.
2. Log the artifact to W&B.
3. Specify the name of the collection and registry to link your artifact version to.
4. Link the artifact to the collection.
Save this Python code to a script and run it. W&B Python SDK version 0.18.6 or newer is required.
```python title="hello_collection.py"
import wandb
import random
# Initialize a W&B run to track the artifact
run = wandb.init(project="registry_quickstart")
# Create a simulated model file so that you can log it
with open("my_model.txt", "w") as f:
f.write("Model: " + str(random.random()))
# Log the artifact to W&B
logged_artifact = run.log_artifact(
artifact_or_path="./my_model.txt",
name="gemma-finetuned",
type="model" # Specifies artifact type
)
# Specify the name of the collection and registry
# you want to publish the artifact to
COLLECTION_NAME = "first-collection"
REGISTRY_NAME = "model"
# Link the artifact to the registry
run.link_artifact(
artifact=logged_artifact,
target_path=f"wandb-registry-{REGISTRY_NAME}/{COLLECTION_NAME}"
)
```
W&B automatically creates a collection for you if the collection you specify in the returned run object's `link_artifact(target_path = "")` method does not exist within the registry you specify.
{{% alert %}}
The URL that your terminal prints directs you to the project where W&B stores your artifact.
{{% /alert %}}
Navigate to the Registry App to view artifact versions that you and other members of your organization publish. To do so, first navigate to W&B. Select **Registry** in the left sidebar below **Applications**. Select the "Model" registry. Within the registry, you should see the "first-collection" collection with your linked artifact version.
Once you link an artifact version to a collection within a registry, members of your organization can view, download, and manage your artifact versions, create downstream automations, and more if they have the proper permissions.
{{% alert %}}
If an artifact version logs metrics (such as by using `run.log_artifact()`), you can view metrics for that version from its details page, and you can compare metrics across artifact versions from the collection's page. Refer to [View linked artifacts in a registry]({{< relref "link_version.md#view-linked-artifacts-in-a-registry" >}}).
{{% /alert %}}
## Enable W&B Registry
Based on your deployment type, satisfy the following conditions to enable W&B Registry:
| Deployment type | How to enable |
| ----- | ----- |
| Multi-tenant Cloud | No action required. W&B Registry is available on the W&B App. |
| Dedicated Cloud | Contact your account team. The Solutions Architect (SA) Team enables W&B Registry within your instance's operator console. Ensure your instance is on server release version 0.59.2 or newer.|
| Self-Managed | Enable the environment variable called `ENABLE_REGISTRY_UI`. To learn more about enabling environment variables in server, visit [these docs]({{< relref "/guides/hosting/env-vars/" >}}). In self-managed instances, your infrastructure administrator should enable this environment variable and set it to `true`. Ensure your instance is on server release version 0.59.2 or newer.|
## Resources to get started
Depending on your use case, explore the following resources to get started with the W&B Registry:
* Check out the tutorial video:
* [Getting started with Registry from Weights & Biases](https://www.youtube.com/watch?v=p4XkVOsjIeM)
* Take the W&B [Model CI/CD](https://www.wandb.courses/courses/enterprise-model-management) course and learn how to:
* Use W&B Registry to manage and version your artifacts, track lineage, and promote models through different lifecycle stages.
* Automate your model management workflows using webhooks.
* Integrate the registry with external ML systems and tools for model evaluation, monitoring, and deployment.
## Migrate from the legacy Model Registry to W&B Registry
The legacy Model Registry is scheduled for deprecation with the exact date not yet decided. Before deprecating the legacy Model Registry, W&B will migrate the contents of the legacy Model Registry to the W&B Registry.
See [Migrating from legacy Model Registry]({{< relref "./model_registry_eol.md" >}}) for more information about the migration process from the legacy Model Registry to W&B Registry.
Until the migration occurs, W&B supports both the legacy Model Registry and the new Registry.
{{% alert %}}
To view the legacy Model Registry, navigate to the Model Registry in the W&B App. A banner appears at the top of the page that enables you to use the legacy Model Registry App UI.
{{< img src="/images/registry/nav_to_old_model_reg.gif" alt="" >}}
{{% /alert %}}
Reach out to support@wandb.com with any questions or to speak to the W&B Product Team about any concerns about the migration.
# Reports
> Project management and collaboration tools for machine learning projects
{{< cta-button productLink="https://wandb.ai/stacey/deep-drive/reports/The-View-from-the-Driver-s-Seat--Vmlldzo1MTg5NQ?utm_source=fully_connected&utm_medium=blog&utm_campaign=view+from+the+drivers+seat" colabLink="https://colab.research.google.com/github/wandb/examples/blob/master/colabs/intro/Report_API_Quickstart.ipynb" >}}
Use W&B Reports to:
- Organize Runs.
- Embed and automate visualizations.
- Describe your findings.
- Share updates with collaborators, either as a LaTeX zip file a PDF.
The following image shows a section of a report created from metrics that were logged to W&B over the course of training.
{{< img src="/images/reports/safe-lite-benchmark-with-comments.png" alt="" max-width="90%" >}}
View the report where the above image was taken from [here](https://wandb.ai/stacey/saferlife/reports/SafeLife-Benchmark-Experiments--Vmlldzo0NjE4MzM).
## How it works
Create a collaborative report with a few clicks.
1. Navigate to your W&B project workspace in the W&B App.
2. Click the **Create report** button in the upper right corner of your workspace.
{{< img src="/images/reports/create_a_report_button.png" alt="" max-width="90%">}}
3. A modal titled **Create Report** will appear. Select the charts and panels you want to add to your report. (You can add or remove charts and panels later).
4. Click **Create report**.
5. Edit the report to your desired state.
6. Click **Publish to project**.
7. Click the **Share** button to share your report with collaborators.
See the [Create a report]({{< relref "./create-a-report.md" >}}) page for more information on how to create reports interactively an programmatically with the W&B Python SDK.
## How to get started
Depending on your use case, explore the following resources to get started with W&B Reports:
* Check out our [video demonstration](https://www.youtube.com/watch?v=2xeJIv_K_eI) to get an overview of W&B Reports.
* Explore the [Reports gallery]({{< relref "./reports-gallery.md" >}}) for examples of live reports.
* Try the [Programmatic Workspaces]({{< relref "/tutorials/workspaces.md" >}}) tutorial to learn how to create and customize your workspace.
* Read curated Reports in [W&B Fully Connected](http://wandb.me/fc).
## Recommended practices and tips
For best practices and tips for Experiments and logging, see [Best Practices: Reports](https://wandb.ai/wandb/pytorch-lightning-e2e/reports/W-B-Best-Practices-Guide--VmlldzozNTU1ODY1#reports).
# Automations
{{% pageinfo color="info" %}}
{{< readfile file="/_includes/enterprise-cloud-only.md" >}}
{{% /pageinfo %}}
This page describes _automations_ in W&B. [Create an automation]({{< relref "create-automations/" >}}) to trigger workflow steps, such as automated model testing and deployment, based on an event in W&B, such as when an [artifact]({{< relref "/guides/core/artifacts" >}}) artifact version is created or when a [run metric]({{< relref "/guides/models/track/runs.md" >}}) meets or changes by a threshold.
For example, an automation can notify a Slack channel when a new version is created, trigger an automated testing webhook when the `production` alias is added to an artifact, or start a validation job only when a run's `loss` is within acceptable bounds.
## Overview
An automation can start when a specific [event]({{< relref "automation-events.md" >}}) occurs in a registry or project.
For an artifact in a [Registry]({{< relref "/guides/core/registry/">}}), an automation can start:
- When a new artifact version is linked to a collection. For example, trigger testing and validation workflows for new candidate models.
- When an alias is added to an artifact version. For example, trigger a deployment workflow when an alias is added to a model version.
For an artifact in a [project]({{< relref "/guides/models/track/project-page.md" >}}), an automation can start:
- When a new version is added to an artifact. For example, start a training job when a new version of a dataset artifact is added to a given collection.
- When an alias is added to an artifact version. For example, trigger a PII redaction workflow when the alias "redaction" is added to a dataset artifact.
- When a metric for a run meets or exceeds a configured threshold.
- When a metric for a run changes by a configured threshold.
This diagram shows the relationship between automation events and actions.
{{< img src="/images/automations/automation_events_actions.png" alt="Diagram showing the relationship between automation events and actions" >}}
For more details, refer to [Automation events and scopes]({{< relref "automation-events.md" >}}).
To [create an automation]({{< relref "create-automations/" >}}), you:
1. If required, configure [secrets]({{< relref "/guides/core/secrets.md" >}}) for sensitive strings the automation requires, such as access tokens, passwords, or sensitive configuration details. Secrets are defined in your **Team Settings**. Secrets are most commonly used in webhook automations to securely pass credentials or tokens to the webhook's external service without exposing it in plain text or hard-coding it in the webhook's payload.
1. Configure the webhook or Slack notification to authorize W&B to post to Slack or run the webhook on your behalf. A single automation action (webhook or Slack notification) can be used by multiple automations. These actions are defined in your **Team Settings**.
1. In the project or registry, create the automation:
1. Define the [event]({{< relref "#automation-events" >}}) to watch for, such as when a new artifact version is added.
1. Define the action to take when the event occurs (posting to a Slack channel or running a webhook). For a webhook, specify a secret to use for the access token and/or a secret to send with the payload, if required.
## Limitations
[Run metric automations]({{< relref "automation-events.md#run-metrics-events">}}) are currently supported only in [W&B Multi-tenant Cloud]({{< relref "/guides/hosting/#wb-multi-tenant-cloud" >}}).
## Next steps
- [Create an automation]({{< relref "create-automations/" >}}).
- Learn about [Automation events and scopes]({{< relref "automation-events.md" >}}).
- [Create a secret]({{< relref "/guides/core/secrets.md" >}}).
# W&B Platform
W&B Platform is the foundational infrastructure, tooling and governance scaffolding which supports the W&B products like [Core]({{< relref "/guides/core" >}}), [Models]({{< relref "/guides/models/" >}}) and [Weave]({{< relref "/guides/weave/" >}}).
W&B Platform is available in three different deployment options:
* [W&B Multi-tenant Cloud]({{< relref "#wb-multi-tenant-cloud" >}})
* [W&B Dedicated Cloud]({{< relref "#wb-dedicated-cloud" >}})
* [W&B Customer-managed]({{< relref "#wb-customer-managed" >}})
The following responsibility matrix outlines some of the key differences:
| | Multi-tenant Cloud | Dedicated Cloud | Customer-managed |
|--------------------------------------|-----------------------------------|---------------------------------------------------------------------|------------------|
| MySQL / DB management | Fully hosted and managed by W&B | Fully hosted & managed by W&B on cloud or region of customer choice | Fully hosted and managed by customer |
| Object Storage (S3/GCS/Blob storage) | **Option 1**: Fully hosted by W&B **Option 2**: Customer can configure their own bucket per team, using the [Secure Storage Connector]({{< relref "/guides/hosting/data-security/secure-storage-connector.md" >}}) | **Option 1**: Fully hosted by W&B **Option 2**: Customer can configure their own bucket per instance or team, using the [Secure Storage Connector]({{< relref "/guides/hosting/data-security/secure-storage-connector.md" >}}) | Fully hosted and managed by customer |
| SSO Support | W&B managed via Auth0 | **Option 1**: Customer managed **Option 2**: Managed by W&B via Auth0 | Fully managed by customer |
| W&B Service (App) | Fully managed by W&B | Fully managed by W&B | Fully managed by customer |
| App security | Fully managed by W&B | Shared responsibility of W&B and customer | Fully managed by customer |
| Maintenance (upgrades, backups, etc.)| Managed by W&B | Managed by W&B | Managed by customer |
| Support | Support SLA | Support SLA | Support SLA |
| Supported cloud infrastructure | GCP | AWS, GCP, Azure | AWS, GCP, Azure, On-Prem bare-metal |
## Deployment options
The following sections provide an overview of each deployment type.
### W&B Multi-tenant Cloud
W&B Multi-tenant Cloud is a fully managed service deployed in W&B's cloud infrastructure, where you can seamlessly access the W&B products at the desired scale, with cost-efficient options for pricing, and with continuous updates for the latest features and functionalities. W&B recommends to use the Multi-tenant Cloud for your product trial, or to manage your production AI workflows if you do not need the security of a private deployment, self-service onboarding is important, and cost efficiency is critical.
See [W&B Multi-tenant Cloud]({{< relref "./hosting-options/saas_cloud.md" >}}) for more information.
### W&B Dedicated Cloud
W&B Dedicated Cloud is a single-tenant, fully managed service deployed in W&B's cloud infrastructure. It is the best place to onboard W&B if your organization requires conformance to strict governance controls including data residency, have need of advanced security capabilities, and are looking to optimize their AI operating costs by not having to build & manage the required infrastructure with security, scale & performance characteristics.
See [W&B Dedicated Cloud]({{< relref "/guides/hosting/hosting-options/dedicated_cloud/" >}}) for more information.
### W&B Customer-Managed
With this option, you can deploy and manage W&B Server on your own managed infrastructure. W&B Server is a self-contained packaged mechanism to run the W&B Platform & its supported W&B products. W&B recommends this option if all your existing infrastructure is on-prem, or your organization has strict regulatory needs that are not satisfied by W&B Dedicated Cloud. With this option, you are fully responsible to manage the provisioning, and continuous maintenance & upgrades of the infrastructure required to support W&B Server.
See [W&B Self Managed]({{< relref "/guides/hosting/hosting-options/self-managed/" >}}) for more information.
## Next steps
If you're looking to try any of the W&B products, W&B recommends using the [Multi-tenant Cloud](https://wandb.ai/home). If you're looking for an enterprise-friendly setup, choose the appropriate deployment type for your trial [here](https://wandb.ai/site/enterprise-trial).
# Deployment options
This section describes the different ways can you can deploy W&B.
## W&B Multi-tenant Cloud
[W&B Multi-tenant Cloud]({{< relref "saas_cloud.md" >}}) is fully managed by W&B, including upgrades, maintenance, platform security, and capacity planning. Multi-tenant Cloud is deployed in W&B's Google Cloud Platform (GCP) account in [GPC's North America regions](https://cloud.google.com/compute/docs/regions-zones). [Bring your own bucket (BYOB)]({{< relref "/guides/hosting/data-security/secure-storage-connector.md" >}}) optionally allows you to store W&B artifacts and other related sensitive data in your own cloud or on-prem infrastructure.
[Learn more about W&B Multi-tenant Cloud]({{< relref "saas_cloud.md" >}}) or [get started for free](https://app.wandb.ai/login?signup=true).
## W&B Dedicated Cloud
[W&B Dedicated Cloud]({{< relref "dedicated_cloud/" >}}) is a single-tenant, fully managed platform designed with enterprise organizations in mind. W&B Dedicated Cloud is deployed in W&B's AWS, GCP or Azure account. Dedicated Cloud provides more flexibility than Multi-tenant Cloud, but less complexity than W&B Self-Hosted. Upgrades, maintenance, platform security, and capacity planning are managed by W&B. Each Dedicated Cloud instance has its own isolated network, compute and storage from other W&B Dedicated Cloud instances.
Your W&B specific metadata and data is stored in an isolated cloud storage and is processed using isolated cloud compute services. [Bring your own bucket (BYOB)]({{< relref "/guides/hosting/data-security/secure-storage-connector.md" >}}) optionally allows you to store W&B artifacts and other related sensitive data in your own cloud or on-premises infrastructure.
W&B Dedicated Cloud includes an [enterprise license]({{< relref "self-managed/server-upgrade-process.md" >}}), which includes support for important security and other enterprise-friendly capabilities.
For organizations with advanced security or compliance requirements, features such as HIPAA compliance, Single Sign On, or Customer Managed Encryption Keys (CMEK) are available with **Enterprise** support. [Request more information](https://wandb.ai/site/contact).
[Learn more about W&B Dedicated Cloud]({{< relref "dedicated_cloud/" >}}) or [get started for free](https://app.wandb.ai/login?signup=true).
## W&B Self-Managed
[W&B Self-Managed]({{< relref "self-managed/" >}}) is entirely managed by you, either on your premises or in cloud infrastructure that you manage. Your IT/DevOps/MLOps team is responsible for:
- Provisioning your deployment.
- Securing your infrastructure in accordance with your organization's policies and [Security Technical Implementation Guidelines (STIG)](https://en.wikipedia.org/wiki/Security_Technical_Implementation_Guide), if applicable.
- Managing upgrades and applying patches.
- Continuously maintaining your self managed W&B Server instance.
You can optionally obtain an enterprise license for W&B Self-Managed. An enterprise license includes support for important security and other enterprise-friendly capabilities.
[Learn more about W&B Self-Managed]({{< relref "self-managed/" >}}) or review the [reference architecture]({{< relref "self-managed/ref-arch.md" >}}) guidelines.
# Identity and access management (IAM)
W&B Platform has three IAM scopes within W&B: [Organizations]({{< relref "#organization" >}}), [Teams]({{< relref "#team" >}}), and [Projects]({{< relref "#project" >}}).
## Organization
An *Organization* is the root scope in your W&B account or instance. All actions in your account or instance take place within the context of that root scope, including managing users, managing teams, managing projects within teams, tracking usage and more.
If you are using [Multi-tenant Cloud]({{< relref "/guides/hosting/hosting-options/saas_cloud.md" >}}), you may have more than one organization where each may correspond to a business unit, a personal user, a joint partnership with another business and more.
If you are using [Dedicated Cloud]({{< relref "/guides/hosting/hosting-options/dedicated_cloud.md" >}}) or a [Self-managed instance]({{< relref "/guides/hosting/hosting-options/self-managed.md" >}}), it corresponds to one organization. Your company may have more than one of Dedicated Cloud or Self-managed instances to map to different business units or departments, though that is strictly an optional way to manage AI practioners across your businesses or departments.
For more information, see [Manage organizations]({{< relref "./access-management/manage-organization.md" >}}).
## Team
A *Team* is a subscope within a organization, that may map to a business unit / function, department, or a project team in your company. You may have more than one team in your organization depending on your deployment type and pricing plan.
AI projects are organized within the context of a team. The access control within a team is governed by team admins, who may or may not be admins at the parent organization level.
For more information, see [Add and manage teams]({{< relref "./access-management/manage-organization.md#add-and-manage-teams" >}}).
## Project
A *Project* is a subscope within a team, that maps to an actual AI project with specific intended outcomes. You may have more than one project within a team. Each project has a visibility mode which determines who can access it.
Every project is comprised of [Workspaces]({{< relref "/guides/models/track/workspaces.md" >}}) and [Reports]({{< relref "/guides/core/reports/" >}}), and is linked to relevant [Artifacts]({{< relref "/guides/core/artifacts/" >}}), [Sweeps]({{< relref "/guides/models/sweeps/" >}}), and [Automations]({{< relref "/guides/core/automations/" >}}).
# Data security
# Configure privacy settings
Organization and Team admins can configure a set of privacy settings at the organization and team scopes respectively. When configured at the organization scope, organization admins enforce those settings for all teams in that organization.
{{% alert %}}
W&B recommends organization admins to enforce a privacy setting only after communicating that in advance to all team admins and users in their organization. This is to avoid unexpected changes in their workflows.
{{% /alert %}}
## Configure privacy settings for a team
Team admins can configure privacy settings for their respective teams from within the `Privacy` section of the team **Settings** tab. Each setting is configurable as long as it's not enforced at the organization scope:
* Hide this team from all non-members
* Make all future team projects private (public sharing not allowed)
* Allow any team member to invite other members (not just admins)
* Turn off public sharing to outside of team for reports in private projects. This turns off existing magic links.
* Allow users with matching organization email domain to join this team.
* This setting is applicable only to [SaaS Cloud]({{< relref "./hosting-options/saas_cloud.md" >}}). It's not available in [Dedicated Cloud]({{< relref "/guides/hosting/hosting-options/dedicated_cloud/" >}}) or [Self-managed]({{< relref "/guides/hosting/hosting-options/self-managed/" >}}) instances.
* Enable code saving by default.
## Enforce privacy settings for all teams
Organization admins can enforce privacy settings for all teams in their organization from within the `Privacy` section of the **Settings** tab in the account or organization dashboard. If organization admins enforce a setting, team admins are not allowed to configure that within their respective teams.
* Enforce team visibility restrictions
* Enable this option to hide all teams from non-members
* Enforce privacy for future projects
* Enable this option to enforce all future projects in all teams to be private or [restricted]({{< relref "./iam/access-management/restricted-projects.md" >}})
* Enforce invitation control
* Enable this option to prevent non-admins from inviting members to any team
* Enforce report sharing control
* Enable this option to turn off public sharing of reports in private projects and deactivate existing magic links
* Enforce team self joining restrictions
* Enable this option to restrict users with matching organization email domain from self-joining any team
* This setting is applicable only to [SaaS Cloud]({{< relref "./hosting-options/saas_cloud.md" >}}). It's not available in [Dedicated Cloud]({{< relref "/guides/hosting/hosting-options/dedicated_cloud/" >}}) or [Self-managed]({{< relref "/guides/hosting/hosting-options/self-managed/" >}}) instances.
* Enforce default code saving restrictions
* Enable this option to turn off code saving by default for all teams
# Monitoring and usage
# Configure SMTP
In W&B server, adding users to the instance or team will trigger an email invite. To send these email invites, W&B uses a third-party mail server. In some cases, organizations might have strict policies on traffic leaving the corporate network and hence causing these email invites to never be sent to the end user. W&B server offers an option to configure sending these invite emails via an internal SMTP server.
To configure, follow the steps below:
- Set the `GORILLA_EMAIL_SINK` environment variable in the docker container or the kubernetes deployment to `smtp://@smtp.host.com:`
- `username` and `password` are optional
- If you’re using an SMTP server that’s designed to be unauthenticated you would just set the value for the environment variable like `GORILLA_EMAIL_SINK=smtp://smtp.host.com:`
- Commonly used port numbers for SMTP are ports 587, 465 and 25. Note that this might differ based on the type of the mail server you're using.
- To configure the default sender email address for SMTP, which is initially set to `noreply@wandb.com`, you can update it to an email address of your choice. This can be done by setting the `GORILLA_EMAIL_FROM_ADDRESS` environment variable on the server to your desired sender email address.
# Configure environment variables
> How to configure the W&B Server installation
In addition to configuring instance level settings via the System Settings admin UI, W&B also provides a way to configure these values via code using Environment Variables. Also, refer to [advanced configuration for IAM]({{< relref "./iam/advanced_env_vars.md" >}}).
## Environment variable reference
| Environment Variable | Description |
|----------------------------------|------------------------------------------------------------------------------------------------------------------------------------------------------------------------------------------|
| `LICENSE` | Your wandb/local license |
| `MYSQL` | The MySQL connection string |
| `BUCKET` | The S3 / GCS bucket for storing data |
| `BUCKET_QUEUE` | The SQS / Google PubSub queue for object creation events |
| `NOTIFICATIONS_QUEUE` | The SQS queue on which to publish run events |
| `AWS_REGION` | The AWS Region where your bucket lives |
| `HOST` | The FQD of your instance, that is `https://my.domain.net` |
| `OIDC_ISSUER` | A URL to your Open ID Connect identity provider, that is `https://cognito-idp.us-east-1.amazonaws.com/us-east-1_uiIFNdacd` |
| `OIDC_CLIENT_ID` | The Client ID of application in your identity provider |
| `OIDC_AUTH_METHOD` | Implicit (default) or pkce, see below for more context |
| `SLACK_CLIENT_ID` | The client ID of the Slack application you want to use for alerts |
| `SLACK_SECRET` | The secret of the Slack application you want to use for alerts |
| `LOCAL_RESTORE` | You can temporarily set this to true if you're unable to access your instance. Check the logs from the container for temporary credentials. |
| `REDIS` | Can be used to setup an external REDIS instance with W&B. |
| `LOGGING_ENABLED` | When set to true, access logs are streamed to stdout. You can also mount a sidecar container and tail `/var/log/gorilla.log` without setting this variable. |
| `GORILLA_ALLOW_USER_TEAM_CREATION` | When set to true, allows non-admin users to create a new team. False by default. |
| `GORILLA_DATA_RETENTION_PERIOD` | How long to retain deleted data from runs in hours. Deleted run data is unrecoverable. Append an `h` to the input value. For example, `"24h"`. |
| `GORILLA_DISABLE_PERSONAL_ENTITY` | When set to true, turns off [personal entities]({{< relref "/support/kb-articles/difference_team_entity_user_entity_mean_me.md" >}}). Prevents creation of new personal projects in their personal entities and prevents writing to existing personal projects. |
| `ENABLE_REGISTRY_UI` | When set to true, enables the new W&B Registry UI. |
| `WANDB_ARTIFACT_DIR` | Where to store all downloaded artifacts. If unset, defaults to the `artifacts` directory relative to your training script. Make sure this directory exists and the running user has permission to write to it. This does not control the location of generated metadata files, which you can set using the `WANDB_DIR` environment variable. |
| `WANDB_DATA_DIR` | Where to upload staging artifacts. The default location depends on your platform, because it uses the value of `user_data_dir` from the `platformdirs` Python package. Make sure this directory exists and the running user has permission to write to it. |
| `WANDB_DIR` | Where to store all generated files. If unset, defaults to the `wandb` directory relative to your training script. Make sure this directory exists and the running user has permission to write to it. This does not control the location of downloaded artifacts, which you can set using the `WANDB_ARTIFACT_DIR` environment variable. |
| `WANDB_IDENTITY_TOKEN_FILE` | For [identity federation]({{< relref "/guides/hosting/iam/authentication/identity_federation.md" >}}), the absolute path to the local directory where Java Web Tokens (JWTs) are stored. |
{{% alert %}}
Use the GORILLA_DATA_RETENTION_PERIOD environment variable cautiously. Data is removed immediately once the environment variable is set. We also recommend that you backup both the database and the storage bucket before you enable this flag.
{{% /alert %}}
## Advanced Reliability Settings
### Redis
Configuring an external Redis server is optional but recommended for production systems. Redis helps improve the reliability of the service and enable caching to decrease load times, especially in large projects. Use a managed Redis service such ElastiCache with high availability (HA) and the following specifications:
- Minimum 4GB of memory, suggested 8GB
- Redis version 6.x
- In transit encryption
- Authentication enabled
To configure the Redis instance with W&B, you can navigate to the W&B settings page at `http(s)://YOUR-W&B-SERVER-HOST/system-admin`. Enable the "Use an external Redis instance" option, and fill in the Redis connection string in the following format:
{{< img src="/images/hosting/configure_redis.png" alt="Configuring REDIS in W&B" >}}
You can also configure Redis using the environment variable `REDIS` on the container or in your Kubernetes deployment. Alternatively, you could also setup `REDIS` as a Kubernetes secret.
This page assumes the Redis instance is running at the default port of `6379`. If you configure a different port, setup authentication and also want to have TLS enabled on the `redis` instance the connection string format would look something like: `redis://$USER:$PASSWORD@$HOST:$PORT?tls=true`
# Integrations
W&B integrations make it fast and easy to set up experiment tracking and data versioning inside existing projects. Check out integrations for ML frameworks such as [PyTorch]({{< relref "pytorch.md" >}}), ML libraries such as [Hugging Face]({{< relref "huggingface.md" >}}), or cloud services such as [Amazon SageMaker]({{< relref "sagemaker.md" >}}).
## Related resources
* [Examples](https://github.com/wandb/examples): Try the code with notebook and script examples for each integration.
* [Video Tutorials](https://www.youtube.com/playlist?list=PLD80i8An1OEGajeVo15ohAQYF1Ttle0lk): Learn to use W&B with YouTube video tutorials
# Add wandb to any library
## Add wandb to any library
This guide provides best practices on how to integrate W&B into your Python library to get powerful Experiment Tracking, GPU and System Monitoring, Model Checkpointing, and more for your own library.
{{% alert %}}
If you are still learning how to use W&B, we recommend exploring the other W&B Guides in these docs, such as [Experiment Tracking]({{< relref "/guides/models/track" >}}), before reading further.
{{% /alert %}}
Below we cover best tips and best practices when the codebase you are working on is more complicated than a single Python training script or Jupyter notebook. The topics covered are:
* Setup requirements
* User Login
* Starting a wandb Run
* Defining a Run Config
* Logging to W&B
* Distributed Training
* Model Checkpointing and More
* Hyper-parameter tuning
* Advanced Integrations
### Setup requirements
Before you get started, decide whether or not to require W&B in your library’s dependencies:
#### Require W&B on installation
Add the W&B Python library (`wandb`) to your dependencies file, for example, in your `requirements.txt` file:
```python
torch==1.8.0
...
wandb==0.13.*
```
#### Make W&B optional on installation
There are two ways to make the W&B SDK (`wandb`) optional:
A. Raise an error when a user tries to use `wandb` functionality without installing it manually and show an appropriate error message:
```python
try:
import wandb
except ImportError:
raise ImportError(
"You are trying to use wandb which is not currently installed."
"Please install it using pip install wandb"
)
```
B. Add `wandb` as an optional dependency to your `pyproject.toml` file, if you are building a Python package:
```toml
[project]
name = "my_awesome_lib"
version = "0.1.0"
dependencies = [
"torch",
"sklearn"
]
[project.optional-dependencies]
dev = [
"wandb"
]
```
### User login
#### Create an API key
An API key authenticates a client or machine to W&B. You can generate an API key from your user profile.
{{% alert %}}
For a more streamlined approach, you can generate an API key by going directly to [https://wandb.ai/authorize](https://wandb.ai/authorize). Copy the displayed API key and save it in a secure location such as a password manager.
{{% /alert %}}
1. Click your user profile icon in the upper right corner.
1. Select **User Settings**, then scroll to the **API Keys** section.
1. Click **Reveal**. Copy the displayed API key. To hide the API key, reload the page.
#### Install the `wandb` library and log in
To install the `wandb` library locally and log in:
{{< tabpane text=true >}}
{{% tab header="Command Line" value="cli" %}}
1. Set the `WANDB_API_KEY` [environment variable]({{< relref "/guides/models/track/environment-variables.md" >}}) to your API key.
```bash
export WANDB_API_KEY=
```
1. Install the `wandb` library and log in.
```shell
pip install wandb
wandb login
```
{{% /tab %}}
{{% tab header="Python" value="python" %}}
```bash
pip install wandb
```
```python
import wandb
wandb.login()
```
{{% /tab %}}
{{% tab header="Python notebook" value="python-notebook" %}}
```notebook
!pip install wandb
import wandb
wandb.login()
```
{{% /tab %}}
{{< /tabpane >}}
If a user is using wandb for the first time without following any of the steps mentioned above, they will automatically be prompted to log in when your script calls `wandb.init`.
### Start a run
A W&B Run is a unit of computation logged by W&B. Typically, you associate a single W&B Run per training experiment.
Initialize W&B and start a Run within your code with:
```python
run = wandb.init()
```
Optionally, you can provide a name for their project, or let the user set it themselves with parameters such as `wandb_project` in your code along with the username or team name, such as `wandb_entity`, for the entity parameter:
```python
run = wandb.init(project=wandb_project, entity=wandb_entity)
```
You must call `run.finish()` to finish the run. If this works with your integration's design, use the run as a context manager:
```python
# When this block exits, it calls run.finish() automatically.
# If it exits due to an exception, it uses run.finish(exit_code=1) which
# marks the run as failed.
with wandb.init() as run:
...
```
#### When to call `wandb.init`?
Your library should create W&B Run as early as possible because any output in your console, including error messages, is logged as part of the W&B Run. This makes debugging easier.
#### Use `wandb` as an optional dependency
If you want to make `wandb` optional when your users use your library, you can either:
* Define a `wandb` flag such as:
{{< tabpane text=true >}}
{{% tab header="Python" value="python" %}}
```python
trainer = my_trainer(..., use_wandb=True)
```
{{% /tab %}}
{{% tab header="Bash" value="bash" %}}
```bash
python train.py ... --use-wandb
```
{{% /tab %}}
{{< /tabpane >}}
* Or, set `wandb` to be `disabled` in `wandb.init`:
{{< tabpane text=true >}}
{{% tab header="Python" value="python" %}}
```python
wandb.init(mode="disabled")
```
{{% /tab %}}
{{% tab header="Bash" value="bash" %}}
```bash
export WANDB_MODE=disabled
```
or
```bash
wandb disabled
```
{{% /tab %}}
{{< /tabpane >}}
* Or, set `wandb` to be offline - note this will still run `wandb`, it just won't try and communicate back to W&B over the internet:
{{< tabpane text=true >}}
{{% tab header="Environment Variable" value="environment" %}}
```bash
export WANDB_MODE=offline
```
or
```python
os.environ['WANDB_MODE'] = 'offline'
```
{{% /tab %}}
{{% tab header="Bash" value="bash" %}}
```bash
wandb offline
```
{{% /tab %}}
{{< /tabpane >}}
### Define a run config
With a `wandb` run config, you can provide metadata about your model, dataset, and so on when you create a W&B Run. You can use this information to compare different experiments and quickly understand the main differences.
{{< img src="/images/integrations/integrations_add_any_lib_runs_page.png" alt="W&B Runs table" >}}
Typical config parameters you can log include:
* Model name, version, architecture parameters, etc.
* Dataset name, version, number of train/val examples, etc.
* Training parameters such as learning rate, batch size, optimizer, etc.
The following code snippet shows how to log a config:
```python
config = {"batch_size": 32, ...}
wandb.init(..., config=config)
```
#### Update the run config
Use `run.config.update` to update the config. Updating your configuration dictionary is useful when parameters are obtained after the dictionary was defined. For example, you might want to add a model’s parameters after the model is instantiated.
```python
run.config.update({"model_parameters": 3500})
```
For more information on how to define a config file, see [Configure experiments]({{< relref "/guides/models/track/config" >}}).
### Log to W&B
#### Log metrics
Create a dictionary where the key value is the name of the metric. Pass this dictionary object to [`run.log`]({{< relref "/guides/models/track/log" >}}):
```python
for epoch in range(NUM_EPOCHS):
for input, ground_truth in data:
prediction = model(input)
loss = loss_fn(prediction, ground_truth)
metrics = { "loss": loss }
run.log(metrics)
```
If you have a lot of metrics, you can have them automatically grouped in the UI by using prefixes in the metric name, such as `train/...` and `val/...`. This will create separate sections in your W&B Workspace for your training and validation metrics, or other metric types you'd like to separate:
```python
metrics = {
"train/loss": 0.4,
"train/learning_rate": 0.4,
"val/loss": 0.5,
"val/accuracy": 0.7
}
run.log(metrics)
```
{{< img src="/images/integrations/integrations_add_any_lib_log.png" alt="A W&B Workspace with 2 separate sections" >}}
[Learn more about `run.log`]({{< relref "/guides/models/track/log" >}}).
#### Prevent x-axis misalignments
If you perform multiple calls to `run.log` for the same training step, the wandb SDK increments an internal step counter for each call to `run.log`. This counter may not align with the training step in your training loop.
To avoid this situation, define your x-axis step explicitly with `run.define_metric`, one time, immediately after you call `wandb.init`:
```python
with wandb.init(...) as run:
run.define_metric("*", step_metric="global_step")
```
The glob pattern, `*`, means that every metric will use `global_step` as the x-axis in your charts. If you only want certain metrics to be logged against `global_step`, you can specify them instead:
```python
run.define_metric("train/loss", step_metric="global_step")
```
Now, log your metrics, your `step` metric, and your `global_step` each time you call `run.log`:
```python
for step, (input, ground_truth) in enumerate(data):
...
run.log({"global_step": step, "train/loss": 0.1})
run.log({"global_step": step, "eval/loss": 0.2})
```
If you do not have access to the independent step variable, for example "global_step" is not available during your validation loop, the previously logged value for "global_step" is automatically used by wandb. In this case, ensure you log an initial value for the metric so it has been defined when it’s needed.
#### Log images, tables, audio, and more
In addition to metrics, you can log plots, histograms, tables, text, and media such as images, videos, audios, 3D, and more.
Some considerations when logging data include:
* How often should the metric be logged? Should it be optional?
* What type of data could be helpful in visualizing?
* For images, you can log sample predictions, segmentation masks, etc., to see the evolution over time.
* For text, you can log tables of sample predictions for later exploration.
[Learn more about logging]({{< relref "/guides/models/track/log" >}}) media, objects, plots, and more.
### Distributed training
For frameworks supporting distributed environments, you can adapt any of the following workflows:
* Detect which is the "main" process and only use `wandb` there. Any required data coming from other processes must be routed to the main process first. (This workflow is encouraged).
* Call `wandb` in every process and auto-group them by giving them all the same unique `group` name.
See [Log Distributed Training Experiments]({{< relref "/guides/models/track/log/distributed-training.md" >}}) for more details.
### Log model checkpoints and more
If your framework uses or produces models or datasets, you can log them for full traceability and have wandb automatically monitor your entire pipeline through W&B Artifacts.
{{< img src="/images/integrations/integrations_add_any_lib_dag.png" alt="Stored Datasets and Model Checkpoints in W&B" >}}
When using Artifacts, it might be useful but not necessary to let your users define:
* The ability to log model checkpoints or datasets (in case you want to make it optional).
* The path/reference of the artifact being used as input, if any. For example, `user/project/artifact`.
* The frequency for logging Artifacts.
#### Log model checkpoints
You can log Model Checkpoints to W&B. It is useful to leverage the unique `wandb` Run ID to name output Model Checkpoints to differentiate them between Runs. You can also add useful metadata. In addition, you can also add aliases to each model as shown below:
```python
metadata = {"eval/accuracy": 0.8, "train/steps": 800}
artifact = wandb.Artifact(
name=f"model-{run.id}",
metadata=metadata,
type="model"
)
artifact.add_dir("output_model") # local directory where the model weights are stored
aliases = ["best", "epoch_10"]
run.log_artifact(artifact, aliases=aliases)
```
For information on how to create a custom alias, see [Create a Custom Alias]({{< relref "/guides/core/artifacts/create-a-custom-alias/" >}}).
You can log output Artifacts at any frequency (for example, every epoch, every 500 steps, and so on) and they are automatically versioned.
#### Log and track pre-trained models or datasets
You can log artifacts that are used as inputs to your training such as pre-trained models or datasets. The following snippet demonstrates how to log an Artifact and add it as an input to the ongoing Run as shown in the graph above.
```python
artifact_input_data = wandb.Artifact(name="flowers", type="dataset")
artifact_input_data.add_file("flowers.npy")
run.use_artifact(artifact_input_data)
```
#### Download an artifact
You re-use an Artifact (dataset, model, etc.) and `wandb` will download a copy locally (and cache it):
```python
artifact = run.use_artifact("user/project/artifact:latest")
local_path = artifact.download("./tmp")
```
Artifacts can be found in the Artifacts section of W&B and can be referenced with aliases generated automatically (`latest`, `v2`, `v3`) or manually when logging (`best_accuracy`, etc.).
To download an Artifact without creating a `wandb` run (through `wandb.init`), for example in distributed environments or for simple inference, you can instead reference the artifact with the [wandb API]({{< relref "/ref/python/public-api" >}}):
```python
artifact = wandb.Api().artifact("user/project/artifact:latest")
local_path = artifact.download()
```
For more information, see [Download and Use Artifacts]({{< relref "/guides/core/artifacts/download-and-use-an-artifact" >}}).
### Tune hyper-parameters
If your library would like to leverage W&B hyper-parameter tuning, [W&B Sweeps]({{< relref "/guides/models/sweeps/" >}}) can also be added to your library.
### Advanced integrations
You can also see what an advanced W&B integrations look like in the following integrations. Note most integrations will not be as complex as these:
* [Hugging Face Transformers `WandbCallback`](https://github.com/huggingface/transformers/blob/49629e7ba8ef68476e08b671d6fc71288c2f16f1/src/transformers/integrations.py#L639)
* [PyTorch Lightning `WandbLogger`](https://github.com/Lightning-AI/lightning/blob/18f7f2d3958fb60fcb17b4cb69594530e83c217f/src/pytorch_lightning/loggers/wandb.py#L53)
# Azure OpenAI Fine-Tuning
> How to Fine-Tune Azure OpenAI models using W&B.
## Introduction
Fine-tuning GPT-3.5 or GPT-4 models on Microsoft Azure using W&B tracks, analyzes, and improves model performance by automatically capturing metrics and facilitating systematic evaluation through W&B's experiment tracking and evaluation tools.
{{< img src="/images/integrations/aoai_ft_plot.png" alt="" >}}
## Prerequisites
- Set up Azure OpenAI service according to [official Azure documentation](https://wandb.me/aoai-wb-int).
- Configure a W&B account with an API key.
## Workflow overview
### 1. Fine-tuning setup
- Prepare training data according to Azure OpenAI requirements.
- Configure the fine-tuning job in Azure OpenAI.
- W&B automatically tracks the fine-tuning process, logging metrics and hyperparameters.
### 2. Experiment tracking
During fine-tuning, W&B captures:
- Training and validation metrics
- Model hyperparameters
- Resource utilization
- Training artifacts
### 3. Model evaluation
After fine-tuning, use [W&B Weave](https://weave-docs.wandb.ai) to:
- Evaluate model outputs against reference datasets
- Compare performance across different fine-tuning runs
- Analyze model behavior on specific test cases
- Make data-driven decisions for model selection
## Real-world example
* Explore the [medical note generation demo](https://wandb.me/aoai-ft-colab) to see how this integration facilitates:
- Systematic tracking of fine-tuning experiments
- Model evaluation using domain-specific metrics
* Go through an [interactive demo of fine-tuning a notebook](https://colab.research.google.com/github/wandb/examples/blob/master/colabs/azure/azure_gpt_medical_notes.ipynb)
## Additional resources
- [Azure OpenAI W&B Integration Guide](https://wandb.me/aoai-wb-int)
- [Azure OpenAI Fine-tuning Documentation](https://learn.microsoft.com/azure/ai-services/openai/how-to/fine-tuning?tabs=turbo%2Cpython&pivots=programming-language-python)
# Catalyst
> How to integrate W&B for Catalyst, a Pytorch framework.
[Catalyst](https://github.com/catalyst-team/catalyst) is a PyTorch framework for deep learning R&D that focuses on reproducibility, rapid experimentation, and codebase reuse so you can create something new.
Catalyst includes a W&B integration for logging parameters, metrics, images, and other artifacts.
Check out their [documentation of the integration](https://catalyst-team.github.io/catalyst/api/loggers.html#catalyst.loggers.wandb.WandbLogger), which includes examples using Python and Hydra.
## Interactive Example
Run an [example colab](https://colab.research.google.com/drive/1PD0LnXiADCtt4mu7bzv7VfQkFXVrPxJq?usp=sharing) to see Catalyst and W&B integration in action.
# Cohere fine-tuning
> How to Fine-Tune Cohere models using W&B.
With Weights & Biases you can log your Cohere model's fine-tuning metrics and configuration to analyze and understand the performance of your models and share the results with your colleagues.
This [guide from Cohere](https://docs.cohere.com/page/convfinqa-finetuning-wandb) has a full example of how to kick off a fine-tuning run and you can find the [Cohere API docs here](https://docs.cohere.com/reference/createfinetunedmodel#request.body.settings.wandb)
## Log your Cohere fine-tuning results
To add Cohere fine-tuning logging to your W&B workspace:
1. Create a `WandbConfig` with your W&B API key, W&B `entity` and `project` name. You can find your W&B API key at https://wandb.ai/authorize
2. Pass this config to the `FinetunedModel` object along with your model name, dataset and hyperparameters to kick off your fine-tuning run.
```python
from cohere.finetuning import WandbConfig, FinetunedModel
# create a config with your W&B details
wandb_ft_config = WandbConfig(
api_key="",
entity="my-entity", # must be a valid enitity associated with the provided API key
project="cohere-ft",
)
... # set up your datasets and hyperparameters
# start a fine-tuning run on cohere
cmd_r_finetune = co.finetuning.create_finetuned_model(
request=FinetunedModel(
name="command-r-ft",
settings=Settings(
base_model=...
dataset_id=...
hyperparameters=...
wandb=wandb_ft_config # pass your W&B config here
),
),
)
```
3. View your model's fine-tuning training and validation metrics and hyperparameters in the W&B project that you created.
{{< img src="/images/integrations/cohere_ft.png" alt="" >}}
## Organize runs
Your W&B runs are automatically organized and can be filtered/sorted based on any configuration parameter such as job type, base model, learning rate and any other hyper-parameter.
In addition, you can rename your runs, add notes or create tags to group them.
## Resources
* **[Cohere Fine-tuning Example](https://github.com/cohere-ai/notebooks/blob/kkt_ft_cookbooks/notebooks/finetuning/convfinqa_finetuning_wandb.ipynb)**
# Databricks
> How to integrate W&B with Databricks.
W&B integrates with [Databricks](https://www.databricks.com/) by customizing the W&B Jupyter notebook experience in the Databricks environment.
## Configure Databricks
1. Install wandb in the cluster
Navigate to your cluster configuration, choose your cluster, click **Libraries**. Click **Install New**, choose **PyPI**, and add the package `wandb`.
2. Set up authentication
To authenticate your W&B account you can add a Databricks secret which your notebooks can query.
```bash
# install databricks cli
pip install databricks-cli
# Generate a token from databricks UI
databricks configure --token
# Create a scope with one of the two commands (depending if you have security features enabled on databricks):
# with security add-on
databricks secrets create-scope --scope wandb
# without security add-on
databricks secrets create-scope --scope wandb --initial-manage-principal users
# Add your api_key from: https://app.wandb.ai/authorize
databricks secrets put --scope wandb --key api_key
```
## Examples
### Simple example
```python
import os
import wandb
api_key = dbutils.secrets.get("wandb", "api_key")
wandb.login(key=api_key)
wandb.init()
wandb.log({"foo": 1})
```
### Sweeps
Setup required (temporary) for notebooks attempting to use wandb.sweep() or wandb.agent():
```python
import os
# These will not be necessary in the future
os.environ["WANDB_ENTITY"] = "my-entity"
os.environ["WANDB_PROJECT"] = "my-project-that-exists"
```
# DeepChecks
> How to integrate W&B with DeepChecks.
{{< cta-button colabLink="https://colab.research.google.com/github/deepchecks/deepchecks/blob/0.5.0-1-g5380093/docs/source/examples/guides/export_outputs_to_wandb.ipynb" >}}
DeepChecks helps you validate your machine learning models and data, such as verifying your data’s integrity, inspecting its distributions, validating data splits, evaluating your model and comparing between different models, all with minimal effort.
[Read more about DeepChecks and the wandb integration ->](https://docs.deepchecks.com/stable/general/usage/exporting_results/auto_examples/plot_exports_output_to_wandb.html)
## Getting Started
To use DeepChecks with Weights & Biases you will first need to sign up for a Weights & Biases account [here](https://wandb.ai/site). With the Weights & Biases integration in DeepChecks you can quickly get started like so:
```python
import wandb
wandb.login()
# import your check from deepchecks
from deepchecks.checks import ModelErrorAnalysis
# run your check
result = ModelErrorAnalysis()
# push that result to wandb
result.to_wandb()
```
You can also log an entire DeepChecks test suite to Weights & Biases
```python
import wandb
wandb.login()
# import your full_suite tests from deepchecks
from deepchecks.suites import full_suite
# create and run a DeepChecks test suite
suite_result = full_suite().run(...)
# push thes results to wandb
# here you can pass any wandb.init configs and arguments you need
suite_result.to_wandb(project="my-suite-project", config={"suite-name": "full-suite"})
```
## Example
``[**This Report**](https://wandb.ai/cayush/deepchecks/reports/Validate-your-Data-and-Models-with-Deepchecks-and-W-B--VmlldzoxNjY0ODc5) shows off the power of using DeepChecks and Weights & Biases
{{< img src="/images/integrations/deepchecks_example.png" alt="" >}}
Any questions or issues about this Weights & Biases integration? Open an issue in the [DeepChecks github repository](https://github.com/deepchecks/deepchecks) and we'll catch it and get you an answer :)
# DeepChem
> How to integrate W&B with DeepChem library.
The [DeepChem library](https://github.com/deepchem/deepchem) provides open source tools that democratize the use of deep-learning in drug discovery, materials science, chemistry, and biology. This W&B integration adds simple and easy-to-use experiment tracking and model checkpointing while training models using DeepChem.
## DeepChem logging in 3 lines of code
```python
logger = WandbLogger(…)
model = TorchModel(…, wandb_logger=logger)
model.fit(…)
```
{{< img src="/images/integrations/cd.png" alt="" >}}
## Report and Google Colab
Explore the Using [W&B with DeepChem: Molecular Graph Convolutional Networks](https://wandb.ai/kshen/deepchem_graphconv/reports/Using-W-B-with-DeepChem-Molecular-Graph-Convolutional-Networks--Vmlldzo4MzU5MDc?galleryTag=) article for an example charts generated using the W&B DeepChem integration.
To dive straight into working code, check out this [**Google Colab**](https://colab.research.google.com/github/wandb/examples/blob/master/colabs/deepchem/W%26B_x_DeepChem.ipynb).
## Track experiments
Set up W&B for DeepChem models of type [KerasModel](https://deepchem.readthedocs.io/en/latest/api_reference/models.html#keras-models) or [TorchModel](https://deepchem.readthedocs.io/en/latest/api_reference/models.html#pytorch-models).
### Sign up and create an API key
An API key authenticates your machine to W&B. You can generate an API key from your user profile.
{{% alert %}}
For a more streamlined approach, you can generate an API key by going directly to [https://wandb.ai/authorize](https://wandb.ai/authorize). Copy the displayed API key and save it in a secure location such as a password manager.
{{% /alert %}}
1. Click your user profile icon in the upper right corner.
1. Select **User Settings**, then scroll to the **API Keys** section.
1. Click **Reveal**. Copy the displayed API key. To hide the API key, reload the page.
### Install the `wandb` library and log in
To install the `wandb` library locally and log in:
{{< tabpane text=true >}}
{{% tab header="Command Line" value="cli" %}}
1. Set the `WANDB_API_KEY` [environment variable]({{< relref "/guides/models/track/environment-variables.md" >}}) to your API key.
```bash
export WANDB_API_KEY=
```
1. Install the `wandb` library and log in.
```shell
pip install wandb
wandb login
```
{{% /tab %}}
{{% tab header="Python" value="python" %}}
```bash
pip install wandb
```
```python
import wandb
wandb.login()
```
{{% /tab %}}
{{% tab header="Python notebook" value="python-notebook" %}}
```notebook
!pip install wandb
import wandb
wandb.login()
```
{{% /tab %}}
{{< /tabpane >}}
### Log your training and evaluation data to W&B
Training loss and evaluation metrics can be automatically logged to W&B. Optional evaluation can be enabled using the DeepChem [ValidationCallback](https://github.com/deepchem/deepchem/blob/master/deepchem/models/callbacks.py), the `WandbLogger` will detect ValidationCallback callback and log the metrics generated.
{{< tabpane text=true >}}
{{% tab header="TorchModel" value="torch" %}}
```python
from deepchem.models import TorchModel, ValidationCallback
vc = ValidationCallback(…) # optional
model = TorchModel(…, wandb_logger=logger)
model.fit(…, callbacks=[vc])
logger.finish()
```
{{% /tab %}}
{{% tab header="KerasModel" value="keras" %}}
```python
from deepchem.models import KerasModel, ValidationCallback
vc = ValidationCallback(…) # optional
model = KerasModel(…, wandb_logger=logger)
model.fit(…, callbacks=[vc])
logger.finish()
```
{{% /tab %}}
{{< /tabpane >}}
# Docker
> How to integrate W&B with Docker.
## Docker Integration
W&B can store a pointer to the Docker image that your code ran in, giving you the ability to restore a previous experiment to the exact environment it was run in. The wandb library looks for the **WANDB_DOCKER** environment variable to persist this state. We provide a few helpers that automatically set this state.
### Local Development
`wandb docker` is a command that starts a docker container, passes in wandb environment variables, mounts your code, and ensures wandb is installed. By default the command uses a docker image with TensorFlow, PyTorch, Keras, and Jupyter installed. You can use the same command to start your own docker image: `wandb docker my/image:latest`. The command mounts the current directory into the "/app" directory of the container, you can change this with the "--dir" flag.
### Production
The `wandb docker-run` command is provided for production workloads. It's meant to be a drop in replacement for `nvidia-docker`. It's a simple wrapper to the `docker run` command that adds your credentials and the **WANDB_DOCKER** environment variable to the call. If you do not pass the "--runtime" flag and `nvidia-docker` is available on the machine, this also ensures the runtime is set to nvidia.
### Kubernetes
If you run your training workloads in Kubernetes and the k8s API is exposed to your pod \(which is the case by default\). wandb will query the API for the digest of the docker image and automatically set the **WANDB_DOCKER** environment variable.
## Restoring
If a run was instrumented with the **WANDB_DOCKER** environment variable, calling `wandb restore username/project:run_id` will checkout a new branch restoring your code then launch the exact docker image used for training pre-populated with the original command.
# Farama Gymnasium
> How to integrate W&B with Farama Gymnasium.
If you're using [Farama Gymnasium](https://gymnasium.farama.org/#) we will automatically log videos of your environment generated by `gymnasium.wrappers.Monitor`. Just set the `monitor_gym` keyword argument to [`wandb.init`]({{< relref "/ref/python/init.md" >}}) to `True`.
Our gymnasium integration is very light. We simply [look at the name of the video file](https://github.com/wandb/wandb/blob/c5fe3d56b155655980611d32ef09df35cd336872/wandb/integration/gym/__init__.py#LL69C67-L69C67) being logged from `gymnasium` and name it after that or fall back to `"videos"` if we don't find a match. If you want more control, you can always just manually [log a video]({{< relref "/guides/models/track/log/media.md" >}}).
Check out this [report](https://wandb.ai/raph-test/cleanrltest/reports/Mario-Bros-but-with-AI-Gymnasium-and-CleanRL---Vmlldzo0NTcxNTcw) to learn more on how to use Gymnasium with the CleanRL library.
{{< img src="/images/integrations/gymnasium.png" alt="" >}}
# fastai
If you're using **fastai** to train your models, W&B has an easy integration using the `WandbCallback`. Explore the details in[ interactive docs with examples →](https://app.wandb.ai/borisd13/demo_config/reports/Visualize-track-compare-Fastai-models--Vmlldzo4MzAyNA)
## Sign up and create an API key
An API key authenticates your machine to W&B. You can generate an API key from your user profile.
{{% alert %}}
For a more streamlined approach, you can generate an API key by going directly to [https://wandb.ai/authorize](https://wandb.ai/authorize). Copy the displayed API key and save it in a secure location such as a password manager.
{{% /alert %}}
1. Click your user profile icon in the upper right corner.
1. Select **User Settings**, then scroll to the **API Keys** section.
1. Click **Reveal**. Copy the displayed API key. To hide the API key, reload the page.
## Install the `wandb` library and log in
To install the `wandb` library locally and log in:
{{< tabpane text=true >}}
{{% tab header="Command Line" value="cli" %}}
1. Set the `WANDB_API_KEY` [environment variable]({{< relref "/guides/models/track/environment-variables.md" >}}) to your API key.
```bash
export WANDB_API_KEY=
```
1. Install the `wandb` library and log in.
```shell
pip install wandb
wandb login
```
{{% /tab %}}
{{% tab header="Python" value="python" %}}
```bash
pip install wandb
```
```python
import wandb
wandb.login()
```
{{% /tab %}}
{{% tab header="Python notebook" value="python-notebook" %}}
```notebook
!pip install wandb
import wandb
wandb.login()
```
{{% /tab %}}
{{< /tabpane >}}
## Add the `WandbCallback` to the `learner` or `fit` method
```python
import wandb
from fastai.callback.wandb import *
# start logging a wandb run
wandb.init(project="my_project")
# To log only during one training phase
learn.fit(..., cbs=WandbCallback())
# To log continuously for all training phases
learn = learner(..., cbs=WandbCallback())
```
{{% alert %}}
If you use version 1 of Fastai, refer to the [Fastai v1 docs]({{< relref "v1.md" >}}).
{{% /alert %}}
## WandbCallback Arguments
`WandbCallback` accepts the following arguments:
| Args | Description |
| ------------------------ | ------------------------------------------------------------------------------------------------------------------------------------------------------------------------------------------------------------------------------------------------------------ |
| log | Whether to log the model's: `gradients` , `parameters`, `all` or `None` (default). Losses & metrics are always logged. |
| log_preds | whether we want to log prediction samples (default to `True`). |
| log_preds_every_epoch | whether to log predictions every epoch or at the end (default to `False`) |
| log_model | whether we want to log our model (default to False). This also requires `SaveModelCallback` |
| model_name | The name of the `file` to save, overrides `SaveModelCallback` |
| log_dataset |
False (default)
True will log folder referenced by learn.dls.path.
a path can be defined explicitly to reference which folder to log.
Note: subfolder "models" is always ignored.
|
| dataset_name | name of logged dataset (default to `folder name`). |
| valid_dl | `DataLoaders` containing items used for prediction samples (default to random items from `learn.dls.valid`. |
| n_preds | number of logged predictions (default to 36). |
| seed | used for defining random samples. |
For custom workflows, you can manually log your datasets and models:
* `log_dataset(path, name=None, metadata={})`
* `log_model(path, name=None, metadata={})`
_Note: any subfolder "models" will be ignored._
## Distributed Training
`fastai` supports distributed training by using the context manager `distrib_ctx`. W&B supports this automatically and enables you to track your Multi-GPU experiments out of the box.
Review this minimal example:
{{< tabpane text=true >}}
{{% tab header="Script" value="script" %}}
```python
import wandb
from fastai.vision.all import *
from fastai.distributed import *
from fastai.callback.wandb import WandbCallback
wandb.require(experiment="service")
path = rank0_first(lambda: untar_data(URLs.PETS) / "images")
def train():
dls = ImageDataLoaders.from_name_func(
path,
get_image_files(path),
valid_pct=0.2,
label_func=lambda x: x[0].isupper(),
item_tfms=Resize(224),
)
wandb.init("fastai_ddp", entity="capecape")
cb = WandbCallback()
learn = vision_learner(dls, resnet34, metrics=error_rate, cbs=cb).to_fp16()
with learn.distrib_ctx(sync_bn=False):
learn.fit(1)
if __name__ == "__main__":
train()
```
Then, in your terminal you will execute:
```shell
$ torchrun --nproc_per_node 2 train.py
```
in this case, the machine has 2 GPUs.
{{% /tab %}}
{{% tab header="Python notebook" value="notebook" %}}
You can now run distributed training directly inside a notebook.
```python
import wandb
from fastai.vision.all import *
from accelerate import notebook_launcher
from fastai.distributed import *
from fastai.callback.wandb import WandbCallback
wandb.require(experiment="service")
path = untar_data(URLs.PETS) / "images"
def train():
dls = ImageDataLoaders.from_name_func(
path,
get_image_files(path),
valid_pct=0.2,
label_func=lambda x: x[0].isupper(),
item_tfms=Resize(224),
)
wandb.init("fastai_ddp", entity="capecape")
cb = WandbCallback()
learn = vision_learner(dls, resnet34, metrics=error_rate, cbs=cb).to_fp16()
with learn.distrib_ctx(in_notebook=True, sync_bn=False):
learn.fit(1)
notebook_launcher(train, num_processes=2)
```
{{% /tab %}}
{{< /tabpane >}}
### Log only on the main process
In the examples above, `wandb` launches one run per process. At the end of the training, you will end up with two runs. This can sometimes be confusing, and you may want to log only on the main process. To do so, you will have to detect in which process you are manually and avoid creating runs (calling `wandb.init` in all other processes)
{{< tabpane text=true >}}
{{% tab header="Script" value="script" %}}
```python
import wandb
from fastai.vision.all import *
from fastai.distributed import *
from fastai.callback.wandb import WandbCallback
wandb.require(experiment="service")
path = rank0_first(lambda: untar_data(URLs.PETS) / "images")
def train():
cb = []
dls = ImageDataLoaders.from_name_func(
path,
get_image_files(path),
valid_pct=0.2,
label_func=lambda x: x[0].isupper(),
item_tfms=Resize(224),
)
if rank_distrib() == 0:
run = wandb.init("fastai_ddp", entity="capecape")
cb = WandbCallback()
learn = vision_learner(dls, resnet34, metrics=error_rate, cbs=cb).to_fp16()
with learn.distrib_ctx(sync_bn=False):
learn.fit(1)
if __name__ == "__main__":
train()
```
in your terminal call:
```
$ torchrun --nproc_per_node 2 train.py
```
{{% /tab %}}
{{% tab header="Python notebook" value="notebook" %}}
```python
import wandb
from fastai.vision.all import *
from accelerate import notebook_launcher
from fastai.distributed import *
from fastai.callback.wandb import WandbCallback
wandb.require(experiment="service")
path = untar_data(URLs.PETS) / "images"
def train():
cb = []
dls = ImageDataLoaders.from_name_func(
path,
get_image_files(path),
valid_pct=0.2,
label_func=lambda x: x[0].isupper(),
item_tfms=Resize(224),
)
if rank_distrib() == 0:
run = wandb.init("fastai_ddp", entity="capecape")
cb = WandbCallback()
learn = vision_learner(dls, resnet34, metrics=error_rate, cbs=cb).to_fp16()
with learn.distrib_ctx(in_notebook=True, sync_bn=False):
learn.fit(1)
notebook_launcher(train, num_processes=2)
```
{{% /tab %}}
{{< /tabpane >}}
## Examples
* [Visualize, track, and compare Fastai models](https://app.wandb.ai/borisd13/demo_config/reports/Visualize-track-compare-Fastai-models--Vmlldzo4MzAyNA): A thoroughly documented walkthrough
* [Image Segmentation on CamVid](http://bit.ly/fastai-wandb): A sample use case of the integration
# Hugging Face Transformers
{{< cta-button colabLink="https://colab.research.google.com/github/wandb/examples/blob/master/colabs/huggingface/Optimize_Hugging_Face_models_with_Weights_&_Biases.ipynb" >}}
The [Hugging Face Transformers](https://huggingface.co/transformers/) library makes state-of-the-art NLP models like BERT and training techniques like mixed precision and gradient checkpointing easy to use. The [W&B integration](https://huggingface.co/transformers/main_classes/callback.html#transformers.integrations.WandbCallback) adds rich, flexible experiment tracking and model versioning to interactive centralized dashboards without compromising that ease of use.
## Next-level logging in few lines
```python
os.environ["WANDB_PROJECT"] = "" # name your W&B project
os.environ["WANDB_LOG_MODEL"] = "checkpoint" # log all model checkpoints
from transformers import TrainingArguments, Trainer
args = TrainingArguments(..., report_to="wandb") # turn on W&B logging
trainer = Trainer(..., args=args)
```
{{< img src="/images/integrations/huggingface_gif.gif" alt="Explore your experiment results in the W&B interactive dashboard" >}}
{{% alert %}}
If you'd rather dive straight into working code, check out this [Google Colab](https://wandb.me/hf).
{{% /alert %}}
## Get started: track experiments
### Sign up and create an API key
An API key authenticates your machine to W&B. You can generate an API key from your user profile.
{{% alert %}}
For a more streamlined approach, you can generate an API key by going directly to [https://wandb.ai/authorize](https://wandb.ai/authorize). Copy the displayed API key and save it in a secure location such as a password manager.
{{% /alert %}}
1. Click your user profile icon in the upper right corner.
1. Select **User Settings**, then scroll to the **API Keys** section.
1. Click **Reveal**. Copy the displayed API key. To hide the API key, reload the page.
### Install the `wandb` library and log in
To install the `wandb` library locally and log in:
{{< tabpane text=true >}}
{{% tab header="Command Line" value="cli" %}}
1. Set the `WANDB_API_KEY` [environment variable]({{< relref "/guides/models/track/environment-variables.md" >}}) to your API key.
```bash
export WANDB_API_KEY=
```
1. Install the `wandb` library and log in.
```shell
pip install wandb
wandb login
```
{{% /tab %}}
{{% tab header="Python" value="python" %}}
```bash
pip install wandb
```
```python
import wandb
wandb.login()
```
{{% /tab %}}
{{% tab header="Python notebook" value="python" %}}
```notebook
!pip install wandb
import wandb
wandb.login()
```
{{% /tab %}}
{{< /tabpane >}}
If you are using W&B for the first time you might want to check out our [**quickstart**]({{< relref "/guides/quickstart.md" >}})
### Name the project
A W&B Project is where all of the charts, data, and models logged from related runs are stored. Naming your project helps you organize your work and keep all the information about a single project in one place.
To add a run to a project simply set the `WANDB_PROJECT` environment variable to the name of your project. The `WandbCallback` will pick up this project name environment variable and use it when setting up your run.
{{< tabpane text=true >}}
{{% tab header="Command Line" value="cli" %}}
```bash
WANDB_PROJECT=amazon_sentiment_analysis
```
{{% /tab %}}
{{% tab header="Python" value="python" %}}
```python
import os
os.environ["WANDB_PROJECT"]="amazon_sentiment_analysis"
```
{{% /tab %}}
{{% tab header="Python notebook" value="notebook" %}}
```notebook
%env WANDB_PROJECT=amazon_sentiment_analysis
```
{{% /tab %}}
{{< /tabpane >}}
{{% alert %}}
Make sure you set the project name _before_ you initialize the `Trainer`.
{{% /alert %}}
If a project name is not specified the project name defaults to `huggingface`.
### Log your training runs to W&B
This is **the most important step** when defining your `Trainer` training arguments, either inside your code or from the command line, is to set `report_to` to `"wandb"` in order enable logging with W&B.
The `logging_steps` argument in `TrainingArguments` will control how often training metrics are pushed to W&B during training. You can also give a name to the training run in W&B using the `run_name` argument.
That's it. Now your models will log losses, evaluation metrics, model topology, and gradients to W&B while they train.
{{< tabpane text=true >}}
{{% tab header="Command Line" value="cli" %}}
```bash
python run_glue.py \ # run your Python script
--report_to wandb \ # enable logging to W&B
--run_name bert-base-high-lr \ # name of the W&B run (optional)
# other command line arguments here
```
{{% /tab %}}
{{% tab header="Python" value="python" %}}
```python
from transformers import TrainingArguments, Trainer
args = TrainingArguments(
# other args and kwargs here
report_to="wandb", # enable logging to W&B
run_name="bert-base-high-lr", # name of the W&B run (optional)
logging_steps=1, # how often to log to W&B
)
trainer = Trainer(
# other args and kwargs here
args=args, # your training args
)
trainer.train() # start training and logging to W&B
```
{{% /tab %}}
{{< /tabpane >}}
{{% alert %}}
Using TensorFlow? Just swap the PyTorch `Trainer` for the TensorFlow `TFTrainer`.
{{% /alert %}}
### Turn on model checkpointing
Using [Artifacts]({{< relref "/guides/core/artifacts/" >}}), you can store up to 100GB of models and datasets for free and then use the Weights & Biases [Registry]({{< relref "/guides/core/registry/" >}}). Using Registry, you can register models to explore and evaluate them, prepare them for staging, or deploy them in your production environment.
To log your Hugging Face model checkpoints to Artifacts, set the `WANDB_LOG_MODEL` environment variable to _one_ of:
- **`checkpoint`**: Upload a checkpoint every `args.save_steps` from the [`TrainingArguments`](https://huggingface.co/docs/transformers/main/en/main_classes/trainer#transformers.TrainingArguments).
- **`end`**: Upload the model at the end of training, if `load_best_model_at_end` is also set.
- **`false`**: Do not upload the model.
{{< tabpane text=true >}}
{{% tab header="Command Line" value="cli" %}}
```bash
WANDB_LOG_MODEL="checkpoint"
```
{{% /tab %}}
{{% tab header="Python" value="python" %}}
```python
import os
os.environ["WANDB_LOG_MODEL"] = "checkpoint"
```
{{% /tab %}}
{{% tab header="Python notebook" value="notebook" %}}
```notebook
%env WANDB_LOG_MODEL="checkpoint"
```
{{% /tab %}}
{{< /tabpane >}}
Any Transformers `Trainer` you initialize from now on will upload models to your W&B project. The model checkpoints you log will be viewable through the [Artifacts]({{< relref "/guides/core/artifacts/" >}}) UI, and include the full model lineage (see an example model checkpoint in the UI [here](https://wandb.ai/wandb/arttest/artifacts/model/iv3_trained/5334ab69740f9dda4fed/lineage?_gl=1*yyql5q*_ga*MTQxOTYyNzExOS4xNjg0NDYyNzk1*_ga_JH1SJHJQXJ*MTY5MjMwNzI2Mi4yNjkuMS4xNjkyMzA5NjM2LjM3LjAuMA..)).
{{% alert %}}
By default, your model will be saved to W&B Artifacts as `model-{run_id}` when `WANDB_LOG_MODEL` is set to `end` or `checkpoint-{run_id}` when `WANDB_LOG_MODEL` is set to `checkpoint`.
However, If you pass a [`run_name`](https://huggingface.co/docs/transformers/main/en/main_classes/trainer#transformers.TrainingArguments.run_name) in your `TrainingArguments`, the model will be saved as `model-{run_name}` or `checkpoint-{run_name}`.
{{% /alert %}}
#### W&B Registry
Once you have logged your checkpoints to Artifacts, you can then register your best model checkpoints and centralize them across your team with **[Registry]({{< relref "/guides/core/registry/" >}})**. Using Registry, you can organize your best models by task, manage the lifecycles of models, track and audit the entire ML lifecyle, and [automate]({{< relref "/guides/core/automations/" >}}) downstream actions.
To link a model Artifact, refer to [Registry]({{< relref "/guides/core/registry/" >}}).
### Visualise evaluation outputs during training
Visualing your model outputs during training or evaluation is often essential to really understand how your model is training.
By using the callbacks system in the Transformers Trainer, you can log additional helpful data to W&B such as your models' text generation outputs or other predictions to W&B Tables.
See the **[Custom logging section]({{< relref "#custom-logging-log-and-view-evaluation-samples-during-training" >}})** below for a full guide on how to log evaluation outupts while training to log to a W&B Table like this:
{{< img src="/images/integrations/huggingface_eval_tables.png" alt="Shows a W&B Table with evaluation outputs" >}}
### Finish your W&B Run (Notebook only)
If your training is encapsulated in a Python script, the W&B run will end when your script finishes.
If you are using a Jupyter or Google Colab notebook, you'll need to tell us when you're done with training by calling `wandb.finish()`.
```python
trainer.train() # start training and logging to W&B
# post-training analysis, testing, other logged code
wandb.finish()
```
### Visualize your results
Once you have logged your training results you can explore your results dynamically in the [W&B Dashboard]({{< relref "/guides/models/track/workspaces.md" >}}). It's easy to compare across dozens of runs at once, zoom in on interesting findings, and coax insights out of complex data with flexible, interactive visualizations.
## Advanced features and FAQs
### How do I save the best model?
If you pass `TrainingArguments` with `load_best_model_at_end=True` to your `Trainer`, W&B saves the best performing model checkpoint to Artifacts.
If you save your model checkpoints as Artifacts, you can promote them to the [Registry]({{< relref "/guides/core/registry/" >}}). In Registry, you can:
- Organize your best model versions by ML task.
- Centralize models and share them with your team.
- Stage models for production or bookmark them for further evaluation.
- Trigger downstream CI/CD processes.
### How do I load a saved model?
If you saved your model to W&B Artifacts with `WANDB_LOG_MODEL`, you can download your model weights for additional training or to run inference. You just load them back into the same Hugging Face architecture that you used before.
```python
# Create a new run
with wandb.init(project="amazon_sentiment_analysis") as run:
# Pass the name and version of Artifact
my_model_name = "model-bert-base-high-lr:latest"
my_model_artifact = run.use_artifact(my_model_name)
# Download model weights to a folder and return the path
model_dir = my_model_artifact.download()
# Load your Hugging Face model from that folder
# using the same model class
model = AutoModelForSequenceClassification.from_pretrained(
model_dir, num_labels=num_labels
)
# Do additional training, or run inference
```
### How do I resume training from a checkpoint?
If you had set `WANDB_LOG_MODEL='checkpoint'` you can also resume training by you can using the `model_dir` as the `model_name_or_path` argument in your `TrainingArguments` and pass `resume_from_checkpoint=True` to `Trainer`.
```python
last_run_id = "xxxxxxxx" # fetch the run_id from your wandb workspace
# resume the wandb run from the run_id
with wandb.init(
project=os.environ["WANDB_PROJECT"],
id=last_run_id,
resume="must",
) as run:
# Connect an Artifact to the run
my_checkpoint_name = f"checkpoint-{last_run_id}:latest"
my_checkpoint_artifact = run.use_artifact(my_model_name)
# Download checkpoint to a folder and return the path
checkpoint_dir = my_checkpoint_artifact.download()
# reinitialize your model and trainer
model = AutoModelForSequenceClassification.from_pretrained(
"", num_labels=num_labels
)
# your awesome training arguments here.
training_args = TrainingArguments()
trainer = Trainer(model=model, args=training_args)
# make sure use the checkpoint dir to resume training from the checkpoint
trainer.train(resume_from_checkpoint=checkpoint_dir)
```
### How do I log and view evaluation samples during training
Logging to W&B via the Transformers `Trainer` is taken care of by the [`WandbCallback`](https://huggingface.co/transformers/main_classes/callback.html#transformers.integrations.WandbCallback) in the Transformers library. If you need to customize your Hugging Face logging you can modify this callback by subclassing `WandbCallback` and adding additional functionality that leverages additional methods from the Trainer class.
Below is the general pattern to add this new callback to the HF Trainer, and further down is a code-complete example to log evaluation outputs to a W&B Table:
```python
# Instantiate the Trainer as normal
trainer = Trainer()
# Instantiate the new logging callback, passing it the Trainer object
evals_callback = WandbEvalsCallback(trainer, tokenizer, ...)
# Add the callback to the Trainer
trainer.add_callback(evals_callback)
# Begin Trainer training as normal
trainer.train()
```
#### View evaluation samples during training
The following section shows how to customize the `WandbCallback` to run model predictions and log evaluation samples to a W&B Table during training. We will every `eval_steps` using the `on_evaluate` method of the Trainer callback.
Here, we wrote a `decode_predictions` function to decode the predictions and labels from the model output using the tokenizer.
Then, we create a pandas DataFrame from the predictions and labels and add an `epoch` column to the DataFrame.
Finally, we create a `wandb.Table` from the DataFrame and log it to wandb.
Additionally, we can control the frequency of logging by logging the predictions every `freq` epochs.
**Note**: Unlike the regular `WandbCallback` this custom callback needs to be added to the trainer **after** the `Trainer` is instantiated and not during initialization of the `Trainer`.
This is because the `Trainer` instance is passed to the callback during initialization.
```python
from transformers.integrations import WandbCallback
import pandas as pd
def decode_predictions(tokenizer, predictions):
labels = tokenizer.batch_decode(predictions.label_ids)
logits = predictions.predictions.argmax(axis=-1)
prediction_text = tokenizer.batch_decode(logits)
return {"labels": labels, "predictions": prediction_text}
class WandbPredictionProgressCallback(WandbCallback):
"""Custom WandbCallback to log model predictions during training.
This callback logs model predictions and labels to a wandb.Table at each
logging step during training. It allows to visualize the
model predictions as the training progresses.
Attributes:
trainer (Trainer): The Hugging Face Trainer instance.
tokenizer (AutoTokenizer): The tokenizer associated with the model.
sample_dataset (Dataset): A subset of the validation dataset
for generating predictions.
num_samples (int, optional): Number of samples to select from
the validation dataset for generating predictions. Defaults to 100.
freq (int, optional): Frequency of logging. Defaults to 2.
"""
def __init__(self, trainer, tokenizer, val_dataset, num_samples=100, freq=2):
"""Initializes the WandbPredictionProgressCallback instance.
Args:
trainer (Trainer): The Hugging Face Trainer instance.
tokenizer (AutoTokenizer): The tokenizer associated
with the model.
val_dataset (Dataset): The validation dataset.
num_samples (int, optional): Number of samples to select from
the validation dataset for generating predictions.
Defaults to 100.
freq (int, optional): Frequency of logging. Defaults to 2.
"""
super().__init__()
self.trainer = trainer
self.tokenizer = tokenizer
self.sample_dataset = val_dataset.select(range(num_samples))
self.freq = freq
def on_evaluate(self, args, state, control, **kwargs):
super().on_evaluate(args, state, control, **kwargs)
# control the frequency of logging by logging the predictions
# every `freq` epochs
if state.epoch % self.freq == 0:
# generate predictions
predictions = self.trainer.predict(self.sample_dataset)
# decode predictions and labels
predictions = decode_predictions(self.tokenizer, predictions)
# add predictions to a wandb.Table
predictions_df = pd.DataFrame(predictions)
predictions_df["epoch"] = state.epoch
records_table = self._wandb.Table(dataframe=predictions_df)
# log the table to wandb
self._wandb.log({"sample_predictions": records_table})
# First, instantiate the Trainer
trainer = Trainer(
model=model,
args=training_args,
train_dataset=lm_datasets["train"],
eval_dataset=lm_datasets["validation"],
)
# Instantiate the WandbPredictionProgressCallback
progress_callback = WandbPredictionProgressCallback(
trainer=trainer,
tokenizer=tokenizer,
val_dataset=lm_dataset["validation"],
num_samples=10,
freq=2,
)
# Add the callback to the trainer
trainer.add_callback(progress_callback)
```
For a more detailed example please refer to this [colab](https://colab.research.google.com/github/wandb/examples/blob/master/colabs/huggingface/Custom_Progress_Callback.ipynb)
### What additional W&B settings are available?
Further configuration of what is logged with `Trainer` is possible by setting environment variables. A full list of W&B environment variables [can be found here]({{< relref "/guides/hosting/env-vars/" >}}).
| Environment Variable | Usage |
| -------------------- |----------------------------------------------------------------------------------------------------------------------------------------------------------------------------------------------------------------------------------------------------------------------------------------------------------|
| `WANDB_PROJECT` | Give your project a name (`huggingface` by default) |
| `WANDB_LOG_MODEL` |
Log the model checkpoint as a W&B Artifact (`false` by default)
false (default): No model checkpointing
checkpoint: A checkpoint will be uploaded every args.save_steps (set in the Trainer's TrainingArguments).
end: The final model checkpoint will be uploaded at the end of training.
|
| `WANDB_WATCH` |
Set whether you'd like to log your models gradients, parameters or neither
false (default): No gradient or parameter logging
gradients: Log histograms of the gradients
all: Log histograms of gradients and parameters
|
| `WANDB_DISABLED` | Set to `true` to turn off logging entirely (`false` by default) |
| `WANDB_SILENT` | Set to `true` to silence the output printed by wandb (`false` by default) |
{{< tabpane text=true >}}
{{% tab header="Command Line" value="cli" %}}
```bash
WANDB_WATCH=all
WANDB_SILENT=true
```
{{% /tab %}}
{{% tab header="Notebook" value="notebook" %}}
```notebook
%env WANDB_WATCH=all
%env WANDB_SILENT=true
```
{{% /tab %}}
{{< /tabpane >}}
### How do I customize `wandb.init`?
The `WandbCallback` that `Trainer` uses will call `wandb.init` under the hood when `Trainer` is initialized. You can alternatively set up your runs manually by calling `wandb.init` before the`Trainer` is initialized. This gives you full control over your W&B run configuration.
An example of what you might want to pass to `init` is below. For more details on how to use `wandb.init`, [check out the reference documentation]({{< relref "/ref/python/init.md" >}}).
```python
wandb.init(
project="amazon_sentiment_analysis",
name="bert-base-high-lr",
tags=["baseline", "high-lr"],
group="bert",
)
```
## Additional resources
Below are 6 Transformers and W&B related articles you might enjoy
Hyperparameter Optimization for Hugging Face Transformers
* Three strategies for hyperparameter optimization for Hugging Face Transformers are compared: Grid Search, Bayesian Optimization, and Population Based Training.
* We use a standard uncased BERT model from Hugging Face transformers, and we want to fine-tune on the RTE dataset from the SuperGLUE benchmark
* Results show that Population Based Training is the most effective approach to hyperparameter optimization of our Hugging Face transformer model.
Read the full report [here](https://wandb.ai/amogkam/transformers/reports/Hyperparameter-Optimization-for-Hugging-Face-Transformers--VmlldzoyMTc2ODI).
Hugging Tweets: Train a Model to Generate Tweets
* In the article, the author demonstrates how to fine-tune a pre-trained GPT2 HuggingFace Transformer model on anyone's Tweets in five minutes.
* The model uses the following pipeline: Downloading Tweets, Optimizing the Dataset, Initial Experiments, Comparing Losses Between Users, Fine-Tuning the Model.
Read the full report [here](https://wandb.ai/wandb/huggingtweets/reports/HuggingTweets-Train-a-Model-to-Generate-Tweets--VmlldzoxMTY5MjI).
Sentence Classification With Hugging Face BERT and WB
* In this article, we'll build a sentence classifier leveraging the power of recent breakthroughs in Natural Language Processing, focusing on an application of transfer learning to NLP.
* We'll be using The Corpus of Linguistic Acceptability (CoLA) dataset for single sentence classification, which is a set of sentences labeled as grammatically correct or incorrect that was first published in May 2018.
* We'll use Google's BERT to create high performance models with minimal effort on a range of NLP tasks.
Read the full report [here](https://wandb.ai/cayush/bert-finetuning/reports/Sentence-Classification-With-Huggingface-BERT-and-W-B--Vmlldzo4MDMwNA).
A Step by Step Guide to Tracking Hugging Face Model Performance
* We use W&B and Hugging Face transformers to train DistilBERT, a Transformer that's 40% smaller than BERT but retains 97% of BERT's accuracy, on the GLUE benchmark
* The GLUE benchmark is a collection of nine datasets and tasks for training NLP models
Read the full report [here](https://wandb.ai/jxmorris12/huggingface-demo/reports/A-Step-by-Step-Guide-to-Tracking-HuggingFace-Model-Performance--VmlldzoxMDE2MTU).
Examples of Early Stopping in HuggingFace
* Fine-tuning a Hugging Face Transformer using Early Stopping regularization can be done natively in PyTorch or TensorFlow.
* Using the EarlyStopping callback in TensorFlow is straightforward with the `tf.keras.callbacks.EarlyStopping`callback.
* In PyTorch, there is not an off-the-shelf early stopping method, but there is a working early stopping hook available on GitHub Gist.
Read the full report [here](https://wandb.ai/ayush-thakur/huggingface/reports/Early-Stopping-in-HuggingFace-Examples--Vmlldzo0MzE2MTM).
How to Fine-Tune Hugging Face Transformers on a Custom Dataset
We fine tune a DistilBERT transformer for sentiment analysis (binary classification) on a custom IMDB dataset.
Read the full report [here](https://wandb.ai/ayush-thakur/huggingface/reports/How-to-Fine-Tune-HuggingFace-Transformers-on-a-Custom-Dataset--Vmlldzo0MzQ2MDc).
## Get help or request features
For any issues, questions, or feature requests for the Hugging Face W&B integration, feel free to post in [this thread on the Hugging Face forums](https://discuss.huggingface.co/t/logging-experiment-tracking-with-w-b/498) or open an issue on the Hugging Face [Transformers GitHub repo](https://github.com/huggingface/transformers).
# Hugging Face Diffusers
{{< cta-button colabLink="https://colab.research.google.com/github/wandb/examples/blob/master/colabs/diffusers/lcm-diffusers.ipynb" >}}
[Hugging Face Diffusers](https://huggingface.co/docs/diffusers) is the go-to library for state-of-the-art pre-trained diffusion models for generating images, audio, and even 3D structures of molecules. The W&B integration adds rich, flexible experiment tracking, media visualization, pipeline architecture, and configuration management to interactive centralized dashboards without compromising that ease of use.
## Next-level logging in just two lines
Log all the prompts, negative prompts, generated media, and configs associated with your experiment by simply including 2 lines of code. Here are the 2 lines of code to begin logging:
```python
# import the autolog function
from wandb.integration.diffusers import autolog
# call the autolog before calling the pipeline
autolog(init=dict(project="diffusers_logging"))
```
| {{< img src="/images/integrations/diffusers-autolog-4.gif" alt="An example of how the results of your experiment are logged" >}} |
|:--:|
| **An example of how the results of your experiment are logged.** |
## Get started
1. Install `diffusers`, `transformers`, `accelerate`, and `wandb`.
- Command line:
```shell
pip install --upgrade diffusers transformers accelerate wandb
```
- Notebook:
```bash
!pip install --upgrade diffusers transformers accelerate wandb
```
2. Use `autolog` to initialize a Weights & Biases run and automatically track the inputs and the outputs from [all supported pipeline calls](https://github.com/wandb/wandb/blob/main/wandb/integration/diffusers/autologger.py#L12-L72).
You can call the `autolog()` function with the `init` parameter, which accepts a dictionary of parameters required by [`wandb.init()`]({{< relref "/ref/python/init" >}}).
When you call `autolog()`, it initializes a Weights & Biases run and automatically tracks the inputs and the outputs from [all supported pipeline calls](https://github.com/wandb/wandb/blob/main/wandb/integration/diffusers/autologger.py#L12-L72).
- Each pipeline call is tracked into its own [table]({{< relref "/guides/models/tables/" >}}) in the workspace, and the configs associated with the pipeline call is appended to the list of workflows in the configs for that run.
- The prompts, negative prompts, and the generated media are logged in a [`wandb.Table`]({{< relref "/guides/models/tables/" >}}).
- All other configs associated with the experiment including seed and the pipeline architecture are stored in the config section for the run.
- The generated media for each pipeline call are also logged in [media panels]({{< relref "/guides/models/track/log/media" >}}) in the run.
{{% alert %}}
You can find a list of supported pipeline calls [here](https://github.com/wandb/wandb/blob/main/wandb/integration/diffusers/autologger.py#L12-L72). In case, you want to request a new feature of this integration or report a bug associated with it, please open an issue on [https://github.com/wandb/wandb/issues](https://github.com/wandb/wandb/issues).
{{% /alert %}}
## Examples
### Autologging
Here is a brief end-to-end example of the autolog in action:
{{< tabpane text=true >}}
{{% tab header="Script" value="script" %}}
```python
import torch
from diffusers import DiffusionPipeline
# import the autolog function
from wandb.integration.diffusers import autolog
# call the autolog before calling the pipeline
autolog(init=dict(project="diffusers_logging"))
# Initialize the diffusion pipeline
pipeline = DiffusionPipeline.from_pretrained(
"stabilityai/stable-diffusion-2-1", torch_dtype=torch.float16
).to("cuda")
# Define the prompts, negative prompts, and seed.
prompt = ["a photograph of an astronaut riding a horse", "a photograph of a dragon"]
negative_prompt = ["ugly, deformed", "ugly, deformed"]
generator = torch.Generator(device="cpu").manual_seed(10)
# call the pipeline to generate the images
images = pipeline(
prompt,
negative_prompt=negative_prompt,
num_images_per_prompt=2,
generator=generator,
)
```
{{% /tab %}}
{{% tab header="Notebook" value="notebook"%}}
```python
import torch
from diffusers import DiffusionPipeline
import wandb
# import the autolog function
from wandb.integration.diffusers import autolog
# call the autolog before calling the pipeline
autolog(init=dict(project="diffusers_logging"))
# Initialize the diffusion pipeline
pipeline = DiffusionPipeline.from_pretrained(
"stabilityai/stable-diffusion-2-1", torch_dtype=torch.float16
).to("cuda")
# Define the prompts, negative prompts, and seed.
prompt = ["a photograph of an astronaut riding a horse", "a photograph of a dragon"]
negative_prompt = ["ugly, deformed", "ugly, deformed"]
generator = torch.Generator(device="cpu").manual_seed(10)
# call the pipeline to generate the images
images = pipeline(
prompt,
negative_prompt=negative_prompt,
num_images_per_prompt=2,
generator=generator,
)
# Finish the experiment
wandb.finish()
```
{{% /tab %}}
{{< /tabpane >}}
- The results of a single experiment:
{{< img src="/images/integrations/diffusers-autolog-2.gif" alt="An example of how the results of your experiment are logged" >}}
- The results of multiple experiments:
{{< img src="/images/integrations/diffusers-autolog-1.gif" alt="An example of how the results of your experiment are logged" >}}
- The config of an experiment:
{{< img src="/images/integrations/diffusers-autolog-3.gif" alt="An example of how the autolog logs the configs of your experiment" >}}
{{% alert %}}
You need to explicitly call [`wandb.finish()`]({{< relref "/ref/python/finish" >}}) when executing the code in IPython notebook environments after calling the pipeline. This is not necessary when executing python scripts.
{{% /alert %}}
### Tracking multi-pipeline workflows
This section demonstrates the autolog with a typical [Stable Diffusion XL + Refiner](https://huggingface.co/docs/diffusers/using-diffusers/sdxl#base-to-refiner-model) workflow, in which the latents generated by the [`StableDiffusionXLPipeline`](https://huggingface.co/docs/diffusers/api/pipelines/stable_diffusion/stable_diffusion_xl) is refined by the corresponding refiner.
{{< cta-button colabLink="https://colab.research.google.com/github/wandb/examples/blob/master/colabs/diffusers/sdxl-diffusers.ipynb" >}}
{{< tabpane text=true >}}
{{% tab header="Python Script" value="script" %}}
```python
import torch
from diffusers import StableDiffusionXLImg2ImgPipeline, StableDiffusionXLPipeline
from wandb.integration.diffusers import autolog
# initialize the SDXL base pipeline
base_pipeline = StableDiffusionXLPipeline.from_pretrained(
"stabilityai/stable-diffusion-xl-base-1.0",
torch_dtype=torch.float16,
variant="fp16",
use_safetensors=True,
)
base_pipeline.enable_model_cpu_offload()
# initialize the SDXL refiner pipeline
refiner_pipeline = StableDiffusionXLImg2ImgPipeline.from_pretrained(
"stabilityai/stable-diffusion-xl-refiner-1.0",
text_encoder_2=base_pipeline.text_encoder_2,
vae=base_pipeline.vae,
torch_dtype=torch.float16,
use_safetensors=True,
variant="fp16",
)
refiner_pipeline.enable_model_cpu_offload()
prompt = "a photo of an astronaut riding a horse on mars"
negative_prompt = "static, frame, painting, illustration, sd character, low quality, low resolution, greyscale, monochrome, nose, cropped, lowres, jpeg artifacts, deformed iris, deformed pupils, bad eyes, semi-realistic worst quality, bad lips, deformed mouth, deformed face, deformed fingers, deformed toes standing still, posing"
# Make the experiment reproducible by controlling randomness.
# The seed would be automatically logged to WandB.
seed = 42
generator_base = torch.Generator(device="cuda").manual_seed(seed)
generator_refiner = torch.Generator(device="cuda").manual_seed(seed)
# Call WandB Autolog for Diffusers. This would automatically log
# the prompts, generated images, pipeline architecture and all
# associated experiment configs to Weights & Biases, thus making your
# image generation experiments easy to reproduce, share and analyze.
autolog(init=dict(project="sdxl"))
# Call the base pipeline to generate the latents
image = base_pipeline(
prompt=prompt,
negative_prompt=negative_prompt,
output_type="latent",
generator=generator_base,
).images[0]
# Call the refiner pipeline to generate the refined image
image = refiner_pipeline(
prompt=prompt,
negative_prompt=negative_prompt,
image=image[None, :],
generator=generator_refiner,
).images[0]
```
{{% /tab %}}
{{% tab header="Notebook" value="notebook" %}}
```python
import torch
from diffusers import StableDiffusionXLImg2ImgPipeline, StableDiffusionXLPipeline
import wandb
from wandb.integration.diffusers import autolog
# initialize the SDXL base pipeline
base_pipeline = StableDiffusionXLPipeline.from_pretrained(
"stabilityai/stable-diffusion-xl-base-1.0",
torch_dtype=torch.float16,
variant="fp16",
use_safetensors=True,
)
base_pipeline.enable_model_cpu_offload()
# initialize the SDXL refiner pipeline
refiner_pipeline = StableDiffusionXLImg2ImgPipeline.from_pretrained(
"stabilityai/stable-diffusion-xl-refiner-1.0",
text_encoder_2=base_pipeline.text_encoder_2,
vae=base_pipeline.vae,
torch_dtype=torch.float16,
use_safetensors=True,
variant="fp16",
)
refiner_pipeline.enable_model_cpu_offload()
prompt = "a photo of an astronaut riding a horse on mars"
negative_prompt = "static, frame, painting, illustration, sd character, low quality, low resolution, greyscale, monochrome, nose, cropped, lowres, jpeg artifacts, deformed iris, deformed pupils, bad eyes, semi-realistic worst quality, bad lips, deformed mouth, deformed face, deformed fingers, deformed toes standing still, posing"
# Make the experiment reproducible by controlling randomness.
# The seed would be automatically logged to WandB.
seed = 42
generator_base = torch.Generator(device="cuda").manual_seed(seed)
generator_refiner = torch.Generator(device="cuda").manual_seed(seed)
# Call WandB Autolog for Diffusers. This would automatically log
# the prompts, generated images, pipeline architecture and all
# associated experiment configs to Weights & Biases, thus making your
# image generation experiments easy to reproduce, share and analyze.
autolog(init=dict(project="sdxl"))
# Call the base pipeline to generate the latents
image = base_pipeline(
prompt=prompt,
negative_prompt=negative_prompt,
output_type="latent",
generator=generator_base,
).images[0]
# Call the refiner pipeline to generate the refined image
image = refiner_pipeline(
prompt=prompt,
negative_prompt=negative_prompt,
image=image[None, :],
generator=generator_refiner,
).images[0]
# Finish the experiment
wandb.finish()
```
{{% /tab %}}
{{< /tabpane >}}
- Example of a Stable Diffisuion XL + Refiner experiment:
{{< img src="/images/integrations/diffusers-autolog-6.gif" alt="An example of how the autolog tracks an Stable Diffusion XL + Refiner experiment" >}}
## More resources
* [A Guide to Prompt Engineering for Stable Diffusion](https://wandb.ai/geekyrakshit/diffusers-prompt-engineering/reports/A-Guide-to-Prompt-Engineering-for-Stable-Diffusion--Vmlldzo1NzY4NzQ3)
* [PIXART-α: A Diffusion Transformer Model for Text-to-Image Generation](https://wandb.ai/geekyrakshit/pixart-alpha/reports/PIXART-A-Diffusion-Transformer-Model-for-Text-to-Image-Generation--Vmlldzo2MTE1NzM3)
# Hugging Face AutoTrain
[Hugging Face AutoTrain](https://huggingface.co/docs/autotrain/index) is a no-code tool for training state-of-the-art models for Natural Language Processing (NLP) tasks, for Computer Vision (CV) tasks, and for Speech tasks and even for Tabular tasks.
[Weights & Biases](http://wandb.com/) is directly integrated into Hugging Face AutoTrain, providing experiment tracking and config management. It's as easy as using a single parameter in the CLI command for your experiments
{{< img src="/images/integrations/hf-autotrain-1.png" alt="An example of logging the metrics of an experiment" >}}
## Install prerequisites
Install `autotrain-advanced` and `wandb`.
{{< tabpane text=true >}}
{{% tab header="Command Line" value="script" %}}
```shell
pip install --upgrade autotrain-advanced wandb
```
{{% /tab %}}
{{% tab header="Notebook" value="notebook" %}}
```notebook
!pip install --upgrade autotrain-advanced wandb
```
{{% /tab %}}
{{< /tabpane >}}
To demonstrate these changes, this page fine-tines an LLM on a math dataset to achieve SoTA result in `pass@1` on the [GSM8k Benchmarks](https://github.com/openai/grade-school-math).
## Prepare the dataset
Hugging Face AutoTrain expects your CSV custom dataset to have a specific format to work properly.
- Your training file must contain a `text` column, which the training uses. For best results, the `text` column's data must conform to the `### Human: Question?### Assistant: Answer.` format. Review a great example in [`timdettmers/openassistant-guanaco`](https://huggingface.co/datasets/timdettmers/openassistant-guanaco).
However, the [MetaMathQA dataset](https://huggingface.co/datasets/meta-math/MetaMathQA) includes the columns `query`, `response`, and `type`. First, pre-process this dataset. Remove the `type` column and combine the content of the `query` and `response` columns into a new `text` column in the `### Human: Query?### Assistant: Response.` format. Training uses the resulting dataset, [`rishiraj/guanaco-style-metamath`](https://huggingface.co/datasets/rishiraj/guanaco-style-metamath).
## Train using `autotrain`
You can start training using the `autotrain` advanced from the command line or a notebook. Use the `--log` argument, or use `--log wandb` to log your results to a [W&B run]({{< relref "/guides/models/track/runs/" >}}).
{{< tabpane text=true >}}
{{% tab header="Command Line" value="script" %}}
```shell
autotrain llm \
--train \
--model HuggingFaceH4/zephyr-7b-alpha \
--project-name zephyr-math \
--log wandb \
--data-path data/ \
--text-column text \
--lr 2e-5 \
--batch-size 4 \
--epochs 3 \
--block-size 1024 \
--warmup-ratio 0.03 \
--lora-r 16 \
--lora-alpha 32 \
--lora-dropout 0.05 \
--weight-decay 0.0 \
--gradient-accumulation 4 \
--logging_steps 10 \
--fp16 \
--use-peft \
--use-int4 \
--merge-adapter \
--push-to-hub \
--token \
--repo-id
```
{{% /tab %}}
{{% tab header="Notebook" value="notebook" %}}
```notebook
# Set hyperparameters
learning_rate = 2e-5
num_epochs = 3
batch_size = 4
block_size = 1024
trainer = "sft"
warmup_ratio = 0.03
weight_decay = 0.
gradient_accumulation = 4
lora_r = 16
lora_alpha = 32
lora_dropout = 0.05
logging_steps = 10
# Run training
!autotrain llm \
--train \
--model "HuggingFaceH4/zephyr-7b-alpha" \
--project-name "zephyr-math" \
--log "wandb" \
--data-path data/ \
--text-column text \
--lr str(learning_rate) \
--batch-size str(batch_size) \
--epochs str(num_epochs) \
--block-size str(block_size) \
--warmup-ratio str(warmup_ratio) \
--lora-r str(lora_r) \
--lora-alpha str(lora_alpha) \
--lora-dropout str(lora_dropout) \
--weight-decay str(weight_decay) \
--gradient-accumulation str(gradient_accumulation) \
--logging-steps str(logging_steps) \
--fp16 \
--use-peft \
--use-int4 \
--merge-adapter \
--push-to-hub \
--token str(hf_token) \
--repo-id "rishiraj/zephyr-math"
```
{{% /tab %}}
{{< /tabpane >}}
{{< img src="/images/integrations/hf-autotrain-2.gif" alt="An example of saving the configs of your experiment." >}}
## More Resources
* [AutoTrain Advanced now supports Experiment Tracking](https://huggingface.co/blog/rishiraj/log-autotrain) by [Rishiraj Acharya](https://huggingface.co/rishiraj).
* [Hugging Face AutoTrain Docs](https://huggingface.co/docs/autotrain/index)
# Hugging Face Accelerate
> Training and inference at scale made simple, efficient and adaptable
Hugging Face Accelerate is a library that enables the same PyTorch code to run across any distributed configuration, to simplify model training and inference at scale.
Accelerate includes a Weights & Biases Tracker which we show how to use below. You can also read more about Accelerate Trackers in **[their docs here](https://huggingface.co/docs/accelerate/main/en/usage_guides/tracking)**
## Start logging with Accelerate
To get started with Accelerate and Weights & Biases you can follow the pseudocode below:
```python
from accelerate import Accelerator
# Tell the Accelerator object to log with wandb
accelerator = Accelerator(log_with="wandb")
# Initialise your wandb run, passing wandb parameters and any config information
accelerator.init_trackers(
project_name="my_project",
config={"dropout": 0.1, "learning_rate": 1e-2}
init_kwargs={"wandb": {"entity": "my-wandb-team"}}
)
...
# Log to wandb by calling `accelerator.log`, `step` is optional
accelerator.log({"train_loss": 1.12, "valid_loss": 0.8}, step=global_step)
# Make sure that the wandb tracker finishes correctly
accelerator.end_training()
```
Explaining more, you need to:
1. Pass `log_with="wandb"` when initialising the Accelerator class
2. Call the [`init_trackers`](https://huggingface.co/docs/accelerate/main/en/package_reference/accelerator#accelerate.Accelerator.init_trackers) method and pass it:
- a project name via `project_name`
- any parameters you want to pass to [`wandb.init`]({{< relref "/ref/python/init" >}}) via a nested dict to `init_kwargs`
- any other experiment config information you want to log to your wandb run, via `config`
3. Use the `.log` method to log to Weigths & Biases; the `step` argument is optional
4. Call `.end_training` when finished training
## Access the W&B tracker
To access the W&B tracker, use the `Accelerator.get_tracker()` method. Pass in the string corresponding to a tracker’s `.name` attribute, which returns the tracker on the `main` process.
```python
wandb_tracker = accelerator.get_tracker("wandb")
```
From there you can interact with wandb’s run object like normal:
```python
wandb_tracker.log_artifact(some_artifact_to_log)
```
{{% alert color="secondary" %}}
Trackers built in Accelerate will automatically execute on the correct process, so if a tracker is only meant to be ran on the main process it will do so automatically.
If you want to truly remove Accelerate’s wrapping entirely, you can achieve the same outcome with:
```python
wandb_tracker = accelerator.get_tracker("wandb", unwrap=True)
with accelerator.on_main_process:
wandb_tracker.log_artifact(some_artifact_to_log)
```
{{% /alert %}}
## Accelerate Articles
Below is an Accelerate article you may enjoy
HuggingFace Accelerate Super Charged With Weights & Biases
* In this article, we'll look at what HuggingFace Accelerate has to offer and how simple it is to perform distributed training and evaluation, while logging results to Weights & Biases
Read the full report [here](https://wandb.ai/gladiator/HF%20Accelerate%20+%20W&B/reports/Hugging-Face-Accelerate-Super-Charged-with-Weights-Biases--VmlldzoyNzk3MDUx?utm_source=docs&utm_medium=docs&utm_campaign=accelerate-docs).
# Hydra
> How to integrate W&B with Hydra.
> [Hydra](https://hydra.cc) is an open-source Python framework that simplifies the development of research and other complex applications. The key feature is the ability to dynamically create a hierarchical configuration by composition and override it through config files and the command line.
You can continue to use Hydra for configuration management while taking advantage of the power of W&B.
## Track metrics
Track your metrics as normal with `wandb.init` and `wandb.log` . Here, `wandb.entity` and `wandb.project` are defined within a hydra configuration file.
```python
import wandb
@hydra.main(config_path="configs/", config_name="defaults")
def run_experiment(cfg):
run = wandb.init(entity=cfg.wandb.entity, project=cfg.wandb.project)
wandb.log({"loss": loss})
```
## Track Hyperparameters
Hydra uses [omegaconf](https://omegaconf.readthedocs.io/en/2.1_branch/) as the default way to interface with configuration dictionaries. `OmegaConf`'s dictionary are not a subclass of primitive dictionaries so directly passing Hydra's `Config` to `wandb.config` leads to unexpected results on the dashboard. It's necessary to convert `omegaconf.DictConfig` to the primitive `dict` type before passing to `wandb.config`.
```python
@hydra.main(config_path="configs/", config_name="defaults")
def run_experiment(cfg):
wandb.config = omegaconf.OmegaConf.to_container(
cfg, resolve=True, throw_on_missing=True
)
wandb.init(entity=cfg.wandb.entity, project=cfg.wandb.project)
wandb.log({"loss": loss})
model = Model(**wandb.config.model.configs)
```
## Troubleshoot multiprocessing
If your process hangs when started, this may be caused by [this known issue]({{< relref "/guides/models/track/log/distributed-training.md" >}}). To solve this, try to changing wandb's multiprocessing protocol either by adding an extra settings parameter to \`wandb.init\` as:
```python
wandb.init(settings=wandb.Settings(start_method="thread"))
```
or by setting a global environment variable from your shell:
```bash
$ export WANDB_START_METHOD=thread
```
## Optimize Hyperparameters
[W&B Sweeps]({{< relref "/guides/models/sweeps/" >}}) is a highly scalable hyperparameter search platform, which provides interesting insights and visualization about W&B experiments with minimal requirements code real-estate. Sweeps integrates seamlessly with Hydra projects with no-coding requirements. The only thing needed is a configuration file describing the various parameters to sweep over as normal.
A simple example `sweep.yaml` file would be:
```yaml
program: main.py
method: bayes
metric:
goal: maximize
name: test/accuracy
parameters:
dataset:
values: [mnist, cifar10]
command:
- ${env}
- python
- ${program}
- ${args_no_hyphens}
```
Invoke the sweep:
``` bash
wandb sweep sweep.yaml` \
```
W&B automatically creates a sweep inside your project and returns a `wandb agent` command for you to run on each machine you want to run your sweep.
### Pass parameters not present in Hydra defaults
Hydra supports passing extra parameters through the command line which aren't present in the default configuration file, by using a `+` before command. For example, you can pass an extra parameter with some value by simply calling:
```bash
$ python program.py +experiment=some_experiment
```
You cannot sweep over such `+` configurations similar to what one does while configuring [Hydra Experiments](https://hydra.cc/docs/patterns/configuring_experiments/). To work around this, you can initialize the experiment parameter with a default empty file and use W&B Sweep to override those empty configs on each call. For more information, read [**this W&B Report**](http://wandb.me/hydra)**.**
# Keras
{{< cta-button colabLink="https://colab.research.google.com/github/wandb/examples/blob/master/colabs/intro/Intro_to_Weights_%26_Biases_keras.ipynb" >}}
## Keras callbacks
W&B has three callbacks for Keras, available from `wandb` v0.13.4. For the legacy `WandbCallback` scroll down.
- **`WandbMetricsLogger`** : Use this callback for [Experiment Tracking]({{< relref "/guides/models/track" >}}). It logs your training and validation metrics along with system metrics to Weights and Biases.
- **`WandbModelCheckpoint`** : Use this callback to log your model checkpoints to Weight and Biases [Artifacts]({{< relref "/guides/core/artifacts/" >}}).
- **`WandbEvalCallback`**: This base callback logs model predictions to Weights and Biases [Tables]({{< relref "/guides/models/tables/" >}}) for interactive visualization.
These new callbacks:
* Adhere to Keras design philosophy.
* Reduce the cognitive load of using a single callback (`WandbCallback`) for everything.
* Make it easy for Keras users to modify the callback by subclassing it to support their niche use case.
## Track experiments with `WandbMetricsLogger`
{{< cta-button colabLink="https://github.com/wandb/examples/blob/master/colabs/keras/Use_WandbMetricLogger_in_your_Keras_workflow.ipynb" >}}
`WandbMetricsLogger` automatically logs Keras' `logs` dictionary that callback methods such as `on_epoch_end`, `on_batch_end` etc, take as an argument.
This tracks:
* Training and validation metrics defined in `model.compile`.
* System (CPU/GPU/TPU) metrics.
* Learning rate (both for a fixed value or a learning rate scheduler.
```python
import wandb
from wandb.integration.keras import WandbMetricsLogger
# Initialize a new W&B run
wandb.init(config={"bs": 12})
# Pass the WandbMetricsLogger to model.fit
model.fit(
X_train, y_train, validation_data=(X_test, y_test), callbacks=[WandbMetricsLogger()]
)
```
### `WandbMetricsLogger` reference
| Parameter | Description |
| --------------------- | --------------------------------------------------------------------------------------------------------------------------------- |
| `log_freq` | (`epoch`, `batch`, or an `int`): if `epoch`, logs metrics at the end of each epoch. If `batch`, logs metrics at the end of each batch. If an `int`, logs metrics at the end of that many batches. Defaults to `epoch`. |
| `initial_global_step` | (int): Use this argument to correctly log the learning rate when you resume training from some initial_epoch, and a learning rate scheduler is used. This can be computed as step_size * initial_step. Defaults to 0. |
## Checkpoint a model using `WandbModelCheckpoint`
{{< cta-button colabLink="https://github.com/wandb/examples/blob/master/colabs/keras/Use_WandbModelCheckpoint_in_your_Keras_workflow.ipynb" >}}
Use `WandbModelCheckpoint` callback to save the Keras model (`SavedModel` format) or model weights periodically and uploads them to W&B as a `wandb.Artifact` for model versioning.
This callback is subclassed from [`tf.keras.callbacks.ModelCheckpoint`](https://www.tensorflow.org/api_docs/python/tf/keras/callbacks/ModelCheckpoint) ,thus the checkpointing logic is taken care of by the parent callback.
This callback saves:
* The model that has achieved best performance based on the monitor.
* The model at the end of every epoch regardless of the performance.
* The model at the end of the epoch or after a fixed number of training batches.
* Only model weights or the whole model.
* The model either in `SavedModel` format or in `.h5` format.
Use this callback in conjunction with `WandbMetricsLogger`.
```python
import wandb
from wandb.integration.keras import WandbMetricsLogger, WandbModelCheckpoint
# Initialize a new W&B run
wandb.init(config={"bs": 12})
# Pass the WandbModelCheckpoint to model.fit
model.fit(
X_train,
y_train,
validation_data=(X_test, y_test),
callbacks=[
WandbMetricsLogger(),
WandbModelCheckpoint("models"),
],
)
```
### `WandbModelCheckpoint` reference
| Parameter | Description |
| ------------------------- | ---- |
| `filepath` | (str): path to save the mode file.|
| `monitor` | (str): The metric name to monitor. |
| `verbose` | (int): Verbosity mode, 0 or 1. Mode 0 is silent, and mode 1 displays messages when the callback takes an action. |
| `save_best_only` | (Boolean): if `save_best_only=True`, it only saves the latest model or the model it considers the best, according to the defined by the `monitor` and `mode` attributes. |
| `save_weights_only` | (Boolean): if True, saves only the model's weights. |
| `mode` | (`auto`, `min`, or `max`): For `val_acc`, set it to `max`, for `val_loss`, set it to `min`, and so on | |
| `save_freq` | ("epoch" or int): When using ‘epoch’, the callback saves the model after each epoch. When using an integer, the callback saves the model at end of this many batches. Note that when monitoring validation metrics such as `val_acc` or `val_loss`, `save_freq` must be set to "epoch" as those metrics are only available at the end of an epoch. |
| `options` | (str): Optional `tf.train.CheckpointOptions` object if `save_weights_only` is true or optional `tf.saved_model.SaveOptions` object if `save_weights_only` is false. |
| `initial_value_threshold` | (float): Floating point initial "best" value of the metric to be monitored. |
### Log checkpoints after N epochs
By default (`save_freq="epoch"`), the callback creates a checkpoint and uploads it as an artifact after each epoch. To create a checkpoint after a specific number of batches, set `save_freq` to an integer. To checkpoint after `N` epochs, compute the cardinality of the `train` dataloader and pass it to `save_freq`:
```python
WandbModelCheckpoint(
filepath="models/",
save_freq=int((trainloader.cardinality()*N).numpy())
)
```
### Efficiently log checkpoints on a TPU architecture
While checkpointing on TPUs you might encounter `UnimplementedError: File system scheme '[local]' not implemented` error message. This happens because the model directory (`filepath`) must use a cloud storage bucket path (`gs://bucket-name/...`), and this bucket must be accessible from the TPU server. We can however, use the local path for checkpointing which in turn is uploaded as an Artifacts.
```python
checkpoint_options = tf.saved_model.SaveOptions(experimental_io_device="/job:localhost")
WandbModelCheckpoint(
filepath="models/,
options=checkpoint_options,
)
```
## Visualize model predictions using `WandbEvalCallback`
{{< cta-button colabLink="https://github.com/wandb/examples/blob/e66f16fbe7ae7a2e636d59350a50059d3f7e5494/colabs/keras/Use_WandbEvalCallback_in_your_Keras_workflow.ipynb" >}}
The `WandbEvalCallback` is an abstract base class to build Keras callbacks primarily for model prediction and, secondarily, dataset visualization.
This abstract callback is agnostic with respect to the dataset and the task. To use this, inherit from this base `WandbEvalCallback` callback class and implement the `add_ground_truth` and `add_model_prediction` methods.
The `WandbEvalCallback` is a utility class that provides methods to:
* Create data and prediction `wandb.Table` instances.
* Log data and prediction Tables as `wandb.Artifact`.
* Log the data table `on_train_begin`.
* log the prediction table `on_epoch_end`.
The following example uses `WandbClfEvalCallback` for an image classification task. This example callback logs the validation data (`data_table`) to W&B, performs inference, and logs the prediction (`pred_table`) to W&B at the end of every epoch.
```python
import wandb
from wandb.integration.keras import WandbMetricsLogger, WandbEvalCallback
# Implement your model prediction visualization callback
class WandbClfEvalCallback(WandbEvalCallback):
def __init__(
self, validation_data, data_table_columns, pred_table_columns, num_samples=100
):
super().__init__(data_table_columns, pred_table_columns)
self.x = validation_data[0]
self.y = validation_data[1]
def add_ground_truth(self, logs=None):
for idx, (image, label) in enumerate(zip(self.x, self.y)):
self.data_table.add_data(idx, wandb.Image(image), label)
def add_model_predictions(self, epoch, logs=None):
preds = self.model.predict(self.x, verbose=0)
preds = tf.argmax(preds, axis=-1)
table_idxs = self.data_table_ref.get_index()
for idx in table_idxs:
pred = preds[idx]
self.pred_table.add_data(
epoch,
self.data_table_ref.data[idx][0],
self.data_table_ref.data[idx][1],
self.data_table_ref.data[idx][2],
pred,
)
# ...
# Initialize a new W&B run
wandb.init(config={"hyper": "parameter"})
# Add the Callbacks to Model.fit
model.fit(
X_train,
y_train,
validation_data=(X_test, y_test),
callbacks=[
WandbMetricsLogger(),
WandbClfEvalCallback(
validation_data=(X_test, y_test),
data_table_columns=["idx", "image", "label"],
pred_table_columns=["epoch", "idx", "image", "label", "pred"],
),
],
)
```
{{% alert %}}
The W&B [Artifact page]({{< relref "/guides/core/artifacts/explore-and-traverse-an-artifact-graph" >}}) includes Table logs by default, rather than the **Workspace** page.
{{% /alert %}}
### `WandbEvalCallback` reference
| Parameter | Description |
| -------------------- | ------------------------------------------------ |
| `data_table_columns` | (list) List of column names for the `data_table` |
| `pred_table_columns` | (list) List of column names for the `pred_table` |
### Memory footprint details
We log the `data_table` to W&B when the `on_train_begin` method is invoked. Once it's uploaded as a W&B Artifact, we get a reference to this table which can be accessed using `data_table_ref` class variable. The `data_table_ref` is a 2D list that can be indexed like `self.data_table_ref[idx][n]`, where `idx` is the row number while `n` is the column number. Let's see the usage in the example below.
### Customize the callback
You can override the `on_train_begin` or `on_epoch_end` methods to have more fine-grained control. If you want to log the samples after `N` batches, you can implement `on_train_batch_end` method.
{{% alert %}}
💡 If you are implementing a callback for model prediction visualization by inheriting `WandbEvalCallback` and something needs to be clarified or fixed, please let us know by opening an [issue](https://github.com/wandb/wandb/issues).
{{% /alert %}}
## `WandbCallback` [legacy]
Use the W&B library [`WandbCallback`]({{< relref "/ref/python/integrations/keras/wandbcallback" >}}) Class to automatically save all the metrics and the loss values tracked in `model.fit`.
```python
import wandb
from wandb.integration.keras import WandbCallback
wandb.init(config={"hyper": "parameter"})
... # code to set up your model in Keras
# Pass the callback to model.fit
model.fit(
X_train, y_train, validation_data=(X_test, y_test), callbacks=[WandbCallback()]
)
```
You can watch the short video [Get Started with Keras and Weights & Biases in Less Than a Minute](https://www.youtube.com/watch?ab_channel=Weights&Biases&v=4FjDIJ-vO_M).
For a more detailed video, watch [Integrate Weights & Biases with Keras](https://www.youtube.com/watch?v=Bsudo7jbMow\&ab_channel=Weights%26Biases). You can review the [Colab Jupyter Notebook](https://colab.research.google.com/github/wandb/examples/blob/master/colabs/keras/Keras_pipeline_with_Weights_and_Biases.ipynb).
{{% alert %}}
See our [example repo](https://github.com/wandb/examples) for scripts, including a [Fashion MNIST example](https://github.com/wandb/examples/blob/master/examples/keras/keras-cnn-fashion/train.py) and the [W&B Dashboard](https://wandb.ai/wandb/keras-fashion-mnist/runs/5z1d85qs) it generates.
{{% /alert %}}
The `WandbCallback` class supports a wide variety of logging configuration options: specifying a metric to monitor, tracking of weights and gradients, logging of predictions on training_data and validation_data, and more.
Check out [the reference documentation for the `keras.WandbCallback`]({{< relref "/ref/python/integrations/keras/wandbcallback.md" >}}) for full details.
The `WandbCallback`
* Automatically logs history data from any metrics collected by Keras: loss and anything passed into `keras_model.compile()`.
* Sets summary metrics for the run associated with the "best" training step, as defined by the `monitor` and `mode` attributes. This defaults to the epoch with the minimum `val_loss`. `WandbCallback` by default saves the model associated with the best `epoch`.
* Optionally logs gradient and parameter histogram.
* Optionally saves training and validation data for wandb to visualize.
### `WandbCallback` reference
| Arguments | |
| -------------------------- | ------------------------------------------- |
| `monitor` | (str) name of metric to monitor. Defaults to `val_loss`. |
| `mode` | (str) one of {`auto`, `min`, `max`}. `min` - save model when monitor is minimized `max` - save model when monitor is maximized `auto` - try to guess when to save the model (default). |
| `save_model` | True - save a model when monitor beats all previous epochs False - don't save models |
| `save_graph` | (boolean) if True save model graph to wandb (default to True). |
| `save_weights_only` | (boolean) if True, saves only the model's weights(`model.save_weights(filepath)`). Otherwise, saves the full model). |
| `log_weights` | (boolean) if True save histograms of the model's layer's weights. |
| `log_gradients` | (boolean) if True log histograms of the training gradients |
| `training_data` | (tuple) Same format `(X,y)` as passed to `model.fit`. This is needed for calculating gradients - this is mandatory if `log_gradients` is `True`. |
| `validation_data` | (tuple) Same format `(X,y)` as passed to `model.fit`. A set of data for wandb to visualize. If you set this field, every epoch, wandb makes a small number of predictions and saves the results for later visualization. |
| `generator` | (generator) a generator that returns validation data for wandb to visualize. This generator should return tuples `(X,y)`. Either `validate_data` or generator should be set for wandb to visualize specific data examples. |
| `validation_steps` | (int) if `validation_data` is a generator, how many steps to run the generator for the full validation set. |
| `labels` | (list) If you are visualizing your data with wandb this list of labels converts numeric output to understandable string if you are building a classifier with multiple classes. For a binary classifier, you can pass in a list of two labels \[`label for false`, `label for true`]. If `validate_data` and `generator` are both false, this does nothing. |
| `predictions` | (int) the number of predictions to make for visualization each epoch, max is 100. |
| `input_type` | (string) type of the model input to help visualization. can be one of: (`image`, `images`, `segmentation_mask`). |
| `output_type` | (string) type of the model output to help visualziation. can be one of: (`image`, `images`, `segmentation_mask`). |
| `log_evaluation` | (boolean) if True, save a Table containing validation data and the model's predictions at each epoch. See `validation_indexes`, `validation_row_processor`, and `output_row_processor` for additional details. |
| `class_colors` | (\[float, float, float]) if the input or output is a segmentation mask, an array containing an rgb tuple (range 0-1) for each class. |
| `log_batch_frequency` | (integer) if None, callback logs every epoch. If set to integer, callback logs training metrics every `log_batch_frequency` batches. |
| `log_best_prefix` | (string) if None, saves no extra summary metrics. If set to a string, prepends the monitored metric and epoch with the prefix and saves the results as summary metrics. |
| `validation_indexes` | (\[wandb.data_types._TableLinkMixin]) an ordered list of index keys to associate with each validation example. If `log_evaluation` is True and you provide `validation_indexes`, does not create a Table of validation data. Instead, associates each prediction with the row represented by the `TableLinkMixin`. To obtain a list of row keys, use `Table.get_index() `. |
| `validation_row_processor` | (Callable) a function to apply to the validation data, commonly used to visualize the data. The function receives an `ndx` (int) and a `row` (dict). If your model has a single input, then `row["input"]` contains the input data for the row. Otherwise, it contains the names of the input slots. If your fit function takes a single target, then `row["target"]` contains the target data for the row. Otherwise, it contains the names of the output slots. For example, if your input data is a single array, to visualize the data as an Image, provide `lambda ndx, row: {"img": wandb.Image(row["input"])}` as the processor. Ignored if `log_evaluation` is False or `validation_indexes` are present. |
| `output_row_processor` | (Callable) same as `validation_row_processor`, but applied to the model's output. `row["output"]` contains the results of the model output. |
| `infer_missing_processors` | (Boolean) Determines whether to infer `validation_row_processor` and `output_row_processor` if they are missing. Defaults to True. If you provide `labels`, W&B attempts to infer classification-type processors where appropriate. |
| `log_evaluation_frequency` | (int) Determines how often to log evaluation results. Defaults to `0` to log only at the end of training. Set to 1 to log every epoch, 2 to log every other epoch, and so on. Has no effect when `log_evaluation` is False. |
## Frequently Asked Questions
### How do I use `Keras` multiprocessing with `wandb`?
When setting `use_multiprocessing=True`, this error may occur:
```python
Error("You must call wandb.init() before wandb.config.batch_size")
```
To work around it:
1. In the `Sequence` class construction, add: `wandb.init(group='...')`.
2. In `main`, make sure you're using `if __name__ == "__main__":` and put the rest of your script logic inside it.
# Kubeflow Pipelines (kfp)
> How to integrate W&B with Kubeflow Pipelines.
[Kubeflow Pipelines (kfp) ](https://www.kubeflow.org/docs/components/pipelines/overview/)is a platform for building and deploying portable, scalable machine learning (ML) workflows based on Docker containers.
This integration lets users apply decorators to kfp python functional components to automatically log parameters and artifacts to W&B.
This feature was enabled in `wandb==0.12.11` and requires `kfp<2.0.0`
## Sign up and create an API key
An API key authenticates your machine to W&B. You can generate an API key from your user profile.
{{% alert %}}
For a more streamlined approach, you can generate an API key by going directly to [https://wandb.ai/authorize](https://wandb.ai/authorize). Copy the displayed API key and save it in a secure location such as a password manager.
{{% /alert %}}
1. Click your user profile icon in the upper right corner.
1. Select **User Settings**, then scroll to the **API Keys** section.
1. Click **Reveal**. Copy the displayed API key. To hide the API key, reload the page.
## Install the `wandb` library and log in
To install the `wandb` library locally and log in:
{{< tabpane text=true >}}
{{% tab header="Command Line" value="cli" %}}
1. Set the `WANDB_API_KEY` [environment variable]({{< relref "/guides/models/track/environment-variables.md" >}}) to your API key.
```bash
export WANDB_API_KEY=
```
1. Install the `wandb` library and log in.
```shell
pip install wandb
wandb login
```
{{% /tab %}}
{{% tab header="Python" value="python" %}}
```bash
pip install wandb
```
```python
import wandb
wandb.login()
```
{{% /tab %}}
{{% tab header="Python notebook" value="notebook" %}}
```notebook
!pip install wandb
import wandb
wandb.login()
```
{{% /tab %}}
{{< /tabpane >}}
## Decorate your components
Add the `@wandb_log` decorator and create your components as usual. This will automatically log the input/outputs parameters and artifacts to W&B each time you run your pipeline.
```python
from kfp import components
from wandb.integration.kfp import wandb_log
@wandb_log
def add(a: float, b: float) -> float:
return a + b
add = components.create_component_from_func(add)
```
## Pass environment variables to containers
You may need to explicitly pass [environment variables]({{< relref "/guides/models/track/environment-variables.md" >}}) to your containers. For two-way linking, you should also set the environment variables `WANDB_KUBEFLOW_URL` to the base URL of your Kubeflow Pipelines instance. For example, `https://kubeflow.mysite.com`.
```python
import os
from kubernetes.client.models import V1EnvVar
def add_wandb_env_variables(op):
env = {
"WANDB_API_KEY": os.getenv("WANDB_API_KEY"),
"WANDB_BASE_URL": os.getenv("WANDB_BASE_URL"),
}
for name, value in env.items():
op = op.add_env_variable(V1EnvVar(name, value))
return op
@dsl.pipeline(name="example-pipeline")
def example_pipeline(param1: str, param2: int):
conf = dsl.get_pipeline_conf()
conf.add_op_transformer(add_wandb_env_variables)
```
## Access your data programmatically
### Via the Kubeflow Pipelines UI
Click on any Run in the Kubeflow Pipelines UI that has been logged with W&B.
* Find details about inputs and outputs in the `Input/Output` and `ML Metadata` tabs.
* View the W&B web app from the `Visualizations` tab.
{{< img src="/images/integrations/kubeflow_app_pipelines_ui.png" alt="Get a view of W&B in the Kubeflow UI" >}}
### Via the web app UI
The web app UI has the same content as the `Visualizations` tab in Kubeflow Pipelines, but with more space. Learn [more about the web app UI here]({{< relref "/guides/models/app" >}}).
{{< img src="/images/integrations/kubeflow_pipelines.png" alt="View details about a particular run (and link back to the Kubeflow UI)" >}}
{{< img src="/images/integrations/kubeflow_via_app.png" alt="See the full DAG of inputs and outputs at each stage of your pipeline" >}}
### Via the Public API (for programmatic access)
* For programmatic access, [see our Public API]({{< relref "/ref/python/public-api" >}}).
### Concept mapping from Kubeflow Pipelines to W&B
Here's a mapping of Kubeflow Pipelines concepts to W&B
| Kubeflow Pipelines | W&B | Location in W&B |
| ------------------ | --- | --------------- |
| Input Scalar | [`config`]({{< relref "/guides/models/track/config" >}}) | [Overview tab]({{< relref "/guides/models/track/runs/#overview-tab" >}}) |
| Output Scalar | [`summary`]({{< relref "/guides/models/track/log" >}}) | [Overview tab]({{< relref "/guides/models/track/runs/#overview-tab" >}}) |
| Input Artifact | Input Artifact | [Artifacts tab]({{< relref "/guides/models/track/runs/#artifacts-tab" >}}) |
| Output Artifact | Output Artifact | [Artifacts tab]({{< relref "/guides/models/track/runs/#artifacts-tab" >}}) |
## Fine-grain logging
If you want finer control of logging, you can sprinkle in `wandb.log` and `wandb.log_artifact` calls in the component.
### With explicit `wandb.log_artifacts` calls
In this example below, we are training a model. The `@wandb_log` decorator will automatically track the relevant inputs and outputs. If you want to log the training process, you can explicitly add that logging like so:
```python
@wandb_log
def train_model(
train_dataloader_path: components.InputPath("dataloader"),
test_dataloader_path: components.InputPath("dataloader"),
model_path: components.OutputPath("pytorch_model"),
):
...
for epoch in epochs:
for batch_idx, (data, target) in enumerate(train_dataloader):
...
if batch_idx % log_interval == 0:
wandb.log(
{"epoch": epoch, "step": batch_idx * len(data), "loss": loss.item()}
)
...
wandb.log_artifact(model_artifact)
```
### With implicit wandb integrations
If you're using a [framework integration we support]({{< relref "/guides/integrations/" >}}), you can also pass in the callback directly:
```python
@wandb_log
def train_model(
train_dataloader_path: components.InputPath("dataloader"),
test_dataloader_path: components.InputPath("dataloader"),
model_path: components.OutputPath("pytorch_model"),
):
from pytorch_lightning.loggers import WandbLogger
from pytorch_lightning import Trainer
trainer = Trainer(logger=WandbLogger())
... # do training
```
# LightGBM
> Track your trees with W&B.
{{< cta-button colabLink="https://colab.research.google.com/github/wandb/examples/blob/master/colabs/boosting/Simple_LightGBM_Integration.ipynb" >}}
The `wandb` library includes a special callback for [LightGBM](https://lightgbm.readthedocs.io/en/latest/). It's also easy to use the generic logging features of Weights & Biases to track large experiments, like hyperparameter sweeps.
```python
from wandb.integration.lightgbm import wandb_callback, log_summary
import lightgbm as lgb
# Log metrics to W&B
gbm = lgb.train(..., callbacks=[wandb_callback()])
# Log feature importance plot and upload model checkpoint to W&B
log_summary(gbm, save_model_checkpoint=True)
```
{{% alert %}}
Looking for working code examples? Check out [our repository of examples on GitHub](https://github.com/wandb/examples/tree/master/examples/boosting-algorithms).
{{% /alert %}}
## Tuning your hyperparameters with Sweeps
Attaining the maximum performance out of models requires tuning hyperparameters, like tree depth and learning rate. Weights & Biases includes [Sweeps]({{< relref "/guides/models/sweeps/" >}}), a powerful toolkit for configuring, orchestrating, and analyzing large hyperparameter testing experiments.
To learn more about these tools and see an example of how to use Sweeps with XGBoost, check out this interactive Colab notebook.
{{< cta-button colabLink="https://colab.research.google.com/github/wandb/examples/blob/master/colabs/boosting/Using_W%26B_Sweeps_with_XGBoost.ipynb" >}}
{{< img src="/images/integrations/lightgbm_sweeps.png" alt="Summary: trees outperform linear learners on this classification dataset." >}}
# Metaflow
> How to integrate W&B with Metaflow.
## Overview
[Metaflow](https://docs.metaflow.org) is a framework created by [Netflix](https://netflixtechblog.com) for creating and running ML workflows.
This integration lets users apply decorators to Metaflow [steps and flows](https://docs.metaflow.org/metaflow/basics) to automatically log parameters and artifacts to W&B.
* Decorating a step will turn logging off or on for certain types within that step.
* Decorating the flow will turn logging off or on for every step in the flow.
## Quickstart
### Sign up and create an API key
An API key authenticates your machine to W&B. You can generate an API key from your user profile.
{{% alert %}}
For a more streamlined approach, you can generate an API key by going directly to [https://wandb.ai/authorize](https://wandb.ai/authorize). Copy the displayed API key and save it in a secure location such as a password manager.
{{% /alert %}}
1. Click your user profile icon in the upper right corner.
1. Select **User Settings**, then scroll to the **API Keys** section.
1. Click **Reveal**. Copy the displayed API key. To hide the API key, reload the page.
### Install the `wandb` library and log in
To install the `wandb` library locally and log in:
{{% alert %}}
For `wandb` version 0.19.8 or below, install `fastcore` version 1.8.0 or below (`fastcore<1.8.0`) instead of `plum-dispatch`.
{{% /alert %}}
{{< tabpane text=true >}}
{{% tab header="Command Line" value="cli" %}}
1. Set the `WANDB_API_KEY` [environment variable]({{< relref "/guides/models/track/environment-variables.md" >}}) to your API key.
```bash
export WANDB_API_KEY=
```
1. Install the `wandb` library and log in.
```shell
pip install -Uqqq metaflow "plum-dispatch<3.0.0" wandb
wandb login
```
{{% /tab %}}
{{% tab header="Python" value="python" %}}
```bash
pip install -Uqqq metaflow "plum-dispatch<3.0.0" wandb
```
```python
import wandb
wandb.login()
```
{{% /tab %}}
{{% tab header="Python notebook" value="notebook" %}}
```notebook
!pip install -Uqqq metaflow "plum-dispatch<3.0.0" wandb
import wandb
wandb.login()
```
{{% /tab %}}
{{< /tabpane >}}
### Decorate your flows and steps
{{< tabpane text=true >}}
{{% tab header="Step" value="step" %}}
Decorating a step turns logging off or on for certain types within that step.
In this example, all datasets and models in `start` will be logged
```python
from wandb.integration.metaflow import wandb_log
class WandbExampleFlow(FlowSpec):
@wandb_log(datasets=True, models=True, settings=wandb.Settings(...))
@step
def start(self):
self.raw_df = pd.read_csv(...). # pd.DataFrame -> upload as dataset
self.model_file = torch.load(...) # nn.Module -> upload as model
self.next(self.transform)
```
{{% /tab %}}
{{% tab header="Flow" value="flow" %}}
Decorating a flow is equivalent to decorating all the constituent steps with a default.
In this case, all steps in `WandbExampleFlow` default to logging datasets and models by default, just like decorating each step with `@wandb_log(datasets=True, models=True)`
```python
from wandb.integration.metaflow import wandb_log
@wandb_log(datasets=True, models=True) # decorate all @step
class WandbExampleFlow(FlowSpec):
@step
def start(self):
self.raw_df = pd.read_csv(...). # pd.DataFrame -> upload as dataset
self.model_file = torch.load(...) # nn.Module -> upload as model
self.next(self.transform)
```
{{% /tab %}}
{{% tab header="Flow and Steps" value="flow_and_steps" %}}
Decorating the flow is equivalent to decorating all steps with a default. That means if you later decorate a Step with another `@wandb_log`, it overrides the flow-level decoration.
In this example:
* `start` and `mid` log both datasets and models.
* `end` logs neither datasets nor models.
```python
from wandb.integration.metaflow import wandb_log
@wandb_log(datasets=True, models=True) # same as decorating start and mid
class WandbExampleFlow(FlowSpec):
# this step will log datasets and models
@step
def start(self):
self.raw_df = pd.read_csv(...). # pd.DataFrame -> upload as dataset
self.model_file = torch.load(...) # nn.Module -> upload as model
self.next(self.mid)
# this step will also log datasets and models
@step
def mid(self):
self.raw_df = pd.read_csv(...). # pd.DataFrame -> upload as dataset
self.model_file = torch.load(...) # nn.Module -> upload as model
self.next(self.end)
# this step is overwritten and will NOT log datasets OR models
@wandb_log(datasets=False, models=False)
@step
def end(self):
self.raw_df = pd.read_csv(...).
self.model_file = torch.load(...)
```
{{% /tab %}}
{{< /tabpane >}}
## Access your data programmatically
You can access the information we've captured in three ways: inside the original Python process being logged using the [`wandb` client library]({{< relref "/ref/python/" >}}), with the [web app UI]({{< relref "/guides/models/track/workspaces.md" >}}), or programmatically using [our Public API]({{< relref "/ref/python/public-api/" >}}). `Parameter`s are saved to W&B's [`config`]({{< relref "/guides/models/track/config.md" >}}) and can be found in the [Overview tab]({{< relref "/guides/models/track/runs/#overview-tab" >}}). `datasets`, `models`, and `others` are saved to [W&B Artifacts]({{< relref "/guides/core/artifacts/" >}}) and can be found in the [Artifacts tab]({{< relref "/guides/models/track/runs/#artifacts-tab" >}}). Base python types are saved to W&B's [`summary`]({{< relref "/guides/models/track/log/" >}}) dict and can be found in the Overview tab. See our [guide to the Public API]({{< relref "/guides/models/track/public-api-guide.md" >}}) for details on using the API to get this information programmatically from outside .
### Quick reference
| Data | Client library | UI |
| ----------------------------------------------- | ----------------------------------------- | --------------------- |
| `Parameter(...)` | `wandb.config` | Overview tab, Config |
| `datasets`, `models`, `others` | `wandb.use_artifact("{var_name}:latest")` | Artifacts tab |
| Base Python types (`dict`, `list`, `str`, etc.) | `wandb.summary` | Overview tab, Summary |
### `wandb_log` kwargs
| kwarg | Options |
| ---------- | --------------------------------------------------------------------------------------------------------------------------------------------------------------------------------------------------------------------------------------------------------------------------------------------------------------------------------------------------------------------------------------------------------------------------------------------------------------------------------- |
| `datasets` |
True: Log instance variables that are a dataset
False
|
| `models` |
True: Log instance variables that are a model
False
|
| `others` |
True: Log anything else that is serializable as a pickle
False
|
| `settings` |
wandb.Settings(...): Specify your own wandb settings for this step or flow
None: Equivalent to passing wandb.Settings()
By default, if:
settings.run_group is None, it will be set to \{flow_name\}/\{run_id\}
settings.run_job_type is None, it will be set to \{run_job_type\}/\{step_name\}
|
## Frequently Asked Questions
### What exactly do you log? Do you log all instance and local variables?
`wandb_log` only logs instance variables. Local variables are NEVER logged. This is useful to avoid logging unnecessary data.
### Which data types get logged?
We currently support these types:
| Logging Setting | Type |
| ------------------- | --------------------------------------------------------------------------------------------------------------------------- |
| default (always on) |
dict, list, set, str, int, float, bool
|
| `datasets` |
pd.DataFrame
pathlib.Path
|
| `models` |
nn.Module
sklearn.base.BaseEstimator
|
| `others` |
Anything that is pickle-able and JSON serializable
|
### How can I configure logging behavior?
| Kind of Variable | behavior | Example | Data Type |
| ---------------- | ------------------------------ | --------------- | -------------- |
| Instance | Auto-logged | `self.accuracy` | `float` |
| Instance | Logged if `datasets=True` | `self.df` | `pd.DataFrame` |
| Instance | Not logged if `datasets=False` | `self.df` | `pd.DataFrame` |
| Local | Never logged | `accuracy` | `float` |
| Local | Never logged | `df` | `pd.DataFrame` |
### Is artifact lineage tracked?
Yes. If you have an artifact that is an output of step A and an input to step B, we automatically construct the lineage DAG for you.
For an example of this behavior, please see this[ notebook](https://colab.research.google.com/drive/1wZG-jYzPelk8Rs2gIM3a71uEoG46u_nG#scrollTo=DQQVaKS0TmDU) and its corresponding [W&B Artifacts page](https://wandb.ai/megatruong/metaflow_integration/artifacts/dataset/raw_df/7d14e6578d3f1cfc72fe/graph)
# MMEngine
MMEngine by [OpenMMLab](https://github.com/open-mmlab) is a foundational library for training deep learning models based on PyTorch. MMEngine implements a next-generation training architecture for the OpenMMLab algorithm library, providing a unified execution foundation for over 30 algorithm libraries within OpenMMLab. Its core components include the training engine, evaluation engine, and module management.
[Weights and Biases](https://wandb.ai/site) is directly integrated into MMEngine through a dedicated [`WandbVisBackend`](https://mmengine.readthedocs.io/en/latest/api/generated/mmengine.visualization.WandbVisBackend.html#mmengine.visualization.WandbVisBackend) that can be used to
- log training and evaluation metrics.
- log and manage experiment configs.
- log additional records such as graph, images, scalars, etc.
## Get started
Install `openmim` and `wandb`.
{{< tabpane text=true >}}
{{% tab header="Command Line" value="script" %}}
``` bash
pip install -q -U openmim wandb
```
{{% /tab %}}
{{% tab header="Notebook" value="notebook" %}}
``` bash
!pip install -q -U openmim wandb
```
{{% /tab %}}
{{< /tabpane >}}
Next, install `mmengine` and `mmcv` using `mim`.
{{< tabpane text=true >}}
{{% tab header="Command Line" value="script" %}}
``` bash
mim install -q mmengine mmcv
```
{{% /tab %}}
{{% tab header="Notebook" value="notebook" %}}
``` bash
!mim install -q mmengine mmcv
```
{{% /tab %}}
{{< /tabpane >}}
## Use the `WandbVisBackend` with MMEngine Runner
This section demonstrates a typical workflow using `WandbVisBackend` using [`mmengine.runner.Runner`](https://mmengine.readthedocs.io/en/latest/api/generated/mmengine.runner.Runner.html#mmengine.runner.Runner).
1. Define a `visualizer` from a visualization config.
```python
from mmengine.visualization import Visualizer
# define the visualization configs
visualization_cfg = dict(
name="wandb_visualizer",
vis_backends=[
dict(
type='WandbVisBackend',
init_kwargs=dict(project="mmengine"),
)
],
save_dir="runs/wandb"
)
# get the visualizer from the visualization configs
visualizer = Visualizer.get_instance(**visualization_cfg)
```
{{% alert %}}
You pass a dictionary of arguments for [W&B run initialization]({{< relref "/ref/python/init" >}}) input parameters to `init_kwargs`.
{{% /alert %}}
2. Initialize a `runner` with the `visualizer`, and call `runner.train()`.
```python
from mmengine.runner import Runner
# build the mmengine Runner which is a training helper for PyTorch
runner = Runner(
model,
work_dir='runs/gan/',
train_dataloader=train_dataloader,
train_cfg=train_cfg,
optim_wrapper=opt_wrapper_dict,
visualizer=visualizer, # pass the visualizer
)
# start training
runner.train()
```
## Use the `WandbVisBackend` with OpenMMLab computer vision libraries
The `WandbVisBackend` can also be used easily to track experiments with OpenMMLab computer vision libraries such as [MMDetection](https://mmdetection.readthedocs.io/).
```python
# inherit base configs from the default runtime configs
_base_ = ["../_base_/default_runtime.py"]
# Assign the `WandbVisBackend` config dictionary to the
# `vis_backends` of the `visualizer` from the base configs
_base_.visualizer.vis_backends = [
dict(
type='WandbVisBackend',
init_kwargs={
'project': 'mmdet',
'entity': 'geekyrakshit'
},
),
]
```
# MMF
> How to integrate W&B with Meta AI's MMF.
The `WandbLogger` class in [Meta AI's MMF](https://github.com/facebookresearch/mmf) library will enable Weights & Biases to log the training/validation metrics, system (GPU and CPU) metrics, model checkpoints and configuration parameters.
## Current features
The following features are currently supported by the `WandbLogger` in MMF:
* Training & Validation metrics
* Learning Rate over time
* Model Checkpoint saving to W&B Artifacts
* GPU and CPU system metrics
* Training configuration parameters
## Config parameters
The following options are available in MMF config to enable and customize the wandb logging:
```
training:
wandb:
enabled: true
# An entity is a username or team name where you're sending runs.
# By default it will log the run to your user account.
entity: null
# Project name to be used while logging the experiment with wandb
project: mmf
# Experiment/ run name to be used while logging the experiment
# under the project with wandb. The default experiment name
# is: ${training.experiment_name}
name: ${training.experiment_name}
# Turn on model checkpointing, saving checkpoints to W&B Artifacts
log_model_checkpoint: true
# Additional argument values that you want to pass to wandb.init().
# Check out the documentation at /ref/python/init
# to see what arguments are available, such as:
# job_type: 'train'
# tags: ['tag1', 'tag2']
env:
# To change the path to the directory where wandb metadata would be
# stored (Default: env.log_dir):
wandb_logdir: ${env:MMF_WANDB_LOGDIR,}
```
# MosaicML Composer
> State of the art algorithms to train your neural networks
{{< cta-button colabLink="https://github.com/wandb/examples/blob/master/colabs/mosaicml/MosaicML_Composer_and_wandb.ipynb" >}}
[Composer](https://github.com/mosaicml/composer) is a library for training neural networks better, faster, and cheaper. It contains many state-of-the-art methods for accelerating neural network training and improving generalization, along with an optional [Trainer](https://docs.mosaicml.com/projects/composer/en/stable/trainer/using_the_trainer.html) API that makes _composing_ many different enhancements easy.
W&B provides a lightweight wrapper for logging your ML experiments. But you don't need to combine the two yourself: W&B is incorporated directly into the Composer library via the [WandBLogger](https://docs.mosaicml.com/projects/composer/en/stable/trainer/file_uploading.html#weights-biases-artifacts).
## Start logging to W&B
```python
from composer import Trainer
from composer.loggers import WandBLogger
trainer = Trainer(..., logger=WandBLogger())
```
{{< img src="/images/integrations/n6P7K4M.gif" alt="Interactive dashboards accessible anywhere, and more!" >}}
## Use Composer's `WandBLogger`
The Composer library uses [WandBLogger](https://docs.mosaicml.com/projects/composer/en/stable/trainer/file_uploading.html#weights-biases-artifacts) class in the `Trainer` to log metrics to Weights and Biases. It is a simple as instantiating the logger and passing it to the `Trainer`
```python
wandb_logger = WandBLogger(project="gpt-5", log_artifacts=True)
trainer = Trainer(logger=wandb_logger)
```
## Logger arguments
Below the parameters for WandbLogger, see the [Composer documentation](https://docs.mosaicml.com/projects/composer/en/stable/api_reference/generated/composer.loggers.WandBLogger.html) for a full list and description
| Parameter | Description |
| ------------------------------- | ------------------------------------------------------------------------------------------------------------------------------------------------------------------------------------------------------------------------------------------------------------------------------------------------------------------------------------------------------------------------ |
| `project` | W&B project name (str, optional)
| `group` | W&B group name (str, optional)
| `name` | W&B run name. If not specified, the State.run_name is used (str, optional)
| `entity` | W&B entity name, such as your username or W&B Team name (str, optional)
| `tags` | W&B tags (List[str], optional)
| `log_artifacts` | Whether to log checkpoints to wandb, default: `false` (bool, optional)|
| `rank_zero_only` | Whether to log only on the rank-zero process. When logging artifacts, it is highly recommended to log on all ranks. Artifacts from ranks ≥1 are not stored, which may discard pertinent information. For example, when using Deepspeed ZeRO, it would be impossible to restore from checkpoints without artifacts from all ranks, default: `True` (bool, optional)
| `init_kwargs` | Params to pass to `wandb.init` such as your wandb `config` etc [See here]({{< relref "/ref/python/init" >}}) for the full list `wandb.init` accepts
A typical usage would be:
```
init_kwargs = {"notes":"Testing higher learning rate in this experiment",
"config":{"arch":"Llama",
"use_mixed_precision":True
}
}
wandb_logger = WandBLogger(log_artifacts=True, init_kwargs=init_kwargs)
```
## Log prediction samples
You can use [Composer's Callbacks](https://docs.mosaicml.com/projects/composer/en/stable/trainer/callbacks.html) system to control when you log to Weights & Biases via the WandBLogger, in this example a sample of the validation images and predictions is logged:
```python
import wandb
from composer import Callback, State, Logger
class LogPredictions(Callback):
def __init__(self, num_samples=100, seed=1234):
super().__init__()
self.num_samples = num_samples
self.data = []
def eval_batch_end(self, state: State, logger: Logger):
"""Compute predictions per batch and stores them on self.data"""
if state.timer.epoch == state.max_duration: #on last val epoch
if len(self.data) < self.num_samples:
n = self.num_samples
x, y = state.batch_pair
outputs = state.outputs.argmax(-1)
data = [[wandb.Image(x_i), y_i, y_pred] for x_i, y_i, y_pred in list(zip(x[:n], y[:n], outputs[:n]))]
self.data += data
def eval_end(self, state: State, logger: Logger):
"Create a wandb.Table and logs it"
columns = ['image', 'ground truth', 'prediction']
table = wandb.Table(columns=columns, data=self.data[:self.num_samples])
wandb.log({'sample_table':table}, step=int(state.timer.batch))
...
trainer = Trainer(
...
loggers=[WandBLogger()],
callbacks=[LogPredictions()]
)
```
# OpenAI API
> How to use W&B with the OpenAI API.
{{< cta-button colabLink="https://github.com/wandb/examples/blob/master/colabs/openai/OpenAI_API_Autologger_Quickstart.ipynb" >}}
Use the W&B OpenAI API integration to log requests, responses, token counts and model metadata for all OpenAI models, including fine-tuned models.
{{% alert %}}
See the [OpenAI fine-tuning integration]({{< relref "./openai-fine-tuning.md" >}}) to learn how to use W&B to track your fine-tuning experiments, models, and datasets and share your results with your colleagues.
{{% /alert %}}
Log your API inputs and outputs you can quickly evaluate the performance of difference prompts, compare different model settings (such as temperature), and track other usage metrics such as token usage.
{{< img src="/images/integrations/open_ai_autolog.png" alt="" >}}
## Install OpenAI Python API library
The W&B autolog integration works with OpenAI version 0.28.1 and below.
To install OpenAI Python API version 0.28.1, run:
```python
pip install openai==0.28.1
```
## Use the OpenAI Python API
### 1. Import autolog and initialise it
First, import `autolog` from `wandb.integration.openai` and initialise it.
```python
import os
import openai
from wandb.integration.openai import autolog
autolog({"project": "gpt5"})
```
You can optionally pass a dictionary with argument that `wandb.init()` accepts to `autolog`. This includes a project name, team name, entity, and more. For more information about [`wandb.init`]({{< relref "/ref/python/init.md" >}}), see the API Reference Guide.
### 2. Call the OpenAI API
Each call you make to the OpenAI API is now logged to W&B automatically.
```python
os.environ["OPENAI_API_KEY"] = "XXX"
chat_request_kwargs = dict(
model="gpt-3.5-turbo",
messages=[
{"role": "system", "content": "You are a helpful assistant."},
{"role": "user", "content": "Who won the world series in 2020?"},
{"role": "assistant", "content": "The Los Angeles Dodgers"},
{"role": "user", "content": "Where was it played?"},
],
)
response = openai.ChatCompletion.create(**chat_request_kwargs)
```
### 3. View your OpenAI API inputs and responses
Click on the W&B [run]({{< relref "/guides/models/track/runs/" >}}) link generated by `autolog` in **step 1**. This redirects you to your project workspace in the W&B App.
Select a run you created to view the trace table, trace timeline and the model architecture of the OpenAI LLM used.
## Turn off autolog
W&B recommends that you call `disable()` to close all W&B processes when you are finished using the OpenAI API.
```python
autolog.disable()
```
Now your inputs and completions will be logged to W&B, ready for analysis or to be shared with colleagues.
# OpenAI Fine-Tuning
> How to Fine-Tune OpenAI models using W&B.
{{< cta-button colabLink="http://wandb.me/openai-colab" >}}
Log your OpenAI GPT-3.5 or GPT-4 model's fine-tuning metrics and configuration to W&B. Utilize the W&B ecosystem to track your fine-tuning experiments, models, and datasets and share your results with your colleagues.
{{% alert %}}
See the [OpenAI documentation](https://platform.openai.com/docs/guides/fine-tuning/which-models-can-be-fine-tuned) for a list of models that you can fine tune.
{{% /alert %}}
See the [Weights and Biases Integration](https://platform.openai.com/docs/guides/fine-tuning/weights-and-biases-integration) section in the OpenAI documentation for supplemental information on how to integrate W&B with OpenAI for fine-tuning.
## Install or update OpenAI Python API
The W&B OpenAI fine-tuning integration works with OpenAI version 1.0 and above. See the PyPI documentation for the latest version of the [OpenAI Python API](https://pypi.org/project/openai/) library.
To install OpenAI Python API, run:
```python
pip install openai
```
If you already have OpenAI Python API installed, you can update it with:
```python
pip install -U openai
```
## Sync your OpenAI fine-tuning results
Integrate W&B with OpenAI's fine-tuning API to log your fine-tuning metrics and configuration to W&B. To do this, use the `WandbLogger` class from the `wandb.integration.openai.fine_tuning` module.
```python
from wandb.integration.openai.fine_tuning import WandbLogger
# Finetuning logic
WandbLogger.sync(fine_tune_job_id=FINETUNE_JOB_ID)
```
{{< img src="/images/integrations/open_ai_auto_scan.png" alt="" >}}
### Sync your fine-tunes
Sync your results from your script
```python
from wandb.integration.openai.fine_tuning import WandbLogger
# one line command
WandbLogger.sync()
# passing optional parameters
WandbLogger.sync(
fine_tune_job_id=None,
num_fine_tunes=None,
project="OpenAI-Fine-Tune",
entity=None,
overwrite=False,
model_artifact_name="model-metadata",
model_artifact_type="model",
**kwargs_wandb_init
)
```
### Reference
| Argument | Description |
| ------------------------ | ------------------------------------------------------------------------------------------------------------------------- |
| fine_tune_job_id | This is the OpenAI Fine-Tune ID which you get when you create your fine-tune job using `client.fine_tuning.jobs.create`. If this argument is None (default), all the OpenAI fine-tune jobs that haven't already been synced will be synced to W&B. |
| openai_client | Pass an initialized OpenAI client to `sync`. If no client is provided, one is initialized by the logger itself. By default it is None. |
| num_fine_tunes | If no ID is provided, then all the unsynced fine-tunes will be logged to W&B. This argument allows you to select the number of recent fine-tunes to sync. If num_fine_tunes is 5, it selects the 5 most recent fine-tunes. |
| project | Weights and Biases project name where your fine-tune metrics, models, data, etc. will be logged. By default, the project name is "OpenAI-Fine-Tune." |
| entity | W&B Username or team name where you're sending runs. By default, your default entity is used, which is usually your username. |
| overwrite | Forces logging and overwrite existing wandb run of the same fine-tune job. By default this is False. |
| wait_for_job_success | Once an OpenAI fine-tuning job is started it usually takes a bit of time. To ensure that your metrics are logged to W&B as soon as the fine-tune job is finished, this setting will check every 60 seconds for the status of the fine-tune job to change to `succeeded`. Once the fine-tune job is detected as being successful, the metrics will be synced automatically to W&B. Set to True by default. |
| model_artifact_name | The name of the model artifact that is logged. Defaults to `"model-metadata"`. |
| model_artifact_type | The type of the model artifact that is logged. Defaults to `"model"`. |
| \*\*kwargs_wandb_init | Aany additional argument passed directly to [`wandb.init()`]({{< relref "/ref/python/init.md" >}}) |
## Dataset Versioning and Visualization
### Versioning
The training and validation data that you upload to OpenAI for fine-tuning are automatically logged as W&B Artifacts for easier version control. Below is an view of the training file in Artifacts. Here you can see the W&B run that logged this file, when it was logged, what version of the dataset this is, the metadata, and DAG lineage from the training data to the trained model.
{{< img src="/images/integrations/openai_data_artifacts.png" alt="" >}}
### Visualization
The datasets are visualized as W&B Tables, which allows you to explore, search, and interact with the dataset. Check out the training samples visualized using W&B Tables below.
{{< img src="/images/integrations/openai_data_visualization.png" alt="" >}}
## The fine-tuned model and model versioning
OpenAI gives you an id of the fine-tuned model. Since we don't have access to the model weights, the `WandbLogger` creates a `model_metadata.json` file with all the details (hyperparameters, data file ids, etc.) of the model along with the `fine_tuned_model`` id and is logged as a W&B Artifact.
This model (metadata) artifact can further be linked to a model in the [W&B Registry]({{< relref "/guides/core/registry/" >}}).
{{< img src="/images/integrations/openai_model_metadata.png" alt="" >}}
## Frequently Asked Questions
### How do I share my fine-tune results with my team in W&B?
Log your fine-tune jobs to your team account with:
```python
WandbLogger.sync(entity="YOUR_TEAM_NAME")
```
### How can I organize my runs?
Your W&B runs are automatically organized and can be filtered/sorted based on any configuration parameter such as job type, base model, learning rate, training filename and any other hyper-parameter.
In addition, you can rename your runs, add notes or create tags to group them.
Once you’re satisfied, you can save your workspace and use it to create report, importing data from your runs and saved artifacts (training/validation files).
### How can I access my fine-tuned model?
Fine-tuned model ID is logged to W&B as artifacts (`model_metadata.json`) as well config.
```python
import wandb
ft_artifact = wandb.run.use_artifact("ENTITY/PROJECT/model_metadata:VERSION")
artifact_dir = artifact.download()
```
where `VERSION` is either:
* a version number such as `v2`
* the fine-tune id such as `ft-xxxxxxxxx`
* an alias added automatically such as `latest` or manually
You can then access `fine_tuned_model` id by reading the downloaded `model_metadata.json` file.
### What if a fine-tune was not synced successfully?
If a fine-tune was not logged to W&B successfully, you can use the `overwrite=True` and pass the fine-tune job id:
```python
WandbLogger.sync(
fine_tune_job_id="FINE_TUNE_JOB_ID",
overwrite=True,
)
```
### Can I track my datasets and models with W&B?
The training and validation data are logged automatically to W&B as artifacts. The metadata including the ID for the fine-tuned model is also logged as artifacts.
You can always control the pipeline using low level wandb APIs like `wandb.Artifact`, `wandb.log`, etc. This will allow complete traceability of your data and models.
{{< img src="/images/integrations/open_ai_faq_can_track.png" alt="" >}}
## Resources
* [OpenAI Fine-tuning Documentation](https://platform.openai.com/docs/guides/fine-tuning/) is very thorough and contains many useful tips
* [Demo Colab](http://wandb.me/openai-colab)
* [How to Fine-Tune Your OpenAI GPT-3.5 and GPT-4 Models with W&B](http://wandb.me/openai-report) report
# OpenAI Gym
> How to integrate W&B with OpenAI Gym.
{{% alert %}}
"The team that has been maintaining Gym since 2021 has moved all future development to [Gymnasium](https://github.com/Farama-Foundation/Gymnasium), a drop in replacement for Gym (import gymnasium as gym), and Gym will not be receiving any future updates." ([Source](https://github.com/openai/gym#the-team-that-has-been-maintaining-gym-since-2021-has-moved-all-future-development-to-gymnasium-a-drop-in-replacement-for-gym-import-gymnasium-as-gym-and-gym-will-not-be-receiving-any-future-updates-please-switch-over-to-gymnasium-as-soon-as-youre-able-to-do-so-if-youd-like-to-read-more-about-the-story-behind-this-switch-please-check-out-this-blog-post))
Since Gym is no longer an actively maintained project, try out our integration with Gymnasium.
{{% /alert %}}
If you're using [OpenAI Gym](https://github.com/openai/gym), Weights & Biases automatically logs videos of your environment generated by `gym.wrappers.Monitor`. Just set the `monitor_gym` keyword argument to [`wandb.init`]({{< relref "/ref/python/init.md" >}}) to `True` or call `wandb.gym.monitor()`.
Our gym integration is very light. We simply [look at the name of the video file](https://github.com/wandb/wandb/blob/master/wandb/integration/gym/__init__.py#L15) being logged from `gym` and name it after that or fall back to `"videos"` if we don't find a match. If you want more control, you can always just manually [log a video]({{< relref "/guides/models/track/log/media.md" >}}).
The [OpenRL Benchmark](http://wandb.me/openrl-benchmark-report) by[ CleanRL](https://github.com/vwxyzjn/cleanrl) uses this integration for its OpenAI Gym examples. You can find source code (including [the specific code used for specific runs](https://wandb.ai/cleanrl/cleanrl.benchmark/runs/2jrqfugg/code?workspace=user-costa-huang)) that demonstrates how to use gym with
{{< img src="/images/integrations/open_ai_report_example.png" alt="Learn more here: http://wandb.me/openrl-benchmark-report" >}}
# PaddleDetection
> How to integrate W&B with PaddleDetection.
{{< cta-button colabLink="https://colab.research.google.com/drive/1ywdzcZKPmynih1GuGyCWB4Brf5Jj7xRY?usp=sharing" >}}
[PaddleDetection](https://github.com/PaddlePaddle/PaddleDetection) is an end-to-end object-detection development kit based on [PaddlePaddle](https://github.com/PaddlePaddle/Paddle). It detects various mainstream objects, segments instances, and tracks and detects keypoints using configurable modules such as network components, data augmentations, and losses.
PaddleDetection now includes a built-in W&B integration which logs all your training and validation metrics, as well as your model checkpoints and their corresponding metadata.
The PaddleDetection `WandbLogger` logs your training and evaluation metrics to Weights & Biases as well as your model checkpoints while training.
[**Read a W&B blog post**](https://wandb.ai/manan-goel/PaddleDetectionYOLOX/reports/Object-Detection-with-PaddleDetection-and-W-B--VmlldzoyMDU4MjY0) which illustrates how to integrate a YOLOX model with PaddleDetection on a subset of the `COCO2017` dataset.
## Sign up and create an API key
An API key authenticates your machine to W&B. You can generate an API key from your user profile.
{{% alert %}}
For a more streamlined approach, you can generate an API key by going directly to [https://wandb.ai/authorize](https://wandb.ai/authorize). Copy the displayed API key and save it in a secure location such as a password manager.
{{% /alert %}}
1. Click your user profile icon in the upper right corner.
1. Select **User Settings**, then scroll to the **API Keys** section.
1. Click **Reveal**. Copy the displayed API key. To hide the API key, reload the page.
## Install the `wandb` library and log in
To install the `wandb` library locally and log in:
{{< tabpane text=true >}}
{{% tab header="Command Line" value="cli" %}}
1. Set the `WANDB_API_KEY` [environment variable]({{< relref "/guides/models/track/environment-variables.md" >}}) to your API key.
```bash
export WANDB_API_KEY=
```
1. Install the `wandb` library and log in.
```shell
pip install wandb
wandb login
```
{{% /tab %}}
{{% tab header="Python" value="python" %}}
```bash
pip install wandb
```
```python
import wandb
wandb.login()
```
{{% /tab %}}
{{% tab header="Python notebook" value="python" %}}
```notebook
!pip install wandb
import wandb
wandb.login()
```
{{% /tab %}}
{{< /tabpane >}}
## Activate the `WandbLogger` in your training script
{{< tabpane text=true >}}
{{% tab header="Command Line" value="cli" %}}
To use wandb via arguments to `train.py` in [PaddleDetection](https://github.com/PaddlePaddle/PaddleDetection/):
* Add the `--use_wandb` flag
* The first wandb arguments must be preceded by `-o` (you only need to pass this once)
* Each individual wandb argument must contain the prefix `wandb-` . For example any argument to be passed to [`wandb.init`]({{< relref "/ref/python/init" >}}) would get the `wandb-` prefix
```shell
python tools/train.py
-c config.yml \
--use_wandb \
-o \
wandb-project=MyDetector \
wandb-entity=MyTeam \
wandb-save_dir=./logs
```
{{% /tab %}}
{{% tab header="`config.yml`" value="config" %}}
Add the wandb arguments to the config.yml file under the `wandb` key:
```
wandb:
project: MyProject
entity: MyTeam
save_dir: ./logs
```
When you run your `train.py` file, it generates a link to your W&B dashboard.
{{< img src="/images/integrations/paddledetection_wb_dashboard.png" alt="A Weights & Biases Dashboard" >}}
{{% /tab %}}
{{< /tabpane >}}
## Feedback or issues
If you have any feedback or issues about the Weights & Biases integration please open an issue on the [PaddleDetection GitHub](https://github.com/PaddlePaddle/PaddleDetection) or email support@wandb.com.
# PaddleOCR
> How to integrate W&B with PaddleOCR.
[PaddleOCR](https://github.com/PaddlePaddle/PaddleOCR) aims to create multilingual, awesome, leading, and practical OCR tools that help users train better models and apply them into practice implemented in PaddlePaddle. PaddleOCR support a variety of cutting-edge algorithms related to OCR, and developed industrial solution. PaddleOCR now comes with a Weights & Biases integration for logging training and evaluation metrics along with model checkpoints with corresponding metadata.
## Example Blog & Colab
[**Read here**](https://wandb.ai/manan-goel/text_detection/reports/Train-and-Debug-Your-OCR-Models-with-PaddleOCR-and-W-B--VmlldzoyMDUwMDIw) to see how to train a model with PaddleOCR on the ICDAR2015 dataset. This also comes with a [**Google Colab**](https://colab.research.google.com/drive/1id2VTIQ5-M1TElAkzjzobUCdGeJeW-nV?usp=sharing) and the corresponding live W&B dashboard is available [**here**](https://wandb.ai/manan-goel/text_detection). There is also a Chinese version of this blog here: [**W&B对您的OCR模型进行训练和调试**](https://wandb.ai/wandb_fc/chinese/reports/W-B-OCR---VmlldzoyMDk1NzE4)
## Sign up and create an API key
An API key authenticates your machine to W&B. You can generate an API key from your user profile.
{{% alert %}}
For a more streamlined approach, you can generate an API key by going directly to [https://wandb.ai/authorize](https://wandb.ai/authorize). Copy the displayed API key and save it in a secure location such as a password manager.
{{% /alert %}}
1. Click your user profile icon in the upper right corner.
1. Select **User Settings**, then scroll to the **API Keys** section.
1. Click **Reveal**. Copy the displayed API key. To hide the API key, reload the page.
## Install the `wandb` library and log in
To install the `wandb` library locally and log in:
{{< tabpane text=true >}}
{{% tab header="Command Line" value="cli" %}}
1. Set the `WANDB_API_KEY` [environment variable]({{< relref "/guides/models/track/environment-variables.md" >}}) to your API key.
```bash
export WANDB_API_KEY=
```
1. Install the `wandb` library and log in.
```shell
pip install wandb
wandb login
```
{{% /tab %}}
{{% tab header="Python" value="python" %}}
```bash
pip install wandb
```
```python
import wandb
wandb.login()
```
{{% /tab %}}
{{% tab header="Python notebook" value="notebook" %}}
```notebook
!pip install wandb
import wandb
wandb.login()
```
{{% /tab %}}
{{< /tabpane >}}
## Add wandb to your `config.yml` file
PaddleOCR requires configuration variables to be provided using a yaml file. Adding the following snippet at the end of the configuration yaml file will automatically log all training and validation metrics to a W&B dashboard along with model checkpoints:
```python
Global:
use_wandb: True
```
Any additional, optional arguments that you might like to pass to [`wandb.init`]({{< relref "/ref/python/init" >}}) can also be added under the `wandb` header in the yaml file:
```
wandb:
project: CoolOCR # (optional) this is the wandb project name
entity: my_team # (optional) if you're using a wandb team, you can pass the team name here
name: MyOCRModel # (optional) this is the name of the wandb run
```
## Pass the `config.yml` file to `train.py`
The yaml file is then provided as an argument to the [training script](https://github.com/PaddlePaddle/PaddleOCR/blob/release/2.5/tools/train.py) available in the PaddleOCR repository.
```bash
python tools/train.py -c config.yml
```
Once you run your `train.py` file with Weights & Biases turned on, a link will be generated to bring you to your W&B dashboard:
{{< img src="/images/integrations/paddleocr_wb_dashboard1.png" alt="" >}}
{{< img src="/images/integrations/paddleocr_wb_dashboard2.png" alt="" >}}
{{< img src="/images/integrations/paddleocr_wb_dashboard3.png" alt="W&B Dashboard for the Text Detection Model" >}}
## Feedback or issues
If you have any feedback or issues about the Weights & Biases integration please open an issue on the [PaddleOCR GitHub](https://github.com/PaddlePaddle/PaddleOCR) or email support@wandb.com.
# Prodigy
> How to integrate W&B with Prodigy.
[Prodigy](https://prodi.gy/) is an annotation tool for creating training and evaluation data for machine learning models, error analysis, data inspection & cleaning. [W&B Tables]({{< relref "/guides/models/tables/tables-walkthrough.md" >}}) allow you to log, visualize, analyze, and share datasets (and more!) inside W&B.
The [W&B integration with Prodigy](https://github.com/wandb/wandb/blob/master/wandb/integration/prodigy/prodigy.py) adds simple and easy-to-use functionality to upload your Prodigy-annotated dataset directly to W&B for use with Tables.
Run a few lines of code, like these:
```python
import wandb
from wandb.integration.prodigy import upload_dataset
with wandb.init(project="prodigy"):
upload_dataset("news_headlines_ner")
```
and get visual, interactive, shareable tables like this one:
{{< img src="/images/integrations/prodigy_interactive_visual.png" alt="" >}}
## Quickstart
Use `wandb.integration.prodigy.upload_dataset` to upload your annotated prodigy dataset directly from the local Prodigy database to W&B in our [Table]({{< relref "/ref/python/data-types/table" >}}) format. For more information on Prodigy, including installation & setup, please refer to the [Prodigy documentation](https://prodi.gy/docs/).
W&B will automatically try to convert images and named entity fields to [`wandb.Image`]({{< relref "/ref/python/data-types/image" >}}) and [`wandb.Html`]({{< relref "/ref/python/data-types/html" >}})respectively. Extra columns may be added to the resulting table to include these visualizations.
## Read through a detailed example
Explore the [Visualizing Prodigy Datasets Using W&B Tables](https://wandb.ai/kshen/prodigy/reports/Visualizing-Prodigy-Datasets-Using-W-B-Tables--Vmlldzo5NDE2MTc) for example visualizations generated with W&B Prodigy integration.
## Also using spaCy?
W&B also has an integration with spaCy, see the [docs here]({{< relref "/guides/integrations/spacy" >}}).
# PyTorch
{{< cta-button colabLink="https://colab.research.google.com/github/wandb/examples/blob/master/colabs/intro/Intro_to_Weights_%26_Biases.ipynb" >}}
PyTorch is one of the most popular frameworks for deep learning in Python, especially among researchers. W&B provides first class support for PyTorch, from logging gradients to profiling your code on the CPU and GPU.
Try our integration out in a Colab notebook.
{{< cta-button colabLink="https://colab.research.google.com/github/wandb/examples/blob/master/colabs/pytorch/Simple_PyTorch_Integration.ipynb" >}}
You can also see our [example repo](https://github.com/wandb/examples) for scripts, including one on hyperparameter optimization using [Hyperband](https://arxiv.org/abs/1603.06560) on [Fashion MNIST](https://github.com/wandb/examples/tree/master/examples/pytorch/pytorch-cnn-fashion), plus the [W&B Dashboard](https://wandb.ai/wandb/keras-fashion-mnist/runs/5z1d85qs) it generates.
## Log gradients with `wandb.watch`
To automatically log gradients, you can call [`wandb.watch`]({{< relref "/ref/python/watch.md" >}}) and pass in your PyTorch model.
```python
import wandb
wandb.init(config=args)
model = ... # set up your model
# Magic
wandb.watch(model, log_freq=100)
model.train()
for batch_idx, (data, target) in enumerate(train_loader):
output = model(data)
loss = F.nll_loss(output, target)
loss.backward()
optimizer.step()
if batch_idx % args.log_interval == 0:
wandb.log({"loss": loss})
```
If you need to track multiple models in the same script, you can call `wandb.watch` on each model separately. Reference documentation for this function is [here]({{< relref "/ref/python/watch.md" >}}).
{{% alert color="secondary" %}}
Gradients, metrics, and the graph won't be logged until `wandb.log` is called after a forward _and_ backward pass.
{{% /alert %}}
## Log images and media
You can pass PyTorch `Tensors` with image data into [`wandb.Image`]({{< relref "/ref/python/data-types/image.md" >}}) and utilities from [`torchvision`](https://pytorch.org/vision/stable/index.html) will be used to convert them to images automatically:
```python
images_t = ... # generate or load images as PyTorch Tensors
wandb.log({"examples": [wandb.Image(im) for im in images_t]})
```
For more on logging rich media to W&B in PyTorch and other frameworks, check out our [media logging guide]({{< relref "/guides/models/track/log/media.md" >}}).
If you also want to include information alongside media, like your model's predictions or derived metrics, use a `wandb.Table`.
```python
my_table = wandb.Table()
my_table.add_column("image", images_t)
my_table.add_column("label", labels)
my_table.add_column("class_prediction", predictions_t)
# Log your Table to W&B
wandb.log({"mnist_predictions": my_table})
```
{{< img src="/images/integrations/pytorch_example_table.png" alt="The code above generates a table like this one. This model's looking good!" >}}
For more on logging and visualizing datasets and models, check out our [guide to W&B Tables]({{< relref "/guides/models/tables/" >}}).
## Profile PyTorch code
{{< img src="/images/integrations/pytorch_example_dashboard.png" alt="View detailed traces of PyTorch code execution inside W&B dashboards." >}}
W&B integrates directly with [PyTorch Kineto](https://github.com/pytorch/kineto)'s [Tensorboard plugin](https://github.com/pytorch/kineto/blob/master/tb_plugin/README.md) to provide tools for profiling PyTorch code, inspecting the details of CPU and GPU communication, and identifying bottlenecks and optimizations.
```python
profile_dir = "path/to/run/tbprofile/"
profiler = torch.profiler.profile(
schedule=schedule, # see the profiler docs for details on scheduling
on_trace_ready=torch.profiler.tensorboard_trace_handler(profile_dir),
with_stack=True,
)
with profiler:
... # run the code you want to profile here
# see the profiler docs for detailed usage information
# create a wandb Artifact
profile_art = wandb.Artifact("trace", type="profile")
# add the pt.trace.json files to the Artifact
profile_art.add_file(glob.glob(profile_dir + ".pt.trace.json"))
# log the artifact
profile_art.save()
```
See and run working example code in [this Colab](http://wandb.me/trace-colab).
{{% alert color="secondary" %}}
The interactive trace viewing tool is based on the Chrome Trace Viewer, which works best with the Chrome browser.
{{% /alert %}}
# PyTorch Geometric
[PyTorch Geometric](https://github.com/pyg-team/pytorch_geometric) or PyG is one of the most popular libraries for geometric deep learning and W&B works extremely well with it for visualizing graphs and tracking experiments.
After you have installed Pytorch Geometric, follow these steps to get started.
## Sign up and create an API key
An API key authenticates your machine to W&B. You can generate an API key from your user profile.
{{% alert %}}
For a more streamlined approach, you can generate an API key by going directly to [https://wandb.ai/authorize](https://wandb.ai/authorize). Copy the displayed API key and save it in a secure location such as a password manager.
{{% /alert %}}
1. Click your user profile icon in the upper right corner.
1. Select **User Settings**, then scroll to the **API Keys** section.
1. Click **Reveal**. Copy the displayed API key. To hide the API key, reload the page.
## Install the `wandb` library and log in
To install the `wandb` library locally and log in:
{{< tabpane text=true >}}
{{% tab header="Command Line" value="cli" %}}
1. Set the `WANDB_API_KEY` [environment variable]({{< relref "/guides/models/track/environment-variables.md" >}}) to your API key.
```bash
export WANDB_API_KEY=
```
1. Install the `wandb` library and log in.
```shell
pip install wandb
wandb login
```
{{% /tab %}}
{{% tab header="Python" value="python" %}}
```bash
pip install wandb
```
```python
import wandb
wandb.login()
```
{{% /tab %}}
{{% tab header="Python notebook" value="notebook" %}}
```notebook
!pip install wandb
import wandb
wandb.login()
```
{{% /tab %}}
{{< /tabpane >}}
## Visualize the graphs
You can save details about the input graphs including number of edges, number of nodes and more. W&B supports logging plotly charts and HTML panels so any visualizations you create for your graph can then also be logged to W&B.
### Use PyVis
The following snippet shows how you could do that with PyVis and HTML.
```python
from pyvis.network import Network
Import wandb
wandb.init(project=’graph_vis’)
net = Network(height="750px", width="100%", bgcolor="#222222", font_color="white")
# Add the edges from the PyG graph to the PyVis network
for e in tqdm(g.edge_index.T):
src = e[0].item()
dst = e[1].item()
net.add_node(dst)
net.add_node(src)
net.add_edge(src, dst, value=0.1)
# Save the PyVis visualisation to a HTML file
net.show("graph.html")
wandb.log({"eda/graph": wandb.Html("graph.html")})
wandb.finish()
```
{{< img src="/images/integrations/pyg_graph_wandb.png" alt="This image shows the input graph as an interactive HTML visualization." >}}
### Use Plotly
To use plotly to create a graph visualization, first you need to convert the PyG graph to a networkx object. Following this you will need to create Plotly scatter plots for both nodes and edges. The snippet below can be used for this task.
```python
def create_vis(graph):
G = to_networkx(graph)
pos = nx.spring_layout(G)
edge_x = []
edge_y = []
for edge in G.edges():
x0, y0 = pos[edge[0]]
x1, y1 = pos[edge[1]]
edge_x.append(x0)
edge_x.append(x1)
edge_x.append(None)
edge_y.append(y0)
edge_y.append(y1)
edge_y.append(None)
edge_trace = go.Scatter(
x=edge_x, y=edge_y,
line=dict(width=0.5, color='#888'),
hoverinfo='none',
mode='lines'
)
node_x = []
node_y = []
for node in G.nodes():
x, y = pos[node]
node_x.append(x)
node_y.append(y)
node_trace = go.Scatter(
x=node_x, y=node_y,
mode='markers',
hoverinfo='text',
line_width=2
)
fig = go.Figure(data=[edge_trace, node_trace], layout=go.Layout())
return fig
wandb.init(project=’visualize_graph’)
wandb.log({‘graph’: wandb.Plotly(create_vis(graph))})
wandb.finish()
```
{{< img src="/images/integrations/pyg_graph_plotly.png" alt="A visualization created using the example function and logged inside a W&B Table." >}}
## Log metrics
You can use W&B to track your experiments and related metrics, such as loss functions, accuracy, and more. Add the following line to your training loop:
```python
wandb.log({
‘train/loss’: training_loss,
‘train/acc’: training_acc,
‘val/loss’: validation_loss,
‘val/acc’: validation_acc
})
```
{{< img src="/images/integrations/pyg_metrics.png" alt="Plots from W&B showing how the hits@K metric changes over epochs for different values of K." >}}
## More resources
- [Recommending Amazon Products using Graph Neural Networks in PyTorch Geometric](https://wandb.ai/manan-goel/gnn-recommender/reports/Recommending-Amazon-Products-using-Graph-Neural-Networks-in-PyTorch-Geometric--VmlldzozMTA3MzYw#what-does-the-data-look-like?)
- [Point Cloud Classification using PyTorch Geometric](https://wandb.ai/geekyrakshit/pyg-point-cloud/reports/Point-Cloud-Classification-using-PyTorch-Geometric--VmlldzozMTExMTE3)
- [Point Cloud Segmentation using PyTorch Geometric](https://wandb.ai/wandb/point-cloud-segmentation/reports/Point-Cloud-Segmentation-using-Dynamic-Graph-CNN--VmlldzozMTk5MDcy)
# Pytorch torchtune
{{< cta-button colabLink="https://colab.research.google.com/github/wandb/examples/blob/master/colabs/torchtune/torchtune_and_wandb.ipynb" >}}
[torchtune](https://pytorch.org/torchtune/stable/index.html) is a PyTorch-based library designed to streamline the authoring, fine-tuning, and experimentation processes for large language models (LLMs). Additionally, torchtune has built-in support for [logging with W&B](https://pytorch.org/torchtune/stable/deep_dives/wandb_logging.html), enhancing tracking and visualization of training processes.
{{< img src="/images/integrations/torchtune_dashboard.png" alt="" >}}
Check the W&B blog post on [Fine-tuning Mistral 7B using torchtune](https://wandb.ai/capecape/torchtune-mistral/reports/torchtune-The-new-PyTorch-LLM-fine-tuning-library---Vmlldzo3NTUwNjM0).
## W&B logging at your fingertips
{{< tabpane text=true >}}
{{% tab header="Command line" value="cli" %}}
Override command line arguments at launch:
```bash
tune run lora_finetune_single_device --config llama3/8B_lora_single_device \
metric_logger._component_=torchtune.utils.metric_logging.WandBLogger \
metric_logger.project="llama3_lora" \
log_every_n_steps=5
```
{{% /tab %}}
{{% tab header="Recipe's config" value="config" %}}
Enable W&B logging on the recipe's config:
```yaml
# inside llama3/8B_lora_single_device.yaml
metric_logger:
_component_: torchtune.utils.metric_logging.WandBLogger
project: llama3_lora
log_every_n_steps: 5
```
{{% /tab %}}
{{< /tabpane >}}
## Use the W&B metric logger
Enable W&B logging on the recipe's config file by modifying the `metric_logger` section. Change the `_component_` to `torchtune.utils.metric_logging.WandBLogger` class. You can also pass a `project` name and `log_every_n_steps` to customize the logging behavior.
You can also pass any other `kwargs` as you would to the [wandb.init]({{< relref "/ref/python/init.md" >}}) method. For example, if you are working on a team, you can pass the `entity` argument to the `WandBLogger` class to specify the team name.
{{< tabpane text=true >}}
{{% tab header="Recipe's Config" value="config" %}}
```yaml
# inside llama3/8B_lora_single_device.yaml
metric_logger:
_component_: torchtune.utils.metric_logging.WandBLogger
project: llama3_lora
entity: my_project
job_type: lora_finetune_single_device
group: my_awesome_experiments
log_every_n_steps: 5
```
{{% /tab %}}
{{% tab header="Command Line" value="cli" %}}
```shell
tune run lora_finetune_single_device --config llama3/8B_lora_single_device \
metric_logger._component_=torchtune.utils.metric_logging.WandBLogger \
metric_logger.project="llama3_lora" \
metric_logger.entity="my_project" \
metric_logger.job_type="lora_finetune_single_device" \
metric_logger.group="my_awesome_experiments" \
log_every_n_steps=5
```
{{% /tab %}}
{{< /tabpane >}}
## What is logged?
You can explore the W&B dashboard to see the logged metrics. By default W&B logs all of the hyperparameters from the config file and the launch overrides.
W&B captures the resolved config on the **Overview** tab. W&B also stores the config in YAML format on the [Files tab](https://wandb.ai/capecape/torchtune/runs/joyknwwa/files).
{{< img src="/images/integrations/torchtune_config.png" alt="" >}}
### Logged Metrics
Each recipe has its own training loop. Check each individual recipe to see its logged metrics, which include these by default:
| Metric | Description |
| --- | --- |
| `loss` | The loss of the model |
| `lr` | The learning rate |
| `tokens_per_second` | The tokens per second of the model |
| `grad_norm` | The gradient norm of the model |
| `global_step` | Corresponds to the current step in the training loop. Takes into account gradient accumulation, basically every time an optimizer step is taken, the model is updated, the gradients are accumulated and the model is updated once every `gradient_accumulation_steps` |
{{% alert %}}
`global_step` is not the same as the number of training steps. It corresponds to the current step in the training loop. Takes into account gradient accumulation, basically every time an optimizer step is taken the `global_step` is incremented by 1. For example, if the dataloader has 10 batches, gradient accumulation steps is 2 and run for 3 epochs, the optimizer will step 15 times, in this case `global_step` will range from 1 to 15.
{{% /alert %}}
The streamlined design of torchtune allows to easily add custom metrics or modify the existing ones. It suffices to modify the corresponding [recipe file](https://github.com/pytorch/torchtune/tree/main/recipes), for example, computing one could log `current_epoch` as a percentage of the total number of epochs as following:
```python
# inside `train.py` function in the recipe file
self._metric_logger.log_dict(
{"current_epoch": self.epochs * self.global_step / self._steps_per_epoch},
step=self.global_step,
)
```
{{% alert %}}
This is a fast evolving library, the current metrics are subject to change. If you want to add a custom metric, you should modify the recipe and call the corresponding `self._metric_logger.*` function.
{{% /alert %}}
## Save and load checkpoints
The torchtune library supports various [checkpoint formats](https://pytorch.org/torchtune/stable/deep_dives/checkpointer.html). Depending on the origin of the model you are using, you should switch to the appropriate [checkpointer class](https://pytorch.org/torchtune/stable/deep_dives/checkpointer.html).
If you want to save the model checkpoints to [W&B Artifacts]({{< relref "/guides/core/artifacts/" >}}), the simplest solution is to override the `save_checkpoint` functions inside the corresponding recipe.
Here is an example of how you can override the `save_checkpoint` function to save the model checkpoints to W&B Artifacts.
```python
def save_checkpoint(self, epoch: int) -> None:
...
## Let's save the checkpoint to W&B
## depending on the Checkpointer Class the file will be named differently
## Here is an example for the full_finetune case
checkpoint_file = Path.joinpath(
self._checkpointer._output_dir, f"torchtune_model_{epoch}"
).with_suffix(".pt")
wandb_artifact = wandb.Artifact(
name=f"torchtune_model_{epoch}",
type="model",
# description of the model checkpoint
description="Model checkpoint",
# you can add whatever metadata you want as a dict
metadata={
utils.SEED_KEY: self.seed,
utils.EPOCHS_KEY: self.epochs_run,
utils.TOTAL_EPOCHS_KEY: self.total_epochs,
utils.MAX_STEPS_KEY: self.max_steps_per_epoch,
},
)
wandb_artifact.add_file(checkpoint_file)
wandb.log_artifact(wandb_artifact)
```
# PyTorch Ignite
> How to integrate W&B with PyTorch Ignite.
* See the resulting visualizations in this [example W&B report →](https://app.wandb.ai/example-team/pytorch-ignite-example/reports/PyTorch-Ignite-with-W%26B--Vmlldzo0NzkwMg)
* Try running the code yourself in this [example hosted notebook →](https://colab.research.google.com/drive/15e-yGOvboTzXU4pe91Jg-Yr7sae3zBOJ#scrollTo=ztVifsYAmnRr)
Ignite supports Weights & Biases handler to log metrics, model/optimizer parameters, gradients during training and validation. It can also be used to log model checkpoints to the Weights & Biases cloud. This class is also a wrapper for the wandb module. This means that you can call any wandb function using this wrapper. See examples on how to save model parameters and gradients.
## Basic setup
```python
from argparse import ArgumentParser
import wandb
import torch
from torch import nn
from torch.optim import SGD
from torch.utils.data import DataLoader
import torch.nn.functional as F
from torchvision.transforms import Compose, ToTensor, Normalize
from torchvision.datasets import MNIST
from ignite.engine import Events, create_supervised_trainer, create_supervised_evaluator
from ignite.metrics import Accuracy, Loss
from tqdm import tqdm
class Net(nn.Module):
def __init__(self):
super(Net, self).__init__()
self.conv1 = nn.Conv2d(1, 10, kernel_size=5)
self.conv2 = nn.Conv2d(10, 20, kernel_size=5)
self.conv2_drop = nn.Dropout2d()
self.fc1 = nn.Linear(320, 50)
self.fc2 = nn.Linear(50, 10)
def forward(self, x):
x = F.relu(F.max_pool2d(self.conv1(x), 2))
x = F.relu(F.max_pool2d(self.conv2_drop(self.conv2(x)), 2))
x = x.view(-1, 320)
x = F.relu(self.fc1(x))
x = F.dropout(x, training=self.training)
x = self.fc2(x)
return F.log_softmax(x, dim=-1)
def get_data_loaders(train_batch_size, val_batch_size):
data_transform = Compose([ToTensor(), Normalize((0.1307,), (0.3081,))])
train_loader = DataLoader(MNIST(download=True, root=".", transform=data_transform, train=True),
batch_size=train_batch_size, shuffle=True)
val_loader = DataLoader(MNIST(download=False, root=".", transform=data_transform, train=False),
batch_size=val_batch_size, shuffle=False)
return train_loader, val_loader
```
Using `WandBLogger` in ignite is a modular process. First, you create a WandBLogger object. Next, you attach it to a trainer or evaluator to automatically log the metrics. This example:
* Logs training loss, attached to the trainer object.
* Logs validation loss, attached to the evaluator.
* Logs optional Parameters, such as learning rate.
* Watches the model.
```python
from ignite.contrib.handlers.wandb_logger import *
def run(train_batch_size, val_batch_size, epochs, lr, momentum, log_interval):
train_loader, val_loader = get_data_loaders(train_batch_size, val_batch_size)
model = Net()
device = 'cpu'
if torch.cuda.is_available():
device = 'cuda'
optimizer = SGD(model.parameters(), lr=lr, momentum=momentum)
trainer = create_supervised_trainer(model, optimizer, F.nll_loss, device=device)
evaluator = create_supervised_evaluator(model,
metrics={'accuracy': Accuracy(),
'nll': Loss(F.nll_loss)},
device=device)
desc = "ITERATION - loss: {:.2f}"
pbar = tqdm(
initial=0, leave=False, total=len(train_loader),
desc=desc.format(0)
)
#WandBlogger Object Creation
wandb_logger = WandBLogger(
project="pytorch-ignite-integration",
name="cnn-mnist",
config={"max_epochs": epochs,"batch_size":train_batch_size},
tags=["pytorch-ignite", "mninst"]
)
wandb_logger.attach_output_handler(
trainer,
event_name=Events.ITERATION_COMPLETED,
tag="training",
output_transform=lambda loss: {"loss": loss}
)
wandb_logger.attach_output_handler(
evaluator,
event_name=Events.EPOCH_COMPLETED,
tag="training",
metric_names=["nll", "accuracy"],
global_step_transform=lambda *_: trainer.state.iteration,
)
wandb_logger.attach_opt_params_handler(
trainer,
event_name=Events.ITERATION_STARTED,
optimizer=optimizer,
param_name='lr' # optional
)
wandb_logger.watch(model)
```
You can optionally utilize ignite `EVENTS` to log the metrics directly to the terminal
```python
@trainer.on(Events.ITERATION_COMPLETED(every=log_interval))
def log_training_loss(engine):
pbar.desc = desc.format(engine.state.output)
pbar.update(log_interval)
@trainer.on(Events.EPOCH_COMPLETED)
def log_training_results(engine):
pbar.refresh()
evaluator.run(train_loader)
metrics = evaluator.state.metrics
avg_accuracy = metrics['accuracy']
avg_nll = metrics['nll']
tqdm.write(
"Training Results - Epoch: {} Avg accuracy: {:.2f} Avg loss: {:.2f}"
.format(engine.state.epoch, avg_accuracy, avg_nll)
)
@trainer.on(Events.EPOCH_COMPLETED)
def log_validation_results(engine):
evaluator.run(val_loader)
metrics = evaluator.state.metrics
avg_accuracy = metrics['accuracy']
avg_nll = metrics['nll']
tqdm.write(
"Validation Results - Epoch: {} Avg accuracy: {:.2f} Avg loss: {:.2f}"
.format(engine.state.epoch, avg_accuracy, avg_nll))
pbar.n = pbar.last_print_n = 0
trainer.run(train_loader, max_epochs=epochs)
pbar.close()
if __name__ == "__main__":
parser = ArgumentParser()
parser.add_argument('--batch_size', type=int, default=64,
help='input batch size for training (default: 64)')
parser.add_argument('--val_batch_size', type=int, default=1000,
help='input batch size for validation (default: 1000)')
parser.add_argument('--epochs', type=int, default=10,
help='number of epochs to train (default: 10)')
parser.add_argument('--lr', type=float, default=0.01,
help='learning rate (default: 0.01)')
parser.add_argument('--momentum', type=float, default=0.5,
help='SGD momentum (default: 0.5)')
parser.add_argument('--log_interval', type=int, default=10,
help='how many batches to wait before logging training status')
args = parser.parse_args()
run(args.batch_size, args.val_batch_size, args.epochs, args.lr, args.momentum, args.log_interval)
```
This code generates these visualizations::
{{< img src="/images/integrations/pytorch-ignite-1.png" alt="" >}}
{{< img src="/images/integrations/pytorch-ignite-2.png" alt="" >}}
{{< img src="/images/integrations/pytorch-ignite-3.png" alt="" >}}
{{< img src="/images/integrations/pytorch-ignite-4.png" alt="" >}}
Refer to the [Ignite Docs](https://pytorch.org/ignite/contrib/handlers.html#module-ignite.contrib.handlers.wandb_logger) for more details.
# PyTorch Lightning
{{< cta-button colabLink="https://colab.research.google.com/github/wandb/examples/blob/master/colabs/pytorch-lightning/Optimize_PyTorch_Lightning_models_with_Weights_%26_Biases.ipynb" >}}
PyTorch Lightning provides a lightweight wrapper for organizing your PyTorch code and easily adding advanced features such as distributed training and 16-bit precision. W&B provides a lightweight wrapper for logging your ML experiments. But you don't need to combine the two yourself: Weights & Biases is incorporated directly into the PyTorch Lightning library via the [**`WandbLogger`**](https://lightning.ai/docs/pytorch/stable/api/lightning.pytorch.loggers.wandb.html#module-lightning.pytorch.loggers.wandb).
## Integrate with Lightning
{{< tabpane text=true >}}
{{% tab header="PyTorch Logger" value="pytorch" %}}
```python
from lightning.pytorch.loggers import WandbLogger
from lightning.pytorch import Trainer
wandb_logger = WandbLogger(log_model="all")
trainer = Trainer(logger=wandb_logger)
```
{{% alert %}}
**Using wandb.log():** The `WandbLogger` logs to W&B using the Trainer's `global_step`. If you make additional calls to `wandb.log` directly in your code, **do not** use the `step` argument in `wandb.log()`.
Instead, log the Trainer's `global_step` like your other metrics:
```python
wandb.log({"accuracy":0.99, "trainer/global_step": step})
```
{{% /alert %}}
{{% /tab %}}
{{% tab header="Fabric Logger" value="fabric" %}}
```python
import lightning as L
from wandb.integration.lightning.fabric import WandbLogger
wandb_logger = WandbLogger(log_model="all")
fabric = L.Fabric(loggers=[wandb_logger])
fabric.launch()
fabric.log_dict({"important_metric": important_metric})
```
{{% /tab %}}
{{< /tabpane >}}
{{< img src="/images/integrations/n6P7K4M.gif" alt="Interactive dashboards accessible anywhere, and more!" >}}
### Sign up and create an API key
An API key authenticates your machine to W&B. You can generate an API key from your user profile.
{{% alert %}}
For a more streamlined approach, you can generate an API key by going directly to [https://wandb.ai/authorize](https://wandb.ai/authorize). Copy the displayed API key and save it in a secure location such as a password manager.
{{% /alert %}}
1. Click your user profile icon in the upper right corner.
1. Select **User Settings**, then scroll to the **API Keys** section.
1. Click **Reveal**. Copy the displayed API key. To hide the API key, reload the page.
### Install the `wandb` library and log in
To install the `wandb` library locally and log in:
{{< tabpane text=true >}}
{{% tab header="Command Line" value="cli" %}}
1. Set the `WANDB_API_KEY` [environment variable]({{< relref "/guides/models/track/environment-variables.md" >}}) to your API key.
```bash
export WANDB_API_KEY=
```
1. Install the `wandb` library and log in.
```shell
pip install wandb
wandb login
```
{{% /tab %}}
{{% tab header="Python" value="python" %}}
```bash
pip install wandb
```
```python
import wandb
wandb.login()
```
{{% /tab %}}
{{% tab header="Python notebook" value="notebook" %}}
```notebook
!pip install wandb
import wandb
wandb.login()
```
{{% /tab %}}
{{< /tabpane >}}
## Use PyTorch Lightning's `WandbLogger`
PyTorch Lightning has multiple `WandbLogger` classes to log metrics and model weights, media, and more.
- [`PyTorch`](https://lightning.ai/docs/pytorch/stable/api/lightning.pytorch.loggers.wandb.html#module-lightning.pytorch.loggers.wandb)
- [`Fabric`](https://lightning.ai/docs/pytorch/stable/api/lightning.pytorch.loggers.wandb.html#module-lightning.pytorch.loggers.wandb)
To integrate with Lightning, instantiate the WandbLogger and pass it to Lightning's `Trainer` or `Fabric`.
{{< tabpane text=true >}}
{{% tab header="PyTorch Logger" value="pytorch" %}}
```python
trainer = Trainer(logger=wandb_logger)
```
{{% /tab %}}
{{% tab header="Fabric Logger" value="fabric" %}}
```python
fabric = L.Fabric(loggers=[wandb_logger])
fabric.launch()
fabric.log_dict({
"important_metric": important_metric
})
```
{{% /tab %}}
{{< /tabpane >}}
### Common logger arguments
Below are some of the most used parameters in WandbLogger. Review the PyTorch Lightning documentation for details about all logger arguments.
- [`PyTorch`](https://lightning.ai/docs/pytorch/stable/api/lightning.pytorch.loggers.wandb.html#module-lightning.pytorch.loggers.wandb)
- [`Fabric`](https://lightning.ai/docs/pytorch/stable/api/lightning.pytorch.loggers.wandb.html#module-lightning.pytorch.loggers.wandb)
| Parameter | Description |
| ----------- | ----------------------------------------------------------------------------- |
| `project` | Define what wandb Project to log to |
| `name` | Give a name to your wandb run |
| `log_model` | Log all models if `log_model="all"` or at end of training if `log_model=True` |
| `save_dir` | Path where data is saved |
## Log your hyperparameters
{{< tabpane text=true >}}
{{% tab header="PyTorch Logger" value="pytorch" %}}
```python
class LitModule(LightningModule):
def __init__(self, *args, **kwarg):
self.save_hyperparameters()
```
{{% /tab %}}
{{% tab header="Fabric Logger" value="fabric" %}}
```python
wandb_logger.log_hyperparams(
{
"hyperparameter_1": hyperparameter_1,
"hyperparameter_2": hyperparameter_2,
}
)
```
{{% /tab %}}
{{< /tabpane >}}
## Log additional config parameters
```python
# add one parameter
wandb_logger.experiment.config["key"] = value
# add multiple parameters
wandb_logger.experiment.config.update({key1: val1, key2: val2})
# use directly wandb module
wandb.config["key"] = value
wandb.config.update()
```
## Log gradients, parameter histogram and model topology
You can pass your model object to `wandblogger.watch()` to monitor your models's gradients and parameters as you train. See the PyTorch Lightning `WandbLogger` documentation
## Log metrics
{{< tabpane text=true >}}
{{% tab header="PyTorch Logger" value="pytorch" %}}
You can log your metrics to W&B when using the `WandbLogger` by calling `self.log('my_metric_name', metric_vale)` within your `LightningModule`, such as in your `training_step` or `validation_step methods.`
The code snippet below shows how to define your `LightningModule` to log your metrics and your `LightningModule` hyperparameters. This example uses the [`torchmetrics`](https://github.com/PyTorchLightning/metrics) library to calculate your metrics
```python
import torch
from torch.nn import Linear, CrossEntropyLoss, functional as F
from torch.optim import Adam
from torchmetrics.functional import accuracy
from lightning.pytorch import LightningModule
class My_LitModule(LightningModule):
def __init__(self, n_classes=10, n_layer_1=128, n_layer_2=256, lr=1e-3):
"""method used to define the model parameters"""
super().__init__()
# mnist images are (1, 28, 28) (channels, width, height)
self.layer_1 = Linear(28 * 28, n_layer_1)
self.layer_2 = Linear(n_layer_1, n_layer_2)
self.layer_3 = Linear(n_layer_2, n_classes)
self.loss = CrossEntropyLoss()
self.lr = lr
# save hyper-parameters to self.hparams (auto-logged by W&B)
self.save_hyperparameters()
def forward(self, x):
"""method used for inference input -> output"""
# (b, 1, 28, 28) -> (b, 1*28*28)
batch_size, channels, width, height = x.size()
x = x.view(batch_size, -1)
# let's do 3 x (linear + relu)
x = F.relu(self.layer_1(x))
x = F.relu(self.layer_2(x))
x = self.layer_3(x)
return x
def training_step(self, batch, batch_idx):
"""needs to return a loss from a single batch"""
_, loss, acc = self._get_preds_loss_accuracy(batch)
# Log loss and metric
self.log("train_loss", loss)
self.log("train_accuracy", acc)
return loss
def validation_step(self, batch, batch_idx):
"""used for logging metrics"""
preds, loss, acc = self._get_preds_loss_accuracy(batch)
# Log loss and metric
self.log("val_loss", loss)
self.log("val_accuracy", acc)
return preds
def configure_optimizers(self):
"""defines model optimizer"""
return Adam(self.parameters(), lr=self.lr)
def _get_preds_loss_accuracy(self, batch):
"""convenience function since train/valid/test steps are similar"""
x, y = batch
logits = self(x)
preds = torch.argmax(logits, dim=1)
loss = self.loss(logits, y)
acc = accuracy(preds, y)
return preds, loss, acc
```
{{% /tab %}}
{{% tab header="Fabric Logger" value="fabric" %}}
```python
import lightning as L
import torch
import torchvision as tv
from wandb.integration.lightning.fabric import WandbLogger
import wandb
fabric = L.Fabric(loggers=[wandb_logger])
fabric.launch()
model = tv.models.resnet18()
optimizer = torch.optim.SGD(model.parameters(), lr=lr)
model, optimizer = fabric.setup(model, optimizer)
train_dataloader = fabric.setup_dataloaders(
torch.utils.data.DataLoader(train_dataset, batch_size=batch_size)
)
model.train()
for epoch in range(num_epochs):
for batch in train_dataloader:
optimizer.zero_grad()
loss = model(batch)
loss.backward()
optimizer.step()
fabric.log_dict({"loss": loss})
```
{{% /tab %}}
{{< /tabpane >}}
## Log the min/max of a metric
Using wandb's [`define_metric`]({{< relref "/ref/python/run#define_metric" >}}) function you can define whether you'd like your W&B summary metric to display the min, max, mean or best value for that metric. If `define`_`metric` _ isn't used, then the last value logged with appear in your summary metrics. See the `define_metric` [reference docs here]({{< relref "/ref/python/run#define_metric" >}}) and the [guide here]({{< relref "/guides/models/track/log/customize-logging-axes" >}}) for more.
To tell W&B to keep track of the max validation accuracy in the W&B summary metric, call `wandb.define_metric` only once, at the beginning of training:
{{< tabpane text=true >}}
{{% tab header="PyTorch Logger" value="pytorch" %}}
```python
class My_LitModule(LightningModule):
...
def validation_step(self, batch, batch_idx):
if trainer.global_step == 0:
wandb.define_metric("val_accuracy", summary="max")
preds, loss, acc = self._get_preds_loss_accuracy(batch)
# Log loss and metric
self.log("val_loss", loss)
self.log("val_accuracy", acc)
return preds
```
{{% /tab %}}
{{% tab header="Fabric Logger" value="fabric" %}}
```python
wandb.define_metric("val_accuracy", summary="max")
fabric = L.Fabric(loggers=[wandb_logger])
fabric.launch()
fabric.log_dict({"val_accuracy": val_accuracy})
```
{{% /tab %}}
{{< /tabpane >}}
## Checkpoint a model
To save model checkpoints as W&B [Artifacts]({{< relref "/guides/core/artifacts/" >}}),
use the Lightning [`ModelCheckpoint`](https://pytorch-lightning.readthedocs.io/en/stable/api/pytorch_lightning.callbacks.ModelCheckpoint.html#pytorch_lightning.callbacks.ModelCheckpoint) callback and set the `log_model` argument in the `WandbLogger`.
{{< tabpane text=true >}}
{{% tab header="PyTorch Logger" value="pytorch" %}}
```python
trainer = Trainer(logger=wandb_logger, callbacks=[checkpoint_callback])
```
{{% /tab %}}
{{% tab header="Fabric Logger" value="fabric" %}}
```python
fabric = L.Fabric(loggers=[wandb_logger], callbacks=[checkpoint_callback])
```
{{% /tab %}}
{{< /tabpane >}}
The _latest_ and _best_ aliases are automatically set to easily retrieve a model checkpoint from a W&B [Artifact]({{< relref "/guides/core/artifacts/" >}}):
```python
# reference can be retrieved in artifacts panel
# "VERSION" can be a version (ex: "v2") or an alias ("latest or "best")
checkpoint_reference = "USER/PROJECT/MODEL-RUN_ID:VERSION"
```
{{< tabpane text=true >}}
{{% tab header="Via Logger" value="logger" %}}
```python
# download checkpoint locally (if not already cached)
wandb_logger.download_artifact(checkpoint_reference, artifact_type="model")
```
{{% /tab %}}
{{% tab header="Via wandb" value="wandb" %}}
```python
# download checkpoint locally (if not already cached)
run = wandb.init(project="MNIST")
artifact = run.use_artifact(checkpoint_reference, type="model")
artifact_dir = artifact.download()
```
{{% /tab %}}
{{< /tabpane >}}
{{< tabpane text=true >}}
{{% tab header="PyTorch Logger" value="pytorch" %}}
```python
# load checkpoint
model = LitModule.load_from_checkpoint(Path(artifact_dir) / "model.ckpt")
```
{{% /tab %}}
{{% tab header="Fabric Logger" value="fabric" %}}
```python
# Request the raw checkpoint
full_checkpoint = fabric.load(Path(artifact_dir) / "model.ckpt")
model.load_state_dict(full_checkpoint["model"])
optimizer.load_state_dict(full_checkpoint["optimizer"])
```
{{% /tab %}}
{{< /tabpane >}}
The model checkpoints you log are viewable through the [W&B Artifacts]({{< relref "/guides/core/artifacts" >}}) UI, and include the full model lineage (see an example model checkpoint in the UI [here](https://wandb.ai/wandb/arttest/artifacts/model/iv3_trained/5334ab69740f9dda4fed/lineage?_gl=1*yyql5q*_ga*MTQxOTYyNzExOS4xNjg0NDYyNzk1*_ga_JH1SJHJQXJ*MTY5MjMwNzI2Mi4yNjkuMS4xNjkyMzA5NjM2LjM3LjAuMA..)).
To bookmark your best model checkpoints and centralize them across your team, you can link them to the [W&B Model Registry]({{< relref "/guides/models" >}}).
Here you can organize your best models by task, manage model lifecycle, facilitate easy tracking and auditing throughout the ML lifecyle, and [automate]({{< relref "/guides/core/automations/" >}}) downstream actions with webhooks or jobs.
## Log images, text, and more
The `WandbLogger` has `log_image`, `log_text` and `log_table` methods for logging media.
You can also directly call `wandb.log` or `trainer.logger.experiment.log` to log other media types such as Audio, Molecules, Point Clouds, 3D Objects and more.
{{< tabpane text=true >}}
{{% tab header="Log Images" value="images" %}}
```python
# using tensors, numpy arrays or PIL images
wandb_logger.log_image(key="samples", images=[img1, img2])
# adding captions
wandb_logger.log_image(key="samples", images=[img1, img2], caption=["tree", "person"])
# using file path
wandb_logger.log_image(key="samples", images=["img_1.jpg", "img_2.jpg"])
# using .log in the trainer
trainer.logger.experiment.log(
{"samples": [wandb.Image(img, caption=caption) for (img, caption) in my_images]},
step=current_trainer_global_step,
)
```
{{% /tab %}}
{{% tab header="Log Text" value="text" %}}
```python
# data should be a list of lists
columns = ["input", "label", "prediction"]
my_data = [["cheese", "english", "english"], ["fromage", "french", "spanish"]]
# using columns and data
wandb_logger.log_text(key="my_samples", columns=columns, data=my_data)
# using a pandas DataFrame
wandb_logger.log_text(key="my_samples", dataframe=my_dataframe)
```
{{% /tab %}}
{{% tab header="Log Tables" value="tables" %}}
```python
# log a W&B Table that has a text caption, an image and audio
columns = ["caption", "image", "sound"]
# data should be a list of lists
my_data = [
["cheese", wandb.Image(img_1), wandb.Audio(snd_1)],
["wine", wandb.Image(img_2), wandb.Audio(snd_2)],
]
# log the Table
wandb_logger.log_table(key="my_samples", columns=columns, data=data)
```
{{% /tab %}}
{{< /tabpane >}}
You can use Lightning's Callbacks system to control when you log to Weights & Biases via the WandbLogger, in this example we log a sample of our validation images and predictions:
```python
import torch
import wandb
import lightning.pytorch as pl
from lightning.pytorch.loggers import WandbLogger
# or
# from wandb.integration.lightning.fabric import WandbLogger
class LogPredictionSamplesCallback(Callback):
def on_validation_batch_end(
self, trainer, pl_module, outputs, batch, batch_idx, dataloader_idx
):
"""Called when the validation batch ends."""
# `outputs` comes from `LightningModule.validation_step`
# which corresponds to our model predictions in this case
# Let's log 20 sample image predictions from the first batch
if batch_idx == 0:
n = 20
x, y = batch
images = [img for img in x[:n]]
captions = [
f"Ground Truth: {y_i} - Prediction: {y_pred}"
for y_i, y_pred in zip(y[:n], outputs[:n])
]
# Option 1: log images with `WandbLogger.log_image`
wandb_logger.log_image(key="sample_images", images=images, caption=captions)
# Option 2: log images and predictions as a W&B Table
columns = ["image", "ground truth", "prediction"]
data = [
[wandb.Image(x_i), y_i, y_pred] or x_i,
y_i,
y_pred in list(zip(x[:n], y[:n], outputs[:n])),
]
wandb_logger.log_table(key="sample_table", columns=columns, data=data)
trainer = pl.Trainer(callbacks=[LogPredictionSamplesCallback()])
```
## Use multiple GPUs with Lightning and W&B
PyTorch Lightning has Multi-GPU support through their DDP Interface. However, PyTorch Lightning's design requires you to be careful about how you instantiate our GPUs.
Lightning assumes that each GPU (or Rank) in your training loop must be instantiated in exactly the same way - with the same initial conditions. However, only rank 0 process gets access to the `wandb.run` object, and for non-zero rank processes: `wandb.run = None`. This could cause your non-zero processes to fail. Such a situation can put you in a **deadlock** because rank 0 process will wait for the non-zero rank processes to join, which have already crashed.
For this reason, be careful about how we set up your training code. The recommended way to set it up would be to have your code be independent of the `wandb.run` object.
```python
class MNISTClassifier(pl.LightningModule):
def __init__(self):
super(MNISTClassifier, self).__init__()
self.model = nn.Sequential(
nn.Flatten(),
nn.Linear(28 * 28, 128),
nn.ReLU(),
nn.Linear(128, 10),
)
self.loss = nn.CrossEntropyLoss()
def forward(self, x):
return self.model(x)
def training_step(self, batch, batch_idx):
x, y = batch
y_hat = self.forward(x)
loss = self.loss(y_hat, y)
self.log("train/loss", loss)
return {"train_loss": loss}
def validation_step(self, batch, batch_idx):
x, y = batch
y_hat = self.forward(x)
loss = self.loss(y_hat, y)
self.log("val/loss", loss)
return {"val_loss": loss}
def configure_optimizers(self):
return torch.optim.Adam(self.parameters(), lr=0.001)
def main():
# Setting all the random seeds to the same value.
# This is important in a distributed training setting.
# Each rank will get its own set of initial weights.
# If they don't match up, the gradients will not match either,
# leading to training that may not converge.
pl.seed_everything(1)
train_loader = DataLoader(train_dataset, batch_size=64, shuffle=True, num_workers=4)
val_loader = DataLoader(val_dataset, batch_size=64, shuffle=False, num_workers=4)
model = MNISTClassifier()
wandb_logger = WandbLogger(project="")
callbacks = [
ModelCheckpoint(
dirpath="checkpoints",
every_n_train_steps=100,
),
]
trainer = pl.Trainer(
max_epochs=3, gpus=2, logger=wandb_logger, strategy="ddp", callbacks=callbacks
)
trainer.fit(model, train_loader, val_loader)
```
## Examples
You can follow along in a video tutorial with a Colab [here](https://wandb.me/lit-colab).
## Frequently Asked Questions
### How does W&B integrate with Lightning?
The core integration is based on the [Lightning `loggers` API](https://pytorch-lightning.readthedocs.io/en/stable/extensions/logging.html), which lets you write much of your logging code in a framework-agnostic way. `Logger`s are passed to the [Lightning `Trainer`](https://pytorch-lightning.readthedocs.io/en/stable/common/trainer.html) and are triggered based on that API's rich [hook-and-callback system](https://pytorch-lightning.readthedocs.io/en/stable/extensions/callbacks.html). This keeps your research code well-separated from engineering and logging code.
### What does the integration log without any additional code?
We'll save your model checkpoints to W&B, where you can view them or download them for use in future runs. We'll also capture [system metrics]({{< relref "/guides/models/app/settings-page/system-metrics.md" >}}), like GPU usage and network I/O, environment information, like hardware and OS information, [code state]({{< relref "/guides/models/app/features/panels/code.md" >}}) (including git commit and diff patch, notebook contents and session history), and anything printed to the standard out.
### What if I need to use `wandb.run` in my training setup?
You need to expand the scope of the variable you need to access yourself. In other words, make sure that the initial conditions are the same on all processes.
```python
if os.environ.get("LOCAL_RANK", None) is None:
os.environ["WANDB_DIR"] = wandb.run.dir
```
If they are, you can use `os.environ["WANDB_DIR"]` to set up the model checkpoints directory. This way, any non-zero rank process can access `wandb.run.dir`.
# Ray Tune
> How to integrate W&B with Ray Tune.
W&B integrates with [Ray](https://github.com/ray-project/ray) by offering two lightweight integrations.
- The`WandbLoggerCallback` function automatically logs metrics reported to Tune to the Wandb API.
- The `setup_wandb()` function, which can be used with the function API, automatically initializes the Wandb API with Tune's training information. You can use the Wandb API as usual. such as by using `wandb.log()` to log your training process.
## Configure the integration
```python
from ray.air.integrations.wandb import WandbLoggerCallback
```
Wandb configuration is done by passing a wandb key to the config parameter of `tune.run()` (see example below).
The content of the wandb config entry is passed to `wandb.init()` as keyword arguments. The exception are the following settings, which are used to configure the `WandbLoggerCallback` itself:
### Parameters
`project (str)`: Name of the Wandb project. Mandatory.
`api_key_file (str)`: Path to file containing the Wandb API KEY.
`api_key (str)`: Wandb API Key. Alternative to setting `api_key_file`.
`excludes (list)`: List of metrics to exclude from the log.
`log_config (bool)`: Whether to log the config parameter of the results dictionary. Defaults to False.
`upload_checkpoints (bool)`: If True, model checkpoints are uploaded as artifacts. Defaults to False.
### Example
```python
from ray import tune, train
from ray.air.integrations.wandb import WandbLoggerCallback
def train_fc(config):
for i in range(10):
train.report({"mean_accuracy": (i + config["alpha"]) / 10})
tuner = tune.Tuner(
train_fc,
param_space={
"alpha": tune.grid_search([0.1, 0.2, 0.3]),
"beta": tune.uniform(0.5, 1.0),
},
run_config=train.RunConfig(
callbacks=[
WandbLoggerCallback(
project="", api_key="", log_config=True
)
]
),
)
results = tuner.fit()
```
## setup_wandb
```python
from ray.air.integrations.wandb import setup_wandb
```
This utility function helps initialize Wandb for use with Ray Tune. For basic usage, call `setup_wandb()` in your training function:
```python
from ray.air.integrations.wandb import setup_wandb
def train_fn(config):
# Initialize wandb
wandb = setup_wandb(config)
for i in range(10):
loss = config["a"] + config["b"]
wandb.log({"loss": loss})
tune.report(loss=loss)
tuner = tune.Tuner(
train_fn,
param_space={
# define search space here
"a": tune.choice([1, 2, 3]),
"b": tune.choice([4, 5, 6]),
# wandb configuration
"wandb": {"project": "Optimization_Project", "api_key_file": "/path/to/file"},
},
)
results = tuner.fit()
```
## Example Code
We've created a few examples for you to see how the integration works:
* [Colab](http://wandb.me/raytune-colab): A simple demo to try the integration.
* [Dashboard](https://wandb.ai/anmolmann/ray_tune): View dashboard generated from the example.
# SageMaker
> How to integrate W&B with Amazon SageMaker.
W&B integrates with [Amazon SageMaker](https://aws.amazon.com/sagemaker/), automatically reading hyperparameters, grouping distributed runs, and resuming runs from checkpoints.
## Authentication
W&B looks for a file named `secrets.env` relative to the training script and loads them into the environment when `wandb.init()` is called. You can generate a `secrets.env` file by calling `wandb.sagemaker_auth(path="source_dir")` in the script you use to launch your experiments. Be sure to add this file to your `.gitignore`!
## Existing estimators
If you're using one of SageMakers preconfigured estimators you need to add a `requirements.txt` to your source directory that includes wandb
```text
wandb
```
If you're using an estimator that's running Python 2, you'll need to install `psutil` directly from this [wheel](https://pythonwheels.com) before installing wandb:
```text
https://wheels.galaxyproject.org/packages/psutil-5.4.8-cp27-cp27mu-manylinux1_x86_64.whl
wandb
```
Review a complete example on [GitHub](https://github.com/wandb/examples/tree/master/examples/pytorch/pytorch-cifar10-sagemaker), and read more on our [blog](https://wandb.ai/site/articles/running-sweeps-with-sagemaker).
You can also read the [tutorial](https://wandb.ai/authors/sagemaker/reports/Deploy-Sentiment-Analyzer-Using-SageMaker-and-W-B--VmlldzoxODA1ODE) on deploying a sentiment analyzer using SageMaker and W&B.
{{% alert color="secondary" %}}
The W&B sweep agent behaves as expected in a SageMaker job only if your SageMaker integration is turned off. Turn off the SageMaker integration by modifying your invocation of `wandb.init`:
```python
wandb.init(..., settings=wandb.Settings(sagemaker_disable=True))
```
{{% /alert %}}
# Scikit-Learn
You can use wandb to visualize and compare your scikit-learn models' performance with just a few lines of code. [**Try an example →**](http://wandb.me/scikit-colab)
## Get started
### Sign up and create an API key
An API key authenticates your machine to W&B. You can generate an API key from your user profile.
{{% alert %}}
For a more streamlined approach, you can generate an API key by going directly to [https://wandb.ai/authorize](https://wandb.ai/authorize). Copy the displayed API key and save it in a secure location such as a password manager.
{{% /alert %}}
1. Click your user profile icon in the upper right corner.
1. Select **User Settings**, then scroll to the **API Keys** section.
1. Click **Reveal**. Copy the displayed API key. To hide the API key, reload the page.
### Install the `wandb` library and log in
To install the `wandb` library locally and log in:
{{< tabpane text=true >}}
{{% tab header="Command Line" value="cli" %}}
1. Set the `WANDB_API_KEY` [environment variable]({{< relref "/guides/models/track/environment-variables.md" >}}) to your API key.
```bash
export WANDB_API_KEY=
```
1. Install the `wandb` library and log in.
```shell
pip install wandb
wandb login
```
{{% /tab %}}
{{% tab header="Python" value="python" %}}
```bash
pip install wandb
```
```python
import wandb
wandb.login()
```
{{% /tab %}}
{{% tab header="Python notebook" value="notebook" %}}
```notebook
!pip install wandb
import wandb
wandb.login()
```
{{% /tab %}}
{{< /tabpane >}}
### Log metrics
```python
import wandb
wandb.init(project="visualize-sklearn")
y_pred = clf.predict(X_test)
accuracy = sklearn.metrics.accuracy_score(y_true, y_pred)
# If logging metrics over time, then use wandb.log
wandb.log({"accuracy": accuracy})
# OR to log a final metric at the end of training you can also use wandb.summary
wandb.summary["accuracy"] = accuracy
```
### Make plots
#### Step 1: Import wandb and initialize a new run
```python
import wandb
wandb.init(project="visualize-sklearn")
```
#### Step 2: Visualize plots
#### Individual plots
After training a model and making predictions you can then generate plots in wandb to analyze your predictions. See the **Supported Plots** section below for a full list of supported charts
```python
# Visualize single plot
wandb.sklearn.plot_confusion_matrix(y_true, y_pred, labels)
```
#### All plots
W&B has functions such as `plot_classifier` that will plot several relevant plots:
```python
# Visualize all classifier plots
wandb.sklearn.plot_classifier(
clf,
X_train,
X_test,
y_train,
y_test,
y_pred,
y_probas,
labels,
model_name="SVC",
feature_names=None,
)
# All regression plots
wandb.sklearn.plot_regressor(reg, X_train, X_test, y_train, y_test, model_name="Ridge")
# All clustering plots
wandb.sklearn.plot_clusterer(
kmeans, X_train, cluster_labels, labels=None, model_name="KMeans"
)
```
#### Existing Matplotlib plots
Plots created on Matplotlib can also be logged on W&B dashboard. To do that, it is first required to install `plotly`.
```bash
pip install plotly
```
Finally, the plots can be logged on W&B's dashboard as follows:
```python
import matplotlib.pyplot as plt
import wandb
wandb.init(project="visualize-sklearn")
# do all the plt.plot(), plt.scatter(), etc. here.
# ...
# instead of doing plt.show() do:
wandb.log({"plot": plt})
```
## Supported plots
### Learning curve
{{< img src="/images/integrations/scikit_learning_curve.png" alt="" >}}
Trains model on datasets of varying lengths and generates a plot of cross validated scores vs dataset size, for both training and test sets.
`wandb.sklearn.plot_learning_curve(model, X, y)`
* model (clf or reg): Takes in a fitted regressor or classifier.
* X (arr): Dataset features.
* y (arr): Dataset labels.
### ROC
{{< img src="/images/integrations/scikit_roc.png" alt="" >}}
ROC curves plot true positive rate (y-axis) vs false positive rate (x-axis). The ideal score is a TPR = 1 and FPR = 0, which is the point on the top left. Typically we calculate the area under the ROC curve (AUC-ROC), and the greater the AUC-ROC the better.
`wandb.sklearn.plot_roc(y_true, y_probas, labels)`
* y_true (arr): Test set labels.
* y_probas (arr): Test set predicted probabilities.
* labels (list): Named labels for target variable (y).
### Class proportions
{{< img src="/images/integrations/scikic_class_props.png" alt="" >}}
Plots the distribution of target classes in training and test sets. Useful for detecting imbalanced classes and ensuring that one class doesn't have a disproportionate influence on the model.
`wandb.sklearn.plot_class_proportions(y_train, y_test, ['dog', 'cat', 'owl'])`
* y_train (arr): Training set labels.
* y_test (arr): Test set labels.
* labels (list): Named labels for target variable (y).
### Precision recall curve
{{< img src="/images/integrations/scikit_precision_recall.png" alt="" >}}
Computes the tradeoff between precision and recall for different thresholds. A high area under the curve represents both high recall and high precision, where high precision relates to a low false positive rate, and high recall relates to a low false negative rate.
High scores for both show that the classifier is returning accurate results (high precision), as well as returning a majority of all positive results (high recall). PR curve is useful when the classes are very imbalanced.
`wandb.sklearn.plot_precision_recall(y_true, y_probas, labels)`
* y_true (arr): Test set labels.
* y_probas (arr): Test set predicted probabilities.
* labels (list): Named labels for target variable (y).
### Feature importances
{{< img src="/images/integrations/scikit_feature_importances.png" alt="" >}}
Evaluates and plots the importance of each feature for the classification task. Only works with classifiers that have a `feature_importances_` attribute, like trees.
`wandb.sklearn.plot_feature_importances(model, ['width', 'height, 'length'])`
* model (clf): Takes in a fitted classifier.
* feature_names (list): Names for features. Makes plots easier to read by replacing feature indexes with corresponding names.
### Calibration curve
{{< img src="/images/integrations/scikit_calibration_curve.png" alt="" >}}
Plots how well calibrated the predicted probabilities of a classifier are and how to calibrate an uncalibrated classifier. Compares estimated predicted probabilities by a baseline logistic regression model, the model passed as an argument, and by both its isotonic calibration and sigmoid calibrations.
The closer the calibration curves are to a diagonal the better. A transposed sigmoid like curve represents an overfitted classifier, while a sigmoid like curve represents an underfitted classifier. By training isotonic and sigmoid calibrations of the model and comparing their curves we can figure out whether the model is over or underfitting and if so which calibration (sigmoid or isotonic) might help fix this.
For more details, check out [sklearn's docs](https://scikit-learn.org/stable/auto_examples/calibration/plot_calibration_curve.html).
`wandb.sklearn.plot_calibration_curve(clf, X, y, 'RandomForestClassifier')`
* model (clf): Takes in a fitted classifier.
* X (arr): Training set features.
* y (arr): Training set labels.
* model_name (str): Model name. Defaults to 'Classifier'
### Confusion matrix
{{< img src="/images/integrations/scikit_confusion_matrix.png" alt="" >}}
Computes the confusion matrix to evaluate the accuracy of a classification. It's useful for assessing the quality of model predictions and finding patterns in the predictions the model gets wrong. The diagonal represents the predictions the model got right, such as where the actual label is equal to the predicted label.
`wandb.sklearn.plot_confusion_matrix(y_true, y_pred, labels)`
* y_true (arr): Test set labels.
* y_pred (arr): Test set predicted labels.
* labels (list): Named labels for target variable (y).
### Summary metrics
{{< img src="/images/integrations/scikit_summary_metrics.png" alt="" >}}
- Calculates summary metrics for classification, such as `mse`, `mae`, and `r2` score.
- Calculates summary metrics for regression, such as `f1`, accuracy, precision, and recall.
`wandb.sklearn.plot_summary_metrics(model, X_train, y_train, X_test, y_test)`
* model (clf or reg): Takes in a fitted regressor or classifier.
* X (arr): Training set features.
* y (arr): Training set labels.
* X_test (arr): Test set features.
* y_test (arr): Test set labels.
### Elbow plot
{{< img src="/images/integrations/scikit_elbow_plot.png" alt="" >}}
Measures and plots the percentage of variance explained as a function of the number of clusters, along with training times. Useful in picking the optimal number of clusters.
`wandb.sklearn.plot_elbow_curve(model, X_train)`
* model (clusterer): Takes in a fitted clusterer.
* X (arr): Training set features.
### Silhouette plot
{{< img src="/images/integrations/scikit_silhouette_plot.png" alt="" >}}
Measures & plots how close each point in one cluster is to points in the neighboring clusters. The thickness of the clusters corresponds to the cluster size. The vertical line represents the average silhouette score of all the points.
Silhouette coefficients near +1 indicate that the sample is far away from the neighboring clusters. A value of 0 indicates that the sample is on or very close to the decision boundary between two neighboring clusters and negative values indicate that those samples might have been assigned to the wrong cluster.
In general we want all silhouette cluster scores to be above average (past the red line) and as close to 1 as possible. We also prefer cluster sizes that reflect the underlying patterns in the data.
`wandb.sklearn.plot_silhouette(model, X_train, ['spam', 'not spam'])`
* model (clusterer): Takes in a fitted clusterer.
* X (arr): Training set features.
* cluster_labels (list): Names for cluster labels. Makes plots easier to read by replacing cluster indexes with corresponding names.
### Outlier candidates plot
{{< img src="/images/integrations/scikit_outlier_plot.png" alt="" >}}
Measures a datapoint's influence on regression model via cook's distance. Instances with heavily skewed influences could potentially be outliers. Useful for outlier detection.
`wandb.sklearn.plot_outlier_candidates(model, X, y)`
* model (regressor): Takes in a fitted classifier.
* X (arr): Training set features.
* y (arr): Training set labels.
### Residuals plot
{{< img src="/images/integrations/scikit_residuals_plot.png" alt="" >}}
Measures and plots the predicted target values (y-axis) vs the difference between actual and predicted target values (x-axis), as well as the distribution of the residual error.
Generally, the residuals of a well-fit model should be randomly distributed because good models will account for most phenomena in a data set, except for random error.
`wandb.sklearn.plot_residuals(model, X, y)`
* model (regressor): Takes in a fitted classifier.
* X (arr): Training set features.
* y (arr): Training set labels.
If you have any questions, we'd love to answer them in our [slack community](http://wandb.me/slack).
## Example
* [Run in colab](http://wandb.me/scikit-colab): A simple notebook to get you started
# Simple Transformers
> How to integrate W&B with the Transformers library by Hugging Face.
This library is based on the Transformers library by Hugging Face. Simple Transformers lets you quickly train and evaluate Transformer models. Only 3 lines of code are needed to initialize a model, train the model, and evaluate a model. It supports Sequence Classification, Token Classification \(NER\),Question Answering,Language Model Fine-Tuning, Language Model Training, Language Generation, T5 Model, Seq2Seq Tasks , Multi-Modal Classification and Conversational AI.
To use Weights and Biases for visualizing model training. To use this, set a project name for W&B in the `wandb_project` attribute of the `args` dictionary. This logs all hyperparameter values, training losses, and evaluation metrics to the given project.
```python
model = ClassificationModel('roberta', 'roberta-base', args={'wandb_project': 'project-name'})
```
Any additional arguments that go into `wandb.init` can be passed as `wandb_kwargs`.
## Structure
The library is designed to have a separate class for every NLP task. The classes that provide similar functionality are grouped together.
* `simpletransformers.classification` - Includes all Classification models.
* `ClassificationModel`
* `MultiLabelClassificationModel`
* `simpletransformers.ner` - Includes all Named Entity Recognition models.
* `NERModel`
* `simpletransformers.question_answering` - Includes all Question Answering models.
* `QuestionAnsweringModel`
Here are some minimal examples
## MultiLabel Classification
```text
model = MultiLabelClassificationModel("distilbert","distilbert-base-uncased",num_labels=6,
args={"reprocess_input_data": True, "overwrite_output_dir": True, "num_train_epochs":epochs,'learning_rate':learning_rate,
'wandb_project': "simpletransformers"},
)
# Train the model
model.train_model(train_df)
# Evaluate the model
result, model_outputs, wrong_predictions = model.eval_model(eval_df)
```
## Question Answering
```text
train_args = {
'learning_rate': wandb.config.learning_rate,
'num_train_epochs': 2,
'max_seq_length': 128,
'doc_stride': 64,
'overwrite_output_dir': True,
'reprocess_input_data': False,
'train_batch_size': 2,
'fp16': False,
'wandb_project': "simpletransformers"
}
model = QuestionAnsweringModel('distilbert', 'distilbert-base-cased', args=train_args)
model.train_model(train_data)
```
SimpleTransformers provides classes as well as training scripts for all common natural language tasks. Here is the complete list of global arguments that are supported by the library, with their default arguments.
```text
global_args = {
"adam_epsilon": 1e-8,
"best_model_dir": "outputs/best_model",
"cache_dir": "cache_dir/",
"config": {},
"do_lower_case": False,
"early_stopping_consider_epochs": False,
"early_stopping_delta": 0,
"early_stopping_metric": "eval_loss",
"early_stopping_metric_minimize": True,
"early_stopping_patience": 3,
"encoding": None,
"eval_batch_size": 8,
"evaluate_during_training": False,
"evaluate_during_training_silent": True,
"evaluate_during_training_steps": 2000,
"evaluate_during_training_verbose": False,
"fp16": True,
"fp16_opt_level": "O1",
"gradient_accumulation_steps": 1,
"learning_rate": 4e-5,
"local_rank": -1,
"logging_steps": 50,
"manual_seed": None,
"max_grad_norm": 1.0,
"max_seq_length": 128,
"multiprocessing_chunksize": 500,
"n_gpu": 1,
"no_cache": False,
"no_save": False,
"num_train_epochs": 1,
"output_dir": "outputs/",
"overwrite_output_dir": False,
"process_count": cpu_count() - 2 if cpu_count() > 2 else 1,
"reprocess_input_data": True,
"save_best_model": True,
"save_eval_checkpoints": True,
"save_model_every_epoch": True,
"save_steps": 2000,
"save_optimizer_and_scheduler": True,
"silent": False,
"tensorboard_dir": None,
"train_batch_size": 8,
"use_cached_eval_features": False,
"use_early_stopping": False,
"use_multiprocessing": True,
"wandb_kwargs": {},
"wandb_project": None,
"warmup_ratio": 0.06,
"warmup_steps": 0,
"weight_decay": 0,
}
```
Refer to [simpletransformers on github](https://github.com/ThilinaRajapakse/simpletransformers) for more detailed documentation.
Checkout [this Weights and Biases report](https://app.wandb.ai/cayush/simpletransformers/reports/Using-simpleTransformer-on-common-NLP-applications---Vmlldzo4Njk2NA) that covers training transformers on some the most popular GLUE benchmark datasets. [Try it out yourself on colab](https://colab.research.google.com/drive/1oXROllqMqVvBFcPgTKJRboTq96uWuqSz?usp=sharing).
# Skorch
> How to integrate W&B with Skorch.
You can use Weights & Biases with Skorch to automatically log the model with the best performance, along with all model performance metrics, the model topology and compute resources after each epoch. Every file saved in `wandb_run.dir` is automatically logged to W&B servers.
See [example run](https://app.wandb.ai/borisd13/skorch/runs/s20or4ct?workspace=user-borisd13).
## Parameters
| Parameter | Type | Description |
| :--- | :--- | :--- |
| `wandb_run` | `wandb.wandb_run`. Run | wandb run used to log data. |
|`save_model` | bool (default=True)| Whether to save a checkpoint of the best model and upload it to your Run on W&B servers.|
|`keys_ignored`| str or list of str (default=None) | Key or list of keys that should not be logged to tensorboard. Note that in addition to the keys provided by the user, keys such as those starting with `event_` or ending on `_best` are ignored by default.|
## Example Code
We've created a few examples for you to see how the integration works:
* [Colab](https://colab.research.google.com/drive/1Bo8SqN1wNPMKv5Bn9NjwGecBxzFlaNZn?usp=sharing): A simple demo to try the integration
* [A step by step guide](https://app.wandb.ai/cayush/uncategorized/reports/Automate-Kaggle-model-training-with-Skorch-and-W%26B--Vmlldzo4NTQ1NQ): to tracking your Skorch model performance
```python
# Install wandb
... pip install wandb
import wandb
from skorch.callbacks import WandbLogger
# Create a wandb Run
wandb_run = wandb.init()
# Alternative: Create a wandb Run without a W&B account
wandb_run = wandb.init(anonymous="allow")
# Log hyper-parameters (optional)
wandb_run.config.update({"learning rate": 1e-3, "batch size": 32})
net = NeuralNet(..., callbacks=[WandbLogger(wandb_run)])
net.fit(X, y)
```
## Method reference
| Method | Description |
| :--- | :--- |
| `initialize`\(\) | \(Re-\)Set the initial state of the callback. |
| `on_batch_begin`\(net\[, X, y, training\]\) | Called at the beginning of each batch. |
| `on_batch_end`\(net\[, X, y, training\]\) | Called at the end of each batch. |
| `on_epoch_begin`\(net\[, dataset_train, …\]\) | Called at the beginning of each epoch. |
| `on_epoch_end`\(net, \*\*kwargs\) | Log values from the last history step and save best model |
| `on_grad_computed`\(net, named_parameters\[, X, …\]\) | Called once per batch after gradients have been computed but before an update step was performed. |
| `on_train_begin`\(net, \*\*kwargs\) | Log model topology and add a hook for gradients |
| `on_train_end`\(net\[, X, y\]\) | Called at the end of training. |
# spaCy
[spaCy](https://spacy.io) is a popular "industrial-strength" NLP library: fast, accurate models with a minimum of fuss. As of spaCy v3, Weights and Biases can now be used with [`spacy train`](https://spacy.io/api/cli#train) to track your spaCy model's training metrics as well as to save and version your models and datasets. And all it takes is a few added lines in your configuration.
## Sign up and create an API key
An API key authenticates your machine to W&B. You can generate an API key from your user profile.
{{% alert %}}
For a more streamlined approach, you can generate an API key by going directly to [https://wandb.ai/authorize](https://wandb.ai/authorize). Copy the displayed API key and save it in a secure location such as a password manager.
{{% /alert %}}
1. Click your user profile icon in the upper right corner.
1. Select **User Settings**, then scroll to the **API Keys** section.
1. Click **Reveal**. Copy the displayed API key. To hide the API key, reload the page.
## Install the `wandb` library and log in
To install the `wandb` library locally and log in:
{{< tabpane text=true >}}
{{% tab header="Command Line" value="cli" %}}
1. Set the `WANDB_API_KEY` [environment variable]({{< relref "/guides/models/track/environment-variables.md" >}}) to your API key.
```bash
export WANDB_API_KEY=
```
1. Install the `wandb` library and log in.
```shell
pip install wandb
wandb login
```
{{% /tab %}}
{{% tab header="Python" value="python" %}}
```bash
pip install wandb
```
```python
import wandb
wandb.login()
```
{{% /tab %}}
{{% tab header="Python notebook" value="notebook" %}}
```notebook
!pip install wandb
import wandb
wandb.login()
```
{{% /tab %}}
{{< /tabpane >}}
## Add the `WandbLogger` to your spaCy config file
spaCy config files are used to specify all aspects of training, not just logging -- GPU allocation, optimizer choice, dataset paths, and more. Minimally, under `[training.logger]` you need to provide the key `@loggers` with the value `"spacy.WandbLogger.v3"`, plus a `project_name`.
{{% alert %}}
For more on how spaCy training config files work and on other options you can pass in to customize training, check out [spaCy's documentation](https://spacy.io/usage/training).
{{% /alert %}}
```python
[training.logger]
@loggers = "spacy.WandbLogger.v3"
project_name = "my_spacy_project"
remove_config_values = ["paths.train", "paths.dev", "corpora.train.path", "corpora.dev.path"]
log_dataset_dir = "./corpus"
model_log_interval = 1000
```
| Name | Description |
| ---------------------- | ------------------------------------------------------------------------------------------------------------------------------------------------------------------------------------------------------------------------------------------------------------- |
| `project_name` | `str`. The name of the W&B Project. The project will be created automatically if it doesn’t exist yet. |
| `remove_config_values` | `List[str]` . A list of values to exclude from the config before it is uploaded to W&B. `[]` by default. |
| `model_log_interval` | `Optional int`. `None` by default. If set, enables [model versioning]({{< relref "/guides/core/registry/" >}}) with [Artifacts]({{< relref "/guides/core/artifacts/" >}}). Pass in the number of steps to wait between logging model checkpoints. `None` by default. |
| `log_dataset_dir` | `Optional str`. If passed a path, the dataset will be uploaded as an Artifact at the beginning of training. `None` by default. |
| `entity` | `Optional str` . If passed, the run will be created in the specified entity |
| `run_name` | `Optional str` . If specified, the run will be created with the specified name. |
## Start training
Once you have added the `WandbLogger` to your spaCy training config you can run `spacy train` as usual.
{{< tabpane text=true >}}
{{% tab header="Command Line" value="cli" %}}
```python
python -m spacy train \
config.cfg \
--output ./output \
--paths.train ./train \
--paths.dev ./dev
```
{{% /tab %}}
{{% tab header="Python" value="python" %}}
```python
python -m spacy train \
config.cfg \
--output ./output \
--paths.train ./train \
--paths.dev ./dev
```
{{% /tab %}}
{{% tab header="Python notebook" value="notebook" %}}
```notebook
!python -m spacy train \
config.cfg \
--output ./output \
--paths.train ./train \
--paths.dev ./dev
```
{{% /tab %}}
{{< /tabpane >}}
When training begins, a link to your training run's [W&B page]({{< relref "/guides/models/track/runs/" >}}) will be output which will take you to this run's experiment tracking [dashboard]({{< relref "/guides/models/track/workspaces.md" >}}) in the Weights & Biases web UI.
# Stable Baselines 3
> How to integrate W&B with Stable Baseline 3.
[Stable Baselines 3](https://github.com/DLR-RM/stable-baselines3) \(SB3\) is a set of reliable implementations of reinforcement learning algorithms in PyTorch. W&B's SB3 integration:
* Records metrics such as losses and episodic returns.
* Uploads videos of agents playing the games.
* Saves the trained model.
* Logs the model's hyperparameters.
* Logs the model gradient histograms.
Review an [example](https://wandb.ai/wandb/sb3/runs/1jyr6z10) of a SB3 training run with W&B.
## Log your SB3 experiments
```python
from wandb.integration.sb3 import WandbCallback
model.learn(..., callback=WandbCallback())
```
{{< img src="/images/integrations/stable_baselines_demo.gif" alt="" >}}
## WandbCallback Arguments
| Argument | Usage |
| :--- | :--- |
| `verbose` | The verbosity of sb3 output |
| `model_save_path` | Path to the folder where the model will be saved, The default value is \`None\` so the model is not logged |
| `model_save_freq` | Frequency to save the model |
| `gradient_save_freq` | Frequency to log gradient. The default value is 0 so the gradients are not logged |
## Basic Example
The W&B SB3 integration uses the logs output from TensorBoard to log your metrics
```python
import gym
from stable_baselines3 import PPO
from stable_baselines3.common.monitor import Monitor
from stable_baselines3.common.vec_env import DummyVecEnv, VecVideoRecorder
import wandb
from wandb.integration.sb3 import WandbCallback
config = {
"policy_type": "MlpPolicy",
"total_timesteps": 25000,
"env_name": "CartPole-v1",
}
run = wandb.init(
project="sb3",
config=config,
sync_tensorboard=True, # auto-upload sb3's tensorboard metrics
monitor_gym=True, # auto-upload the videos of agents playing the game
save_code=True, # optional
)
def make_env():
env = gym.make(config["env_name"])
env = Monitor(env) # record stats such as returns
return env
env = DummyVecEnv([make_env])
env = VecVideoRecorder(
env,
f"videos/{run.id}",
record_video_trigger=lambda x: x % 2000 == 0,
video_length=200,
)
model = PPO(config["policy_type"], env, verbose=1, tensorboard_log=f"runs/{run.id}")
model.learn(
total_timesteps=config["total_timesteps"],
callback=WandbCallback(
gradient_save_freq=100,
model_save_path=f"models/{run.id}",
verbose=2,
),
)
run.finish()
```
# TensorBoard
{{< cta-button colabLink="https://github.com/wandb/examples/blob/master/colabs/tensorboard/TensorBoard_and_Weights_and_Biases.ipynb" >}}
{{% alert %}}
W&B support embedded TensorBoard for W&B Multi-tenant SaaS.
{{% /alert %}}
Upload your TensorBoard logs to the cloud, quickly share your results among colleagues and classmates and keep your analysis in one centralized location.
{{< img src="/images/integrations/tensorboard_oneline_code.webp" alt="" >}}
## Get started
```python
import wandb
# Start a wandb run with `sync_tensorboard=True`
wandb.init(project="my-project", sync_tensorboard=True)
# Your training code using TensorBoard
...
# [Optional]Finish the wandb run to upload the tensorboard logs to W&B (if running in Notebook)
wandb.finish()
```
Review an [example](https://wandb.ai/rymc/simple-tensorboard-example/runs/oab614zf/tensorboard).
Once your run finishes, you can access your TensorBoard event files in W&B and you can visualize your metrics in native W&B charts, together with additional useful information like the system's CPU or GPU utilization, the `git` state, the terminal command the run used, and more.
{{% alert %}}
W&B supports TensorBoard with all versions of TensorFlow. W&B also supports TensorBoard 1.14 and higher with PyTorch as well as TensorBoardX.
{{% /alert %}}
## Frequently asked questions
### How can I log metrics to W&B that aren't logged to TensorBoard?
If you need to log additional custom metrics that aren't being logged to TensorBoard, you can call `wandb.log` in your code `wandb.log({"custom": 0.8})`
Setting the step argument in `wandb.log` is turned off when syncing Tensorboard. If you'd like to set a different step count, you can log the metrics with a step metric as:
`wandb.log({"custom": 0.8, "global_step": global_step})`
### How do I configure Tensorboard when I'm using it with `wandb`?
If you want more control over how TensorBoard is patched you can call `wandb.tensorboard.patch` instead of passing `sync_tensorboard=True` to `wandb.init`.
```python
import wandb
wandb.tensorboard.patch(root_logdir="")
wandb.init()
# Finish the wandb run to upload the tensorboard logs to W&B (if running in Notebook)
wandb.finish()
```
You can pass `tensorboard_x=False` to this method to ensure vanilla TensorBoard is patched, if you're using TensorBoard > 1.14 with PyTorch you can pass `pytorch=True` to ensure it's patched. Both of these options have smart defaults depending on what versions of these libraries have been imported.
By default, we also sync the `tfevents` files and any `.pbtxt` files. This enables us to launch a TensorBoard instance on your behalf. You will see a [TensorBoard tab](https://www.wandb.com/articles/hosted-tensorboard) on the run page. This behavior can be turned off by passing `save=False` to `wandb.tensorboard.patch`
```python
import wandb
wandb.init()
wandb.tensorboard.patch(save=False, tensorboard_x=True)
# If running in a notebook, finish the wandb run to upload the tensorboard logs to W&B
wandb.finish()
```
{{% alert color="secondary" %}}
You must call either `wandb.init` or `wandb.tensorboard.patch` **before** calling `tf.summary.create_file_writer` or constructing a `SummaryWriter` via `torch.utils.tensorboard`.
{{% /alert %}}
### How do I sync historical TensorBoard runs?
If you have existing `tfevents` files stored locally and you would like to import them into W&B, you can run `wandb sync log_dir`, where `log_dir` is a local directory containing the `tfevents` files.
### How do I use Google Colab or Jupyter with TensorBoard?
If running your code in a Jupyter or Colab notebook, make sure to call `wandb.finish()` and the end of your training. This will finish the wandb run and upload the tensorboard logs to W&B so they can be visualized. This is not necessary when running a `.py` script as wandb finishes automatically when a script finishes.
To run shell commands in a notebook environment, you must prepend a `!`, as in `!wandb sync directoryname`.
### How do I use PyTorch with TensorBoard?
If you use PyTorch's TensorBoard integration, you may need to manually upload the PyTorch Profiler JSON file.
```python
wandb.save(glob.glob(f"runs/*.pt.trace.json")[0], base_path=f"runs")
```
# TensorFlow
{{< cta-button colabLink="https://colab.research.google.com/drive/1JCpAbjkCFhYMT7LCQ399y35TS3jlMpvM" >}}
## Get started
If you're already using TensorBoard, it's easy to integrate with wandb.
```python
import tensorflow as tf
import wandb
wandb.init(config=tf.flags.FLAGS, sync_tensorboard=True)
```
## Log custom metrics
If you need to log additional custom metrics that aren't being logged to TensorBoard, you can call `wandb.log` in your code `wandb.log({"custom": 0.8}) `
Setting the step argument in `wandb.log` is turned off when syncing Tensorboard. If you'd like to set a different step count, you can log the metrics with a step metric as:
``` python
wandb.log({"custom": 0.8, "global_step":global_step}, step=global_step)
```
## TensorFlow estimators hook
If you want more control over what gets logged, wandb also provides a hook for TensorFlow estimators. It will log all `tf.summary` values in the graph.
```python
import tensorflow as tf
import wandb
wandb.init(config=tf.FLAGS)
estimator.train(hooks=[wandb.tensorflow.WandbHook(steps_per_log=1000)])
```
## Log manually
The simplest way to log metrics in TensorFlow is by logging `tf.summary` with the TensorFlow logger:
```python
import wandb
with tf.Session() as sess:
# ...
wandb.tensorflow.log(tf.summary.merge_all())
```
With TensorFlow 2, the recommended way of training a model with a custom loop is via using `tf.GradientTape`. You can read more about it [here](https://www.tensorflow.org/tutorials/customization/custom_training_walkthrough). If you want to incorporate `wandb` to log metrics in your custom TensorFlow training loops you can follow this snippet:
```python
with tf.GradientTape() as tape:
# Get the probabilities
predictions = model(features)
# Calculate the loss
loss = loss_func(labels, predictions)
# Log your metrics
wandb.log("loss": loss.numpy())
# Get the gradients
gradients = tape.gradient(loss, model.trainable_variables)
# Update the weights
optimizer.apply_gradients(zip(gradients, model.trainable_variables))
```
A full example is available [here](https://www.wandb.com/articles/wandb-customizing-training-loops-in-tensorflow-2).
## How is W&B different from TensorBoard?
When the cofounders started working on W&B, they were inspired to build a tool for the frustrated TensorBoard users at OpenAI. Here are a few things we've focused on improving:
1. **Reproduce models**: Weights & Biases is good for experimentation, exploration, and reproducing models later. We capture not just the metrics, but also the hyperparameters and version of the code, and we can save your version-control status and model checkpoints for you so your project is reproducible.
2. **Automatic organization**: Whether you're picking up a project from a collaborator, coming back from a vacation, or dusting off an old project, W&B makes it easy to see all the models that have been tried so no one wastes hours, GPU cycles, or carbon re-running experiments.
3. **Fast, flexible integration**: Add W&B to your project in 5 minutes. Install our free open-source Python package and add a couple of lines to your code, and every time you run your model you'll have nice logged metrics and records.
4. **Persistent, centralized dashboard**: No matter where you train your models, whether on your local machine, in a shared lab cluster, or on spot instances in the cloud, your results are shared to the same centralized dashboard. You don't need to spend your time copying and organizing TensorBoard files from different machines.
5. **Powerful tables**: Search, filter, sort, and group results from different models. It's easy to look over thousands of model versions and find the best performing models for different tasks. TensorBoard isn't built to work well on large projects.
6. **Tools for collaboration**: Use W&B to organize complex machine learning projects. It's easy to share a link to W&B, and you can use private teams to have everyone sending results to a shared project. We also support collaboration via reports— add interactive visualizations and describe your work in markdown. This is a great way to keep a work log, share findings with your supervisor, or present findings to your lab or team.
Get started with a [free account](https://wandb.ai)
## Examples
We've created a few examples for you to see how the integration works:
* [Example on Github](https://github.com/wandb/examples/blob/master/examples/tensorflow/tf-estimator-mnist/mnist.py): MNIST example Using TensorFlow Estimators
* [Example on Github](https://github.com/wandb/examples/blob/master/examples/tensorflow/tf-cnn-fashion/train.py): Fashion MNIST example Using Raw TensorFlow
* [Wandb Dashboard](https://app.wandb.ai/l2k2/examples-tf-estimator-mnist/runs/p0ifowcb): View result on W&B
* Customizing Training Loops in TensorFlow 2 - [Article](https://www.wandb.com/articles/wandb-customizing-training-loops-in-tensorflow-2) | [Dashboard](https://app.wandb.ai/sayakpaul/custom_training_loops_tf)
# W&B for Julia
> How to integrate W&B with Julia.
For those running machine learning experiments in the Julia programming language, a community contributor has created an unofficial set of Julia bindings called [wandb.jl](https://github.com/avik-pal/Wandb.jl) that you can use.
You can find examples [in the documentation](https://github.com/avik-pal/Wandb.jl/tree/main/docs/src/examples) on the wandb.jl repository. Their "Getting Started" example is here:
```julia
using Wandb, Dates, Logging
# Start a new run, tracking hyperparameters in config
lg = WandbLogger(project = "Wandb.jl",
name = "wandbjl-demo-$(now())",
config = Dict("learning_rate" => 0.01,
"dropout" => 0.2,
"architecture" => "CNN",
"dataset" => "CIFAR-100"))
# Use LoggingExtras.jl to log to multiple loggers together
global_logger(lg)
# Simulating the training or evaluation loop
for x ∈ 1:50
acc = log(1 + x + rand() * get_config(lg, "learning_rate") + rand() + get_config(lg, "dropout"))
loss = 10 - log(1 + x + rand() + x * get_config(lg, "learning_rate") + rand() + get_config(lg, "dropout"))
# Log metrics from your script to W&B
@info "metrics" accuracy=acc loss=loss
end
# Finish the run
close(lg)
```
# XGBoost
> Track your trees with W&B.
{{< cta-button colabLink="https://colab.research.google.com/github/wandb/examples/blob/master/colabs/boosting/Credit_Scorecards_with_XGBoost_and_W%26B.ipynb" >}}
The `wandb` library has a `WandbCallback` callback for logging metrics, configs and saved boosters from training with XGBoost. Here you can see a **[live Weights & Biases dashboard](https://wandb.ai/morg/credit_scorecard)** with outputs from the XGBoost `WandbCallback`.
{{< img src="/images/integrations/xgb_dashboard.png" alt="Weights & Biases dashboard using XGBoost" >}}
## Get started
Logging XGBoost metrics, configs and booster models to Weights & Biases is as easy as passing the `WandbCallback` to XGBoost:
```python
from wandb.integration.xgboost import WandbCallback
import xgboost as XGBClassifier
...
# Start a wandb run
run = wandb.init()
# Pass WandbCallback to the model
bst = XGBClassifier()
bst.fit(X_train, y_train, callbacks=[WandbCallback(log_model=True)])
# Close your wandb run
run.finish()
```
You can open **[this notebook](https://wandb.me/xgboost)** for a comprehensive look at logging with XGBoost and Weights & Biases
## `WandbCallback` reference
### Functionality
Passing `WandbCallback` to a XGBoost model will:
- log the booster model configuration to Weights & Biases
- log evaluation metrics collected by XGBoost, such as rmse, accuracy etc to Weights & Biases
- log training metrics collected by XGBoost (if you provide data to eval_set)
- log the best score and the best iteration
- save and upload your trained model to Weights & Biases Artifacts (when `log_model = True`)
- log feature importance plot when `log_feature_importance=True` (default).
- Capture the best eval metric in `wandb.summary` when `define_metric=True` (default).
### Arguments
- `log_model`: (boolean) if True save and upload the model to Weights & Biases Artifacts
- `log_feature_importance`: (boolean) if True log a feature importance bar plot
- `importance_type`: (str) one of `{weight, gain, cover, total_gain, total_cover}` for tree model. weight for linear model.
- `define_metric`: (boolean) if True (default) capture model performance at the best step, instead of the last step, of training in your `wandb.summary`.
You can review the [source code for WandbCallback](https://github.com/wandb/wandb/blob/main/wandb/integration/xgboost/xgboost.py).
For additional examples, check out the [repository of examples on GitHub](https://github.com/wandb/examples/tree/master/examples/boosting-algorithms).
## Tune your hyperparameters with Sweeps
Attaining the maximum performance out of models requires tuning hyperparameters, like tree depth and learning rate. Weights & Biases includes [Sweeps]({{< relref "/guides/models/sweeps/" >}}), a powerful toolkit for configuring, orchestrating, and analyzing large hyperparameter testing experiments.
{{< cta-button colabLink="https://colab.research.google.com/github/wandb/examples/blob/master/colabs/boosting/Using_W%26B_Sweeps_with_XGBoost.ipynb" >}}
You can also try this [XGBoost & Sweeps Python script](https://github.com/wandb/examples/blob/master/examples/wandb-sweeps/sweeps-xgboost/xgboost_tune.py).
{{< img src="/images/integrations/xgboost_sweeps_example.png" alt="Summary: trees outperform linear learners on this classification dataset." >}}
# YOLOv5
{{< cta-button colabLink="https://colab.research.google.com/github/wandb/examples/blob/master/colabs/yolo/Train_and_Debug_YOLOv5_Models_with_Weights_%26_Biases_.ipynb" >}}
[Ultralytics' YOLOv5](https://ultralytics.com/yolov5) ("You Only Look Once") model family enables real-time object detection with convolutional neural networks without all the agonizing pain.
[Weights & Biases](http://wandb.com) is directly integrated into YOLOv5, providing experiment metric tracking, model and dataset versioning, rich model prediction visualization, and more. **It's as easy as running a single `pip install` before you run your YOLO experiments.**
{{% alert %}}
All W&B logging features are compatible with data-parallel multi-GPU training, such as with [PyTorch DDP](https://pytorch.org/tutorials/intermediate/ddp_tutorial.html).
{{% /alert %}}
## Track core experiments
Simply by installing `wandb`, you'll activate the built-in W&B [logging features]({{< relref "/guides/models/track/log/" >}}): system metrics, model metrics, and media logged to interactive [Dashboards]({{< relref "/guides/models/track/workspaces.md" >}}).
```python
pip install wandb
git clone https://github.com/ultralytics/yolov5.git
python yolov5/train.py # train a small network on a small dataset
```
Just follow the links printed to the standard out by wandb.
{{< img src="/images/integrations/yolov5_experiment_tracking.png" alt="All these charts and more." >}}
## Customize the integration
By passing a few simple command line arguments to YOLO, you can take advantage of even more W&B features.
* If you pass a number to `--save_period`, W&B saves a [model version]({{< relref "/guides/core/registry/" >}}) at the end of every `save_period` epochs. The model version includes the model weights and tags the best-performing model in the validation set.
* Turning on the `--upload_dataset` flag will also upload the dataset for data versioning.
* Passing a number to `--bbox_interval` will turn on [data visualization]({{< relref "../" >}}). At the end of every `bbox_interval` epochs, the outputs of the model on the validation set will be uploaded to W&B.
{{< tabpane text=true >}}
{{% tab header="Model Versioning Only" value="modelversioning" %}}
```python
python yolov5/train.py --epochs 20 --save_period 1
```
{{% /tab %}}
{{% tab header="Model Versioning and Data Visualization" value="bothversioning" %}}
```python
python yolov5/train.py --epochs 20 --save_period 1 \
--upload_dataset --bbox_interval 1
```
{{% /tab %}}
{{< /tabpane >}}
{{% alert %}}
Every W&B account comes with 100 GB of free storage for datasets and models.
{{% /alert %}}
Here's what that looks like.
{{< img src="/images/integrations/yolov5_model_versioning.png" alt="Model Versioning: the latest and the best versions of the model are identified." >}}
{{< img src="/images/integrations/yolov5_data_visualization.png" alt="Data Visualization: compare the input image to the model's outputs and example-wise metrics." >}}
{{% alert %}}
With data and model versioning, you can resume paused or crashed experiments from any device, no setup necessary. Check out [the Colab ](https://wandb.me/yolo-colab) for details.
{{% /alert %}}
# Ultralytics
{{< cta-button colabLink="https://colab.research.google.com/github/wandb/examples/blob/master/colabs/ultralytics/01_train_val.ipynb" >}}
[Ultralytics](https://github.com/ultralytics/ultralytics) is the home for cutting-edge, state-of-the-art computer vision models for tasks like image classification, object detection, image segmentation, and pose estimation. Not only it hosts [YOLOv8](https://docs.ultralytics.com/models/yolov8/), the latest iteration in the YOLO series of real-time object detection models, but other powerful computer vision models such as [SAM (Segment Anything Model)](https://docs.ultralytics.com/models/sam/#introduction-to-sam-the-segment-anything-model), [RT-DETR](https://docs.ultralytics.com/models/rtdetr/), [YOLO-NAS](https://docs.ultralytics.com/models/yolo-nas/), etc. Besides providing implementations of these models, Ultralytics also provides us with out-of-the-box workflows for training, fine-tuning, and applying these models using an easy-to-use API.
## Get started
1. Install `ultralytics` and `wandb`.
{{< tabpane text=true >}}
{{% tab header="Command Line" value="script" %}}
```shell
pip install --upgrade ultralytics==8.0.238 wandb
# or
# conda install ultralytics
```
{{% /tab %}}
{{% tab header="Notebook" value="notebook" %}}
```bash
!pip install --upgrade ultralytics==8.0.238 wandb
```
{{% /tab %}}
{{< /tabpane >}}
The development team has tested the integration with `ultralyticsv8.0.238` and below. To report any issues with the integration, create a [GitHub issue](https://github.com/wandb/wandb/issues/new?template=sdk-bug.yml) with the tag `yolov8`.
## Track experiments and visualize validation results
{{< cta-button colabLink="https://colab.research.google.com/github/wandb/examples/blob/master/colabs/ultralytics/01_train_val.ipynb" >}}
This section demonstrates a typical workflow of using an [Ultralytics](https://docs.ultralytics.com/modes/predict/) model for training, fine-tuning, and validation and performing experiment tracking, model-checkpointing, and visualization of the model's performance using [W&B](https://wandb.ai/site).
You can also check out about the integration in this report: [Supercharging Ultralytics with W&B](https://wandb.ai/geekyrakshit/ultralytics/reports/Supercharging-Ultralytics-with-Weights-Biases--Vmlldzo0OTMyMDI4)
To use the W&B integration with Ultralytics, import the `wandb.integration.ultralytics.add_wandb_callback` function.
```python
import wandb
from wandb.integration.ultralytics import add_wandb_callback
from ultralytics import YOLO
```
Initialize the `YOLO` model of your choice, and invoke the `add_wandb_callback` function on it before performing inference with the model. This ensures that when you perform training, fine-tuning, validation, or inference, it automatically saves the experiment logs and the images, overlaid with both ground-truth and the respective prediction results using the [interactive overlays for computer vision tasks]({{< relref "/guides/models/track/log/media#image-overlays-in-tables" >}}) on W&B along with additional insights in a [`wandb.Table`]({{< relref "/guides/models/tables/" >}}).
```python
# Initialize YOLO Model
model = YOLO("yolov8n.pt")
# Add W&B callback for Ultralytics
add_wandb_callback(model, enable_model_checkpointing=True)
# Train/fine-tune your model
# At the end of each epoch, predictions on validation batches are logged
# to a W&B table with insightful and interactive overlays for
# computer vision tasks
model.train(project="ultralytics", data="coco128.yaml", epochs=5, imgsz=640)
# Finish the W&B run
wandb.finish()
```
Here's how experiments tracked using W&B for an Ultralytics training or fine-tuning workflow looks like:
## Visualize prediction results
{{< cta-button colabLink="https://colab.research.google.com/github/wandb/examples/blob/master/colabs/ultralytics/00_inference.ipynb" >}}
This section demonstrates a typical workflow of using an [Ultralytics](https://docs.ultralytics.com/modes/predict/) model for inference and visualizing the results using [W&B](https://wandb.ai/site).
You can try out the code in Google Colab: [Open in Colab](http://wandb.me/ultralytics-inference).
You can also check out about the integration in this report: [Supercharging Ultralytics with W&B](https://wandb.ai/geekyrakshit/ultralytics/reports/Supercharging-Ultralytics-with-Weights-Biases--Vmlldzo0OTMyMDI4)
In order to use the W&B integration with Ultralytics, we need to import the `wandb.integration.ultralytics.add_wandb_callback` function.
```python
import wandb
from wandb.integration.ultralytics import add_wandb_callback
from ultralytics.engine.model import YOLO
```
Download a few images to test the integration on. You can use still images, videos, or camera sources. For more information on inference sources, check out the [Ultralytics docs](https://docs.ultralytics.com/modes/predict/).
```bash
!wget https://raw.githubusercontent.com/wandb/examples/ultralytics/colabs/ultralytics/assets/img1.png
!wget https://raw.githubusercontent.com/wandb/examples/ultralytics/colabs/ultralytics/assets/img2.png
!wget https://raw.githubusercontent.com/wandb/examples/ultralytics/colabs/ultralytics/assets/img4.png
!wget https://raw.githubusercontent.com/wandb/examples/ultralytics/colabs/ultralytics/assets/img5.png
```
Next, initialize a W&B [run]({{< relref "/guides/models/track/runs/" >}}) using `wandb.init`.
```python
# Initialize W&B run
wandb.init(project="ultralytics", job_type="inference")
```
Next, initialize your desired `YOLO` model and invoke the `add_wandb_callback` function on it before you perform inference with the model. This ensures that when you perform inference, it automatically logs the images overlaid with your [interactive overlays for computer vision tasks]({{< relref "/guides/models/track/log/media#image-overlays-in-tables" >}}) along with additional insights in a [`wandb.Table`]({{< relref "/guides/models/tables/" >}}).
```python
# Initialize YOLO Model
model = YOLO("yolov8n.pt")
# Add W&B callback for Ultralytics
add_wandb_callback(model, enable_model_checkpointing=True)
# Perform prediction which automatically logs to a W&B Table
# with interactive overlays for bounding boxes, segmentation masks
model(
[
"./assets/img1.jpeg",
"./assets/img3.png",
"./assets/img4.jpeg",
"./assets/img5.jpeg",
]
)
# Finish the W&B run
wandb.finish()
```
You do not need to explicitly initialize a run using `wandb.init()` in case of a training or fine-tuning workflow. However, if the code involves only prediction, you must explicitly create a run.
Here's how the interactive bbox overlay looks:
You can fine more information on the W&B image overlays [here]({{< relref "/guides/models/track/log/media.md#image-overlays" >}}).
## More resources
* [Supercharging Ultralytics with Weights & Biases](https://wandb.ai/geekyrakshit/ultralytics/reports/Supercharging-Ultralytics-with-Weights-Biases--Vmlldzo0OTMyMDI4)
* [Object Detection using YOLOv8: An End-to-End Workflow](https://wandb.ai/reviewco/object-detection-bdd/reports/Object-Detection-using-YOLOv8-An-End-to-End-Workflow--Vmlldzo1NTAyMDQ1)
# YOLOX
> How to integrate W&B with YOLOX.
[YOLOX](https://github.com/Megvii-BaseDetection/YOLOX) is an anchor-free version of YOLO with strong performance for object detection. You can use the YOLOX W&B integration to turn on logging of metrics related to training, validation, and the system, and you can interactively validate predictions with a single command-line argument.
## Sign up and create an API key
An API key authenticates your machine to W&B. You can generate an API key from your user profile.
{{% alert %}}
For a more streamlined approach, you can generate an API key by going directly to [https://wandb.ai/authorize](https://wandb.ai/authorize). Copy the displayed API key and save it in a secure location such as a password manager.
{{% /alert %}}
1. Click your user profile icon in the upper right corner.
1. Select **User Settings**, then scroll to the **API Keys** section.
1. Click **Reveal**. Copy the displayed API key. To hide the API key, reload the page.
## Install the `wandb` library and log in
To install the `wandb` library locally and log in:
{{< tabpane text=true >}}
{{% tab header="Command Line" value="cli" %}}
1. Set the `WANDB_API_KEY` [environment variable]({{< relref "/guides/models/track/environment-variables.md" >}}) to your API key.
```bash
export WANDB_API_KEY=
```
1. Install the `wandb` library and log in.
```shell
pip install wandb
wandb login
```
{{% /tab %}}
{{% tab header="Python" value="python" %}}
```bash
pip install wandb
```
```python
import wandb
wandb.login()
```
{{% /tab %}}
{{% tab header="Python notebook" value="python" %}}
```notebook
!pip install wandb
import wandb
wandb.login()
```
{{% /tab %}}
{{< /tabpane >}}
## Log metrics
Use the `--logger wandb` command line argument to turn on logging with wandb. Optionally you can also pass all of the arguments that [`wandb.init`]({{< relref "/ref/python/init" >}}) expects; prepend each argument with `wandb-`.
`num_eval_imges` controls the number of validation set images and predictions that are logged to W&B tables for model evaluation.
```shell
# login to wandb
wandb login
# call your yolox training script with the `wandb` logger argument
python tools/train.py .... --logger wandb \
wandb-project \
wandb-entity
wandb-name \
wandb-id \
wandb-save_dir \
wandb-num_eval_imges \
wandb-log_checkpoints
```
## Example
[Example dashboard with YOLOX training and validation metrics ->](https://wandb.ai/manan-goel/yolox-nano/runs/3pzfeom)
{{< img src="/images/integrations/yolox_example_dashboard.png" alt="" >}}
Any questions or issues about this W&B integration? Open an issue in the [YOLOX repository](https://github.com/Megvii-BaseDetection/YOLOX).
# Launch
> Easily scale and manage ML jobs using W&B Launch.
# Tutorial: W&B Launch basics
> Getting started guide for W&B Launch.
## What is Launch?
{{< cta-button colabLink="https://colab.research.google.com/drive/1wX0OSVxZJDHRsZaOaOEDx-lLUrO1hHgP" >}}
Easily scale training [runs]({{< relref "/guides/models/track/runs/" >}}) from your desktop to a compute resource like Amazon SageMaker, Kubernetes and more with W&B Launch. Once W&B Launch is configured, you can quickly run training scripts, model evaluation suites, prepare models for production inference, and more with a few clicks and commands.
## How it works
Launch is composed of three fundamental components: **launch jobs**, **queues**, and **agents**.
A [*launch job*]({{< relref "./launch-terminology.md#launch-job" >}}) is a blueprint for configuring and running tasks in your ML workflow. Once you have a launch job, you can add it to a [*launch queue*]({{< relref "./launch-terminology.md#launch-queue" >}}). A launch queue is a first-in, first-out (FIFO) queue where you can configure and submit your jobs to a particular compute target resource, such as Amazon SageMaker or a Kubernetes cluster.
As jobs are added to the queue, [*launch agents*]({{< relref "./launch-terminology.md#launch-agent" >}}) poll that queue and execute the job on the system targeted by the queue.
{{< img src="/images/launch/launch_overview.png" alt="" >}}
Based on your use case, you (or someone on your team) will configure the launch queue according to your chosen [compute resource target]({{< relref "./launch-terminology.md#target-resources" >}}) (for example Amazon SageMaker) and deploy a launch agent on your own infrastructure.
See the [Terms and concepts]({{< relref "./launch-terminology.md" >}}) page for more information on launch jobs, how queues work, launch agents, and additional information on how W&B Launch works.
## How to get started
Depending on your use case, explore the following resources to get started with W&B Launch:
* If this is your first time using W&B Launch, we recommend you go through the [Walkthrough]({{< relref "#walkthrough" >}}) guide.
* Learn how to set up [W&B Launch]({{< relref "/launch/set-up-launch/" >}}).
* Create a [launch job]({{< relref "./create-and-deploy-jobs/create-launch-job.md" >}}).
* Check out the W&B Launch [public jobs GitHub repository](https://github.com/wandb/launch-jobs) for templates of common tasks like [deploying to Triton](https://github.com/wandb/launch-jobs/tree/main/jobs/deploy_to_nvidia_triton), [evaluating an LLM](https://github.com/wandb/launch-jobs/tree/main/jobs/openai_evals), or more.
* View launch jobs created from this repository in this public [`wandb/jobs` project](https://wandb.ai/wandb/jobs/jobs) W&B project.
## Walkthrough
This page walks through the basics of the W&B Launch workflow.
{{% alert %}}
W&B Launch runs machine learning workloads in containers. Familiarity with containers is not required but may be helpful for this walkthrough. See the [Docker documentation](https://docs.docker.com/guides/docker-concepts/the-basics/what-is-a-container/) for a primer on containers.
{{% /alert %}}
## Prerequisites
Before you get started, ensure you have satisfied the following prerequisites:
1. Sign up for an account at https://wandb.ai/site and then log in to your W&B account.
2. This walkthrough requires terminal access to a machine with a working Docker CLI and engine. See the [Docker installation guide](https://docs.docker.com/engine/install/) for more information.
3. Install W&B Python SDK version `0.17.1` or higher:
```bash
pip install wandb>=0.17.1
```
4. Within your terminal, execute `wandb login` or set the `WANDB_API_KEY` environment variable to authenticate with W&B.
{{< tabpane text=true >}}
{{% tab "Log in to W&B" %}}
Within your terminal execute:
```bash
wandb login
```
{{% /tab %}}
{{% tab "Environment variable" %}}
```bash
WANDB_API_KEY=
```
Replace `` with your W&B API key.
{{% /tab %}}
{{% /tabpane %}}
## Create a launch job
Create a [launch job]({{< relref "./launch-terminology.md#launch-job" >}}) in one of three ways: with a Docker image, from a git repository or from local source code:
{{< tabpane text=true >}}
{{% tab "With a Docker image" %}}
To run a pre-made container that logs a message to W&B, open a terminal and run the following command:
```bash
wandb launch --docker-image wandb/job_hello_world:main --project launch-quickstart
```
The preceding command downloads and runs the container image `wandb/job_hello_world:main`.
Launch configures the container to report everything logged with `wandb` to the `launch-quickstart` project. The container logs a message to W&B and displays a link to the newly created run in W&B. Click the link to view the run in the W&B UI.
{{% /tab %}}
{{% tab "From a git repository" %}}
To launch the same hello-world job from its [source code in the W&B Launch jobs repository](https://github.com/wandb/launch-jobs), run the following command:
```bash
wandb launch --uri https://github.com/wandb/launch-jobs.git \\
--job-name hello-world-git --project launch-quickstart \\
--build-context jobs/hello_world --dockerfile Dockerfile.wandb \\
--entry-point "python job.py"
```
The command does the following:
1. Clone the [W&B Launch jobs repository](https://github.com/wandb/launch-jobs) to a temporary directory.
2. Create a job named **hello-world-git** in the **hello** project. This job tracks the exact source code and configuration used to run execute the code.
3. Build a container image from the `jobs/hello_world` directory and the `Dockerfile.wandb`.
4. Start the container and run the `job.py` python script.
The console output shows the image build and execution. The output of the container should be nearly identical to the previous example.
{{% /tab %}}
{{% tab "From local source code" %}}
Code not versioned in a git repository can be launched by specifying a local directory path to the `--uri` argument.
Create an empty directory and add a Python script named `train.py` with the following content:
```python
import wandb
with wandb.init() as run:
run.log({"hello": "world"})
```
Add a file `requirements.txt` with the following content:
```text
wandb>=0.17.1
```
From within the directory, run the following command:
```bash
wandb launch --uri . --job-name hello-world-code --project launch-quickstart --entry-point "python train.py"
```
The command does the following:
1. Log the contents of the current directory to W&B as a Code Artifact.
2. Create a job named **hello-world-code** in the **launch-quickstart** project.
3. Build a container image by copying `train.py` and `requirements.txt` into a base image and `pip install` the requirements.
4. Start the container and run `python train.py`.
{{% /tab %}}
{{< /tabpane >}}
## Create a queue
Launch is designed to help teams build workflows around shared compute. In the examples so far, the `wandb launch` command has executed a container synchronously on the local machine. Launch queues and agents enable asynchronous execution of jobs on shared resources and advanced features like prioritization and hyperparameter optimization. To create a basic queue, follow these steps:
1. Navigate to [wandb.ai/launch](https://wandb.ai/launch) and click the **Create a queue** button.
2. Select an **Entity** to associate the queue with.
3. Enter a **Queue name**.
4. Select **Docker** as the **Resource**.
5. Leave **Configuration** blank, for now.
6. Click **Create queue** :rocket:
After clicking the button, the browser will redirect to the **Agents** tab of the queue view. The queue remains in the **Not active** state until an agent starts polling.
{{< img src="/images/launch/create_docker_queue.gif" alt="" >}}
For advanced queue configuration options, see the [advanced queue setup page]({{< relref "/launch/set-up-launch/setup-queue-advanced.md" >}}).
## Connect an agent to the queue
The queue view displays an **Add an agent** button in a red banner at the top of the screen if the queue has no polling agents. Click the button to view copy the command to run an agent. The command should look like the following:
```bash
wandb launch-agent --queue --entity
```
Run the command in a terminal to start the agent. The agent polls the specified queue for jobs to run. Once received, the agent downloads or builds and then executes a container image for the job, as if the `wandb launch` command was run locally.
Navigate back to [the Launch page](https://wandb.ai/launch) and verify that the queue now shows as **Active**.
## Submit a job to the queue
Navigate to your new **launch-quickstart** project in your W&B account and open the jobs tab from the navigation on the left side of the screen.
The **Jobs** page displays a list of W&B Jobs that were created from previously executed runs. Click on your launch job to view source code, dependencies, and any runs created from the job. After completing this walkthrough there should be three jobs in the list.
Pick one of the new jobs and follow these instructions to submit it to the queue:
1. Click the **Launch** button to submit the job to a queue. The **Launch** drawer will appear.
2. Select the **Queue** you created earlier and click **Launch**.
This submits the job to the queue. The agent polling this queue picks up and executes the job. The progress of the job can be monitored from the W&B UI or by inspecting the output of the agent in the terminal.
The `wandb launch` command can push jobs to the queue directly by specifying the `--queue` argument. For example, to submit the hello-world container job to the queue, run the following command:
```bash
wandb launch --docker-image wandb/job_hello_world:main --project launch-quickstart --queue
```
# Launch terms and concepts
With W&B Launch, you enqueue [jobs]({{< relref "#launch-job" >}}) onto [queues]({{< relref "#launch-queue" >}}) to create runs. Jobs are python scripts instrumented with W&B. Queues hold a list of jobs to execute on a [target resource]({{< relref "#target-resources" >}}). [Agents]({{< relref "#launch-agent" >}}) pull jobs from queues and execute the jobs on target resources. W&B tracks launch jobs similarly to how W&B tracks [runs]({{< relref "/guides/models/track/runs/" >}}).
### Launch job
A launch job is a specific type of [W&B Artifact]({{< relref "/guides/core/artifacts/" >}}) that represents a task to complete. For example, common launch jobs include training a model or triggering a model evaluation. Job definitions include:
- Python code and other file assets, including at least one runnable entrypoint.
- Information about the input (config parameter) and output (metrics logged).
- Information about the environment. (for example, `requirements.txt`, base `Dockerfile`).
There are three main kinds of job definitions:
| Job types | Definition | How to run this job type |
| ---------- | --------- | -------------- |
|Artifact-based (or code-based) jobs| Code and other assets are saved as a W&B artifact.| To run artifact-based jobs, Launch agent must be configured with a builder. |
|Git-based jobs| Code and other assets are cloned from a certain commit, branch, or tag in a git repository. | To run git-based jobs, Launch agent must be configured with a builder and git repository credentials. |
|Image-based jobs|Code and other assets are baked into a Docker image. | To run image-based jobs, Launch agent might need to be configured with image repository credentials. |
{{% alert %}}
While Launch jobs can perform activities not related to model training--for example, deploy a model to a Triton inference server--all jobs must call `wandb.init` to complete successfully. This creates a run for tracking purposes in a W&B workspace.
{{% /alert %}}
Find jobs you created in the W&B App under the `Jobs` tab of your project workspace. From there, jobs can be configured and sent to a [launch queue]({{< relref "#launch-queue" >}}) to be executed on a variety of [target resources]({{< relref "#target-resources" >}}).
### Launch queue
Launch *queues* are ordered lists of jobs to execute on a specific target resource. Launch queues are first-in, first-out. (FIFO). There is no practical limit to the number of queues you can have, but a good guideline is one queue per target resource. Jobs can be enqueued with the W&B App UI, W&B CLI or Python SDK. You can then configure one or more Launch agents to pull items from the queue and execute them on the queue's target resource.
### Target resources
The compute environment that a Launch queue is configured to execute jobs on is called the *target resource*.
W&B Launch supports the following target resources:
- [Docker]({{< relref "/launch/set-up-launch/setup-launch-docker.md" >}})
- [Kubernetes]({{< relref "/launch/set-up-launch/setup-launch-kubernetes.md" >}})
- [AWS SageMaker]({{< relref "/launch/set-up-launch/setup-launch-sagemaker.md" >}})
- [GCP Vertex]({{< relref "/launch/set-up-launch/setup-vertex.md" >}})
Each target resource accepts a different set of configuration parameters called *resource configurations*. Resource configurations take on default values defined by each Launch queue, but can be overridden independently by each job. See the documentation for each target resource for more details.
### Launch agent
Launch agents are lightweight, persistent programs that periodically check Launch queues for jobs to execute. When a launch agent receives a job, it first builds or pulls the image from the job definition then runs it on the target resource.
One agent may poll multiple queues, however the agent must be configured properly to support all of the backing target resources for each queue it is polling.
### Launch agent environment
The agent environment is the environment where a launch agent is running, polling for jobs.
{{% alert %}}
The agent's runtime environment is independent of a queue's target resource. In other words, agents can be deployed anywhere as long as they are configured sufficiently to access the required target resources.
{{% /alert %}}
# Set up Launch
This page describes the high-level steps required to set up W&B Launch:
1. **Set up a queue**: Queues are FIFO and possess a queue configuration. A queue's configuration controls where and how jobs are executed on a target resource.
2. **Set up an agent**: Agents run on your machine/infrastructure and poll one or more queues for launch jobs. When a job is pulled, the agent ensures that the image is built and available. The agent then submits the job to the target resource.
## Set up a queue
Launch queues must be configured to point to a specific target resource along with any additional configuration specific to that resource. For example, a launch queue that points to a Kubernetes cluster might include environment variables or set a custom namespace its launch queue configuration. When you create a queue, you will specify both the target resource you want to use and the configuration for that resource to use.
When an agent receives a job from a queue, it also receives the queue configuration. When the agent submits the job to the target resource, it includes the queue configuration along with any overrides from the job itself. For example, you can use a job configuration to specify the Amazon SageMaker instance type for that job instance only. In this case, it is common to use [queue config templates]({{< relref "./setup-queue-advanced.md#configure-queue-template" >}}) as the end user interface.
### Create a queue
1. Navigate to Launch App at [wandb.ai/launch](https://wandb.ai/launch).
2. Click the **create queue** button on the top right of the screen.
{{< img src="/images/launch/create-queue.gif" alt="" >}}
3. From the **Entity** dropdown menu, select the entity the queue will belong to.
4. Provide a name for your queue in the **Queue** field.
5. From the **Resource** dropdown, select the compute resource you want jobs added to this queue to use.
6. Choose whether to allow **Prioritization** for this queue. If prioritization is enabled, a user on your team can define a priority for their launch job when they enqueue them. Higher priority jobs are executed before lower priority jobs.
7. Provide a resource configuration in either JSON or YAML format in the **Configuration** field. The structure and semantics of your configuration document will depend on the resource type that the queue is pointing to. For more details, see the dedicated set up page for your target resource.
## Set up a launch agent
Launch agents are long running processes that poll one or more launch queues for jobs. Launch agents dequeue jobs in first in, first out (FIFO) order or in priority order depending on the queues they pull from. When an agent dequeues a job from a queue, it optionally builds an image for that job. The agent then submits the job to the target resource along with configuration options specified in the queue configuration.
{{% alert %}}
Agents are highly flexible and can be configured to support a wide variety of use cases. The required configuration for your agent will depend on your specific use case. See the dedicated page for [Docker]({{< relref "./setup-launch-docker.md" >}}), [Amazon SageMaker]({{< relref "./setup-launch-sagemaker.md" >}}), [Kubernetes]({{< relref "./setup-launch-kubernetes.md" >}}), or [Vertex AI]({{< relref "./setup-vertex.md" >}}).
{{% /alert %}}
{{% alert %}}
W&B recommends you start agents with a service account's API key, rather than a specific user's API key. There are two benefits to using a service account's API key:
1. The agent isn't dependent on an individual user.
2. The author associated with a run created through Launch is viewed by Launch as the user who submitted the launch job, rather than the user associated with the agent.
{{% /alert %}}
### Agent configuration
Configure the launch agent with a YAML file named `launch-config.yaml`. By default, W&B checks for the config file in `~/.config/wandb/launch-config.yaml`. You can optionally specify a different directory when you activate the launch agent.
The contents of your launch agent's configuration file will depend on your launch agent's environment, the launch queue's target resource, Docker builder requirements, cloud registry requirements, and so forth.
Independent of your use case, there are core configurable options for the launch agent:
* `max_jobs`: maximum number of jobs the agent can execute in parallel
* `entity`: the entity that the queue belongs to
* `queues`: the name of one or more queues for the agent to watch
{{% alert %}}
You can use the W&B CLI to specify universal configurable options for the launch agent (instead of the config YAML file): maximum number of jobs, W&B entity, and launch queues. See the [`wandb launch-agent`]({{< relref "/ref/cli/wandb-launch-agent.md" >}}) command for more information.
{{% /alert %}}
The following YAML snippet shows how to specify core launch agent config keys:
```yaml title="launch-config.yaml"
# Max number of concurrent runs to perform. -1 = no limit
max_jobs: -1
entity:
# List of queues to poll.
queues:
-
```
### Configure a container builder
The launch agent can be configured to build images. You must configure the agent to use a container builder if you intend to use launch jobs created from git repositories or code artifacts. See the [Create a launch job]({{< relref "../create-and-deploy-jobs/create-launch-job.md" >}}) for more information on how to create a launch job.
W&B Launch supports three builder options:
* Docker: The Docker builder uses a local Docker daemon to build images.
* [Kaniko](https://github.com/GoogleContainerTools/kaniko): Kaniko is a Google project that enables image building in environments where a Docker daemon is unavailable.
* Noop: The agent will not try to build jobs, and instead only pull pre-built images.
{{% alert %}}
Use the Kaniko builder if your agent is polling in an environment where a Docker daemon is unavailable (for example, a Kubernetes cluster).
See the [Set up Kubernetes]({{< relref "./setup-launch-kubernetes.md" >}}) for details about the Kaniko builder.
{{% /alert %}}
To specify an image builder, include the builder key in your agent configuration. For example, the following code snippet shows a portion of the launch config (`launch-config.yaml`) that specifies to use Docker or Kaniko:
```yaml title="launch-config.yaml"
builder:
type: docker | kaniko | noop
```
### Configure a container registry
In some cases, you might want to connect a launch agent to a cloud registry. Common scenarios where you might want to connect a launch agent to a cloud registry include:
* You want to run a job in an envirnoment other than where you built it, such as a powerful workstation or cluster.
* You want to use the agent to build images and run these images on Amazon SageMaker or VertexAI.
* You want the launch agent to provide credentials to pull from an image repository.
To learn more about how to configure the agent to interact with a container registry, see the [Advanced agent set]({{< relref "./setup-agent-advanced.md" >}}) up page.
## Activate the launch agent
Activate the launch agent with the `launch-agent` W&B CLI command:
```bash
wandb launch-agent -q -q --max-jobs 5
```
In some use cases, you might want to have a launch agent polling queues from within a Kubernetes cluster. See the [Advanced queue set up page]({{< relref "./setup-queue-advanced.md" >}}) for more information.
# Create and deploy jobs
# Create sweeps with W&B Launch
> Discover how to automate hyperparamter sweeps on launch.
{{< cta-button colabLink="https://colab.research.google.com/drive/1WxLKaJlltThgZyhc7dcZhDQ6cjVQDfil#scrollTo=AFEzIxA6foC7" >}}
Create a hyperparameter tuning job ([sweeps]({{< relref "/guides/models/sweeps/" >}})) with W&B Launch. With sweeps on launch, a sweep scheduler is pushed to a Launch Queue with the specified hyperparameters to sweep over. The sweep scheduler starts as it is picked up by the agent, launching sweep runs onto the same queue with chosen hyperparameters. This continues until the sweep finishes or is stopped.
You can use the default W&B Sweep scheduling engine or implement your own custom scheduler:
1. Standard sweep scheduler: Use the default W&B Sweep scheduling engine that controls [W&B Sweeps]({{< relref "/guides/models/sweeps/" >}}). The familiar `bayes`, `grid`, and `random` methods are available.
2. Custom sweep scheduler: Configure the sweep scheduler to run as a job. This option enables full customization. An example of how to extend the standard sweep scheduler to include more logging can be found in the section below.
{{% alert %}}
This guide assumes that W&B Launch has been previously configured. If W&B Launch has is not configured, see the [how to get started]({{< relref "./#how-to-get-started" >}}) section of the launch documentation.
{{% /alert %}}
{{% alert %}}
We recommend you create a sweep on launch using the 'basic' method if you are a first time users of sweeps on launch. Use a custom sweeps on launch scheduler when the standard W&B scheduling engine does not meet your needs.
{{% /alert %}}
## Create a sweep with a W&B standard scheduler
Create W&B Sweeps with Launch. You can create a sweep interactively with the W&B App or programmatically with the W&B CLI. For advanced configurations of Launch sweeps, including the ability to customize the scheduler, use the CLI.
{{% alert %}}
Before you create a sweep with W&B Launch, ensure that you first create a job to sweep over. See the [Create a Job]({{< relref "./create-and-deploy-jobs/create-launch-job.md" >}}) page for more information.
{{% /alert %}}
{{< tabpane text=true >}}
{{% tab "W&B app" %}}
Create a sweep interactively with the W&B App.
1. Navigate to your W&B project on the W&B App.
2. Select the sweeps icon on the left panel (broom image).
3. Next, select the **Create Sweep** button.
4. Click the **Configure Launch 🚀** button.
5. From the **Job** dropdown menu, select the name of your job and the job version you want to create a sweep from.
6. Select a queue to run the sweep on using the **Queue** dropdown menu.
8. Use the **Job Priority** dropdown to specify the priority of your launch job. A launch job's priority is set to "Medium" if the launch queue does not support prioritization.
8. (Optional) Configure override args for the run or sweep scheduler. For example, using the scheduler overrides, configure the number of concurrent runs the scheduler manages using `num_workers`.
9. (Optional) Select a project to save the sweep to using the **Destination Project** dropdown menu.
10. Click **Save**
11. Select **Launch Sweep**.
{{< img src="/images/launch/create_sweep_with_launch.png" alt="" >}}
{{% /tab %}}
{{% tab "CLI" %}}
Programmatically create a W&B Sweep with Launch with the W&B CLI.
1. Create a Sweep configuration
2. Specify the full job name within your sweep configuration
3. Initialize a sweep agent.
{{% alert %}}
Steps 1 and 3 are the same steps you normally take when you create a W&B Sweep.
{{% /alert %}}
For example, in the following code snippet, we specify `'wandb/jobs/Hello World 2:latest'` for the job value:
```yaml
# launch-sweep-config.yaml
job: 'wandb/jobs/Hello World 2:latest'
description: sweep examples using launch jobs
method: bayes
metric:
goal: minimize
name: loss_metric
parameters:
learning_rate:
max: 0.02
min: 0
distribution: uniform
epochs:
max: 20
min: 0
distribution: int_uniform
# Optional scheduler parameters:
# scheduler:
# num_workers: 1 # concurrent sweep runs
# docker_image:
# resource:
# resource_args: # resource arguments passed to runs
# env:
# - WANDB_API_KEY
# Optional Launch Params
# launch:
# registry:
```
For information on how to create a sweep configuration, see the [Define sweep configuration]({{< relref "/guides/models/sweeps/define-sweep-configuration.md" >}}) page.
4. Next, initialize a sweep. Provide the path to your config file, the name of your job queue, your W&B entity, and the name of the project.
```bash
wandb launch-sweep --queue --entity --project
```
For more information on W&B Sweeps, see the [Tune Hyperparameters]({{< relref "/guides/models/sweeps/" >}}) chapter.
{{% /tab %}}
{{< /tabpane >}}
## Create a custom sweep scheduler
Create a custom sweep scheduler either with the W&B scheduler or a custom scheduler.
{{% alert %}}
Using scheduler jobs requires wandb cli version >= `0.15.4`
{{% /alert %}}
{{< tabpane text=true >}}
{{% tab "W&B scheduler" %}}
Create a launch sweep using the W&B sweep scheduling logic as a job.
1. Identify the Wandb scheduler job in the public wandb/sweep-jobs project, or use the job name:
`'wandb/sweep-jobs/job-wandb-sweep-scheduler:latest'`
2. Construct a configuration yaml with an additional `scheduler` block that includes a `job` key pointing to this name, example below.
3. Use the `wandb launch-sweep` command with the new config.
Example config:
```yaml
# launch-sweep-config.yaml
description: Launch sweep config using a scheduler job
scheduler:
job: wandb/sweep-jobs/job-wandb-sweep-scheduler:latest
num_workers: 8 # allows 8 concurrent sweep runs
# training/tuning job that the sweep runs will execute
job: wandb/sweep-jobs/job-fashion-MNIST-train:latest
method: grid
parameters:
learning_rate:
min: 0.0001
max: 0.1
```
{{% /tab %}}
{{% tab "Custom scheduler" %}}
Custom schedulers can be created by creating a scheduler-job. For the purposes of this guide we will be modifying the `WandbScheduler` to provide more logging.
1. Clone the `wandb/launch-jobs` repo (specifically: `wandb/launch-jobs/jobs/sweep_schedulers`)
2. Now, we can modify the `wandb_scheduler.py` to achieve our desired increased logging. Example: Add logging to the function `_poll`. This is called once every polling cycle (configurable timing), before we launch new sweep runs.
3. Run the modified file to create a job, with: `python wandb_scheduler.py --project --entity --name CustomWandbScheduler`
4. Identify the name of the job created, either in the UI or in the output of the previous call, which will be a code-artifact job (unless otherwise specified).
5. Now create a sweep configuration where the scheduler points to your new job.
```yaml
...
scheduler:
job: '//job-CustomWandbScheduler:latest'
...
```
{{% /tab %}}
{{% tab "Optuna scheduler" %}}
Optuna is a hyperparameter optimization framework that uses a variety of algorithms to find the best hyperparameters for a given model (similar to W&B). In addition to the [sampling algorithms](https://optuna.readthedocs.io/en/stable/reference/samplers/index.html), Optuna also provides a variety of [pruning algorithms](https://optuna.readthedocs.io/en/stable/reference/pruners.html) that can be used to terminate poorly performing runs early. This is especially useful when running a large number of runs, as it can save time and resources. The classes are highly configurable, just pass in the expected parameters in the `scheduler.settings.pruner/sampler.args` block of the config file.
Create a launch sweep using Optuna's scheduling logic with a job.
1. First, create your own job or use a pre-built Optuna scheduler image job.
* See the [`wandb/launch-jobs`](https://github.com/wandb/launch-jobs/blob/main/jobs/sweep_schedulers) repo for examples on how to create your own job.
* To use a pre-built Optuna image, you can either navigate to `job-optuna-sweep-scheduler` in the `wandb/sweep-jobs` project or use can use the job name: `wandb/sweep-jobs/job-optuna-sweep-scheduler:latest`.
2. After you create a job, you can now create a sweep. Construct a sweep config that includes a `scheduler` block with a `job` key pointing to the Optuna scheduler job (example below).
```yaml
# optuna_config_basic.yaml
description: A basic Optuna scheduler
job: wandb/sweep-jobs/job-fashion-MNIST-train:latest
run_cap: 5
metric:
name: epoch/val_loss
goal: minimize
scheduler:
job: wandb/sweep-jobs/job-optuna-sweep-scheduler:latest
resource: local-container # required for scheduler jobs sourced from images
num_workers: 2
# optuna specific settings
settings:
pruner:
type: PercentilePruner
args:
percentile: 25.0 # kill 75% of runs
n_warmup_steps: 10 # pruning turned off for first x steps
parameters:
learning_rate:
min: 0.0001
max: 0.1
```
3. Lastly, launch the sweep to an active queue with the launch-sweep command:
```bash
wandb launch-sweep -q -p -e
```
For the exact implementation of the Optuna sweep scheduler job, see [wandb/launch-jobs](https://github.com/wandb/launch-jobs/blob/main/jobs/sweep_schedulers/optuna_scheduler/optuna_scheduler.py). For more examples of what is possible with the Optuna scheduler, check out [wandb/examples](https://github.com/wandb/examples/tree/master/examples/launch/launch-sweeps/optuna-scheduler).
{{% /tab %}}
{{< /tabpane >}}
Examples of what is possible with custom sweep scheduler jobs are available in the [wandb/launch-jobs](https://github.com/wandb/launch-jobs) repo under `jobs/sweep_schedulers`. This guide shows how to use the publicly available **Wandb Scheduler Job**, as well demonstrates a process for creating custom sweep scheduler jobs.
## How to resume sweeps on launch
It is also possible to resume a launch-sweep from a previously launched sweep. Although hyperparameters and the training job cannot be changed, scheduler-specific parameters can be, as well as the queue it is pushed to.
{{% alert %}}
If the initial sweep used a training job with an alias like 'latest', resuming can lead to different results if the latest job version has been changed since the last run.
{{% /alert %}}
1. Identify the sweep name/ID for a previously run launch sweep. The sweep ID is an eight character string (for example, `hhd16935`) that you can find in your project on the W&B App.
2. If you change the scheduler parameters, construct an updated config file.
3. In your terminal, execute the following command. Replace content wrapped in `<` and `>` with your information:
```bash
wandb launch-sweep --resume_id --queue
```
# Launch FAQ
# Launch integration guides
# Set up Launch
This page describes the high-level steps required to set up W&B Launch:
1. **Set up a queue**: Queues are FIFO and possess a queue configuration. A queue's configuration controls where and how jobs are executed on a target resource.
2. **Set up an agent**: Agents run on your machine/infrastructure and poll one or more queues for launch jobs. When a job is pulled, the agent ensures that the image is built and available. The agent then submits the job to the target resource.
## Set up a queue
Launch queues must be configured to point to a specific target resource along with any additional configuration specific to that resource. For example, a launch queue that points to a Kubernetes cluster might include environment variables or set a custom namespace its launch queue configuration. When you create a queue, you will specify both the target resource you want to use and the configuration for that resource to use.
When an agent receives a job from a queue, it also receives the queue configuration. When the agent submits the job to the target resource, it includes the queue configuration along with any overrides from the job itself. For example, you can use a job configuration to specify the Amazon SageMaker instance type for that job instance only. In this case, it is common to use [queue config templates]({{< relref "./setup-queue-advanced.md#configure-queue-template" >}}) as the end user interface.
### Create a queue
1. Navigate to Launch App at [wandb.ai/launch](https://wandb.ai/launch).
2. Click the **create queue** button on the top right of the screen.
{{< img src="/images/launch/create-queue.gif" alt="" >}}
3. From the **Entity** dropdown menu, select the entity the queue will belong to.
4. Provide a name for your queue in the **Queue** field.
5. From the **Resource** dropdown, select the compute resource you want jobs added to this queue to use.
6. Choose whether to allow **Prioritization** for this queue. If prioritization is enabled, a user on your team can define a priority for their launch job when they enqueue them. Higher priority jobs are executed before lower priority jobs.
7. Provide a resource configuration in either JSON or YAML format in the **Configuration** field. The structure and semantics of your configuration document will depend on the resource type that the queue is pointing to. For more details, see the dedicated set up page for your target resource.
## Set up a launch agent
Launch agents are long running processes that poll one or more launch queues for jobs. Launch agents dequeue jobs in first in, first out (FIFO) order or in priority order depending on the queues they pull from. When an agent dequeues a job from a queue, it optionally builds an image for that job. The agent then submits the job to the target resource along with configuration options specified in the queue configuration.
{{% alert %}}
Agents are highly flexible and can be configured to support a wide variety of use cases. The required configuration for your agent will depend on your specific use case. See the dedicated page for [Docker]({{< relref "./setup-launch-docker.md" >}}), [Amazon SageMaker]({{< relref "./setup-launch-sagemaker.md" >}}), [Kubernetes]({{< relref "./setup-launch-kubernetes.md" >}}), or [Vertex AI]({{< relref "./setup-vertex.md" >}}).
{{% /alert %}}
{{% alert %}}
W&B recommends you start agents with a service account's API key, rather than a specific user's API key. There are two benefits to using a service account's API key:
1. The agent isn't dependent on an individual user.
2. The author associated with a run created through Launch is viewed by Launch as the user who submitted the launch job, rather than the user associated with the agent.
{{% /alert %}}
### Agent configuration
Configure the launch agent with a YAML file named `launch-config.yaml`. By default, W&B checks for the config file in `~/.config/wandb/launch-config.yaml`. You can optionally specify a different directory when you activate the launch agent.
The contents of your launch agent's configuration file will depend on your launch agent's environment, the launch queue's target resource, Docker builder requirements, cloud registry requirements, and so forth.
Independent of your use case, there are core configurable options for the launch agent:
* `max_jobs`: maximum number of jobs the agent can execute in parallel
* `entity`: the entity that the queue belongs to
* `queues`: the name of one or more queues for the agent to watch
{{% alert %}}
You can use the W&B CLI to specify universal configurable options for the launch agent (instead of the config YAML file): maximum number of jobs, W&B entity, and launch queues. See the [`wandb launch-agent`]({{< relref "/ref/cli/wandb-launch-agent.md" >}}) command for more information.
{{% /alert %}}
The following YAML snippet shows how to specify core launch agent config keys:
```yaml title="launch-config.yaml"
# Max number of concurrent runs to perform. -1 = no limit
max_jobs: -1
entity:
# List of queues to poll.
queues:
-
```
### Configure a container builder
The launch agent can be configured to build images. You must configure the agent to use a container builder if you intend to use launch jobs created from git repositories or code artifacts. See the [Create a launch job]({{< relref "../create-and-deploy-jobs/create-launch-job.md" >}}) for more information on how to create a launch job.
W&B Launch supports three builder options:
* Docker: The Docker builder uses a local Docker daemon to build images.
* [Kaniko](https://github.com/GoogleContainerTools/kaniko): Kaniko is a Google project that enables image building in environments where a Docker daemon is unavailable.
* Noop: The agent will not try to build jobs, and instead only pull pre-built images.
{{% alert %}}
Use the Kaniko builder if your agent is polling in an environment where a Docker daemon is unavailable (for example, a Kubernetes cluster).
See the [Set up Kubernetes]({{< relref "./setup-launch-kubernetes.md" >}}) for details about the Kaniko builder.
{{% /alert %}}
To specify an image builder, include the builder key in your agent configuration. For example, the following code snippet shows a portion of the launch config (`launch-config.yaml`) that specifies to use Docker or Kaniko:
```yaml title="launch-config.yaml"
builder:
type: docker | kaniko | noop
```
### Configure a container registry
In some cases, you might want to connect a launch agent to a cloud registry. Common scenarios where you might want to connect a launch agent to a cloud registry include:
* You want to run a job in an envirnoment other than where you built it, such as a powerful workstation or cluster.
* You want to use the agent to build images and run these images on Amazon SageMaker or VertexAI.
* You want the launch agent to provide credentials to pull from an image repository.
To learn more about how to configure the agent to interact with a container registry, see the [Advanced agent set]({{< relref "./setup-agent-advanced.md" >}}) up page.
## Activate the launch agent
Activate the launch agent with the `launch-agent` W&B CLI command:
```bash
wandb launch-agent -q -q --max-jobs 5
```
In some use cases, you might want to have a launch agent polling queues from within a Kubernetes cluster. See the [Advanced queue set up page]({{< relref "./setup-queue-advanced.md" >}}) for more information.
# Configure launch queue
The following page describes how to configure launch queue options.
## Set up queue config templates
Administer and manage guardrails on compute consumption with Queue Config Templates. Set defaults, minimums, and maximum values for fields such as memory consumption, GPU, and runtime duration.
After you configure a queue with config templates, members of your team can alter fields you defined only within the specified range you defined.
### Configure queue template
You can configure a queue template on an existing queue or create a new queue.
1. Navigate to the Launch App at [https://wandb.ai/launch](https://wandb.ai/launch).
2. Select **View queue** next to the name of the queue you want to add a template to.
3. Select the **Config** tab. This will show information about your queue such as when the queue was created, the queue config, and existing launch-time overrides.
4. Navigate to the **Queue config** section.
5. Identify the config key-values you want to create a template for.
6. Replace the value in the config with a template field. Template fields take the form of `{{variable-name}}`.
7. Click on the **Parse configuration** button. When you parse your configuration, W&B will automatically create tiles below the queue config for each template you created.
8. For each tile generated, you must first specify the data type (string, integer, or float) the queue config can allow. To do this, select the data type from the **Type** dropdown menu.
9. Based on your data type, complete the fields that appear within each tile.
10. Click on **Save config**.
For example, suppose you want to create a template that limits which AWS instances your team can use. Before you add a template field, your queue config might look something similar to:
```yaml title="launch config"
RoleArn: arn:aws:iam:region:account-id:resource-type/resource-id
ResourceConfig:
InstanceType: ml.m4.xlarge
InstanceCount: 1
VolumeSizeInGB: 2
OutputDataConfig:
S3OutputPath: s3://bucketname
StoppingCondition:
MaxRuntimeInSeconds: 3600
```
When you add a template field for the `InstanceType`, your config will look like:
```yaml title="launch config"
RoleArn: arn:aws:iam:region:account-id:resource-type/resource-id
ResourceConfig:
InstanceType: "{{aws_instance}}"
InstanceCount: 1
VolumeSizeInGB: 2
OutputDataConfig:
S3OutputPath: s3://bucketname
StoppingCondition:
MaxRuntimeInSeconds: 3600
```
Next, you click on **Parse configuration**. A new tile labeled `aws-instance` will appear underneath the **Queue config**.
From there, you select String as the datatype from the **Type** dropdown. This will populate fields where you can specify values a user can choose from. For example, in the following image the admin of the team configured two different AWS instance types that users can choose from (`ml.m4.xlarge` and `ml.p3.xlarge`):
{{< img src="/images/launch/aws_template_example.png" alt="" >}}
## Dynamically configure launch jobs
Queue configs can be dynamically configured using macros that are evaluated when the agent dequeues a job from the queue. You can set the following macros:
| Macro | Description |
|-------------------|-------------------------------------------------------|
| `${project_name}` | The name of the project the run is being launched to. |
| `${entity_name}` | The owner of the project the run being launched to. |
| `${run_id}` | The id of the run being launched. |
| `${run_name}` | The name of the run that is launching. |
| `${image_uri}` | The URI of the container image for this run. |
{{% alert %}}
Any custom macro not listed in the preceding table (for example `${MY_ENV_VAR}`), is substituted with an environment variable from the agent's environment.
{{% /alert %}}
## Use the launch agent to build images that execute on accelerators (GPUs)
You might need to specify an accelerator base image if you use launch to build images that are executed in an accelerator environment.
This accelerator base image must satisfy the following requirements:
- Debian compatibility (the Launch Dockerfile uses apt-get to fetch python)
- Compatibility CPU & GPU hardware instruction set (Make sure your CUDA version is supported by the GPU you intend on using)
- Compatibility between the accelerator version you provide and the packages installed in your ML algorithm
- Packages installed that require extra steps for setting up compatibility with hardware
### How to use GPUs with TensorFlow
Ensure TensorFlow properly utilizes your GPU. To accomplish this, specify a Docker image and its image tag for the `builder.accelerator.base_image` key in the queue resource configuration.
For example, the `tensorflow/tensorflow:latest-gpu` base image ensures TensorFlow properly uses your GPU. This can be configured using the resource configuration in the queue.
The following JSON snippet demonstrates how to specify the TensorFlow base image in your queue config:
```json title="Queue config"
{
"builder": {
"accelerator": {
"base_image": "tensorflow/tensorflow:latest-gpu"
}
}
}
```
# Set up launch agent
# Advanced agent setup
This guide provides information on how to set up the W&B Launch agent to build container images in different environments.
{{% alert %}}
Build is only required for git and code artifact jobs. Image jobs do not require build.
See [Create a launch job]({{< relref "../create-and-deploy-jobs/create-launch-job.md" >}}) for more information on job types.
{{% /alert %}}
## Builders
The Launch agent can build images using [Docker](https://docs.docker.com/) or [Kaniko](https://github.com/GoogleContainerTools/kaniko).
* Kaniko: builds a container image in Kubernetes without running the build as a privileged container.
* Docker: builds a container image by executing a `docker build` command locally.
The builder type can be controlled by the `builder.type` key in the launch agent config to either `docker`, `kaniko`, or `noop` to turn off build. By default, the agent helm chart sets the `builder.type` to `noop`. Additional keys in the `builder` section will be used to configure the build process.
If no builder is specified in the agent config and a working `docker` CLI is found, the agent will default to using Docker. If Docker is not available the agent will default to `noop`.
{{% alert %}}
Use Kaniko for building images in a Kubernetes cluster. Use Docker for all other cases.
{{% /alert %}}
## Pushing to a container registry
The launch agent tags all images it builds with a unique source hash. The agent pushes the image to the registry specified in the `builder.destination` key.
For example, if the `builder.destination` key is set to `my-registry.example.com/my-repository`, the agent will tag and push the image to `my-registry.example.com/my-repository:`. If the image exists in the registry, the build is skipped.
### Agent configuration
If you are deploying the agent via our Helm chart, the agent config should be provided in the `agentConfig` key in the `values.yaml` file.
If you are invoking the agent yourself with `wandb launch-agent`, you can provide the agent config as a path to a YAML file with the `--config` flag. By default, the config will be loaded from `~/.config/wandb/launch-config.yaml`.
Within your launch agent config (`launch-config.yaml`), provide the name of the target resource environment and the container registry for the `environment` and `registry` keys, respectively.
The following tabs demonstrates how to configure the launch agent based on your environment and registry.
{{< tabpane text=true >}}
{{% tab "AWS" %}}
The AWS environment configuration requires the region key. The region should be the AWS region that the agent runs in.
```yaml title="launch-config.yaml"
environment:
type: aws
region:
builder:
type:
# URI of the ECR repository where the agent will store images.
# Make sure the region matches what you have configured in your
# environment.
destination: .ecr..amazonaws.com/
# If using Kaniko, specify the S3 bucket where the agent will store the
# build context.
build-context-store: s3:///
```
The agent uses boto3 to load the default AWS credentials. See the [boto3 documentation](https://boto3.amazonaws.com/v1/documentation/api/latest/index.html) for more information on how to configure default AWS credentials.
{{% /tab %}}
{{% tab "GCP" %}}
The Google Cloud environment requires region and project keys. Set `region` to the region that the agent runs in. Set `project` to the Google Cloud project that the agent runs in. The agent uses `google.auth.default()` in Python to load the default credentials.
```yaml title="launch-config.yaml"
environment:
type: gcp
region:
project:
builder:
type:
# URI of the Artifact Registry repository and image name where the agent
# will store images. Make sure the region and project match what you have
# configured in your environment.
uri: -docker.pkg.dev///
# If using Kaniko, specify the GCS bucket where the agent will store the
# build context.
build-context-store: gs:///
```
See the [`google-auth` documentation](https://google-auth.readthedocs.io/en/latest/reference/google.auth.html#google.auth.default) for more information on how to configure default GCP credentials so they are available to the agent.
{{% /tab %}}
{{% tab "Azure" %}}
The Azure environment does not require any additional keys. When the agent starts, it use `azure.identity.DefaultAzureCredential()` to load the default Azure credentials.
```yaml title="launch-config.yaml"
environment:
type: azure
builder:
type:
# URI of the Azure Container Registry repository where the agent will store images.
destination: https://.azurecr.io/
# If using Kaniko, specify the Azure Blob Storage container where the agent
# will store the build context.
build-context-store: https://.blob.core.windows.net/
```
See the [`azure-identity` documentation](https://learn.microsoft.com/python/api/azure-identity/azure.identity.defaultazurecredential?view=azure-python) for more information on how to configure default Azure credentials.
{{% /tab %}}
{{< /tabpane >}}
## Agent permissions
The agent permissions required vary by use case.
### Cloud registry permissions
Below are the permissions that are generally required by launch agents to interact with cloud registries.
{{< tabpane text=true >}}
{{% tab "AWS" %}}
```yaml
{
'Version': '2012-10-17',
'Statement':
[
{
'Effect': 'Allow',
'Action':
[
'ecr:CreateRepository',
'ecr:UploadLayerPart',
'ecr:PutImage',
'ecr:CompleteLayerUpload',
'ecr:InitiateLayerUpload',
'ecr:DescribeRepositories',
'ecr:DescribeImages',
'ecr:BatchCheckLayerAvailability',
'ecr:BatchDeleteImage',
],
'Resource': 'arn:aws:ecr:::repository/',
},
{
'Effect': 'Allow',
'Action': 'ecr:GetAuthorizationToken',
'Resource': '*',
},
],
}
```
{{% /tab %}}
{{% tab "GCP" %}}
```js
artifactregistry.dockerimages.list;
artifactregistry.repositories.downloadArtifacts;
artifactregistry.repositories.list;
artifactregistry.repositories.uploadArtifacts;
```
{{% /tab %}}
{{% tab "Azure" %}}
Add the [`AcrPush` role](https://learn.microsoft.com/azure/role-based-access-control/built-in-roles/containers#acrpush) if you use the Kaniko builder.
{{% /tab %}}
{{< /tabpane >}}
### Storage permissions for Kaniko
The launch agent requires permission to push to cloud storage if the agent uses the Kaniko builder. Kaniko uses a context store outside of the pod running the build job.
{{< tabpane text=true >}}
{{% tab "AWS" %}}
The recommended context store for the Kaniko builder on AWS is Amazon S3. The following policy can be used to give the agent access to an S3 bucket:
```json
{
"Version": "2012-10-17",
"Statement": [
{
"Sid": "ListObjectsInBucket",
"Effect": "Allow",
"Action": ["s3:ListBucket"],
"Resource": ["arn:aws:s3:::"]
},
{
"Sid": "AllObjectActions",
"Effect": "Allow",
"Action": "s3:*Object",
"Resource": ["arn:aws:s3:::/*"]
}
]
}
```
{{% /tab %}}
{{% tab "GCP" %}}
On GCP, the following IAM permissions are required for the agent to upload build contexts to GCS:
```js
storage.buckets.get;
storage.objects.create;
storage.objects.delete;
storage.objects.get;
```
{{% /tab %}}
{{% tab "Azure" %}}
The [Storage Blob Data Contributor](https://learn.microsoft.com/azure/role-based-access-control/built-in-roles#storage-blob-data-contributor) role is required in order for the agent to upload build contexts to Azure Blob Storage.
{{% /tab %}}
{{< /tabpane >}}
## Customizing the Kaniko build
Specify the Kubernetes Job spec that the Kaniko job uses in the `builder.kaniko-config` key of the agent configuration. For example:
```yaml title="launch-config.yaml"
builder:
type: kaniko
build-context-store:
destination:
build-job-name: wandb-image-build
kaniko-config:
spec:
template:
spec:
containers:
- args:
- "--cache=false" # Args must be in the format "key=value"
env:
- name: "MY_ENV_VAR"
value: "my-env-var-value"
```
## Deploy Launch agent into CoreWeave
Optionally deploy the W&B Launch agent to CoreWeave Cloud infrastructure. CoreWeave is a cloud infrastructure that is purpose built for GPU-accelerated workloads.
For information on how to deploy the Launch agent to CoreWeave, see the [CoreWeave documentation](https://docs.coreweave.com/partners/weights-and-biases#integration).
{{% alert %}}
You will need to create a [CoreWeave account](https://cloud.coreweave.com/login) in order to deploy the Launch agent into a CoreWeave infrastructure.
{{% /alert %}}
# Tutorial: Set up W&B Launch on Kubernetes
You can use W&B Launch to push ML workloads to a Kubernetes cluster, giving ML engineers a simple interface right in W&B to use the resources you already manage with Kubernetes.
W&B maintains an [official Launch agent image](https://hub.docker.com/r/wandb/launch-agent) that can be deployed to your cluster with a [Helm chart](https://github.com/wandb/helm-charts/tree/main/charts/launch-agent) that W&B maintains.
W&B uses the [Kaniko](https://github.com/GoogleContainerTools/kaniko) builder to enable the Launch agent to build Docker images in a Kubernetes cluster. To learn more on how to set up Kaniko for the Launch agent, or how to turn off job building and only use prebuilt Docker images, see [Advanced agent set up]({{< relref "./setup-agent-advanced.md" >}}).
{{% alert %}}
To install Helm and apply or upgrade W&B's Launch agent Helm chart, you need `kubectl` access to the cluster with sufficient permissions to create, update, and delete Kubernetes resources. Typically, a user with cluster-admin or a custom role with equivalent permissions is required.
{{% /alert %}}
## Configure a queue for Kubernetes
The Launch queue configuration for a Kubernetes target resource will resemble either a [Kubernetes Job spec](https://kubernetes.io/docs/concepts/workloads/controllers/job/) or a [Kubernetes Custom Resource spec](https://kubernetes.io/docs/concepts/extend-kubernetes/api-extension/custom-resources/).
You can control any aspect of the Kubernetes workload resource spec when you create a Launch queue.
{{< tabpane text=true >}}
{{% tab "Kubernetes job spec" %}}
```yaml
spec:
template:
spec:
containers:
- env:
- name: MY_ENV_VAR
value: some-value
resources:
requests:
cpu: 1000m
memory: 1Gi
metadata:
labels:
queue: k8s-test
namespace: wandb
```
{{% /tab %}}
{{% tab "Custom resource spec" %}}
In some use cases, you might want to use `CustomResource` definitions. `CustomResource` definitions are useful if, for example, you want to perform multi-node distributed training. See the tutorial for using Launch with multi-node jobs using Volcano for an example application. Another use case might be that you want to use W&B Launch with Kubeflow.
The following YAML snippet shows a sample Launch queue config that uses Kubeflow:
```yaml
kubernetes:
kind: PyTorchJob
spec:
pytorchReplicaSpecs:
Master:
replicas: 1
template:
spec:
containers:
- name: pytorch
image: '${image_uri}'
imagePullPolicy: Always
restartPolicy: Never
Worker:
replicas: 2
template:
spec:
containers:
- name: pytorch
image: '${image_uri}'
imagePullPolicy: Always
restartPolicy: Never
ttlSecondsAfterFinished: 600
metadata:
name: '${run_id}-pytorch-job'
apiVersion: kubeflow.org/v1
```
{{% /tab %}}
{{< /tabpane >}}
For security reasons, W&B will inject the following resources into your Launch queue if they are not specified:
- `securityContext`
- `backOffLimit`
- `ttlSecondsAfterFinished`
The following YAML snippet demonstrates how these values will appear in your launch queue:
```yaml title="example-spec.yaml"
spec:
template:
`backOffLimit`: 0
ttlSecondsAfterFinished: 60
securityContext:
allowPrivilegeEscalation: False,
capabilities:
drop:
- ALL,
seccompProfile:
type: "RuntimeDefault"
```
## Create a queue
Create a queue in the W&B App that uses Kubernetes as its compute resource:
1. Navigate to the [Launch page](https://wandb.ai/launch).
2. Click on the **Create Queue** button.
3. Select the **Entity** you would like to create the queue in.
4. Provide a name for your queue in the **Name** field.
5. Select **Kubernetes** as the **Resource**.
6. Within the **Configuration** field, provide the Kubernetes Job workflow spec or Custom Resource spec you [configured in the previous section]({{< relref "#configure-a-queue-for-kubernetes" >}}).
## Configure a Launch agent with Helm
Use the [Helm chart](https://github.com/wandb/helm-charts/tree/main/charts/launch-agent) provided by W&B to deploy the Launch agent into your Kubernetes cluster. Control the behavior of the launch agent with the `values.yaml` [file](https://github.com/wandb/helm-charts/blob/main/charts/launch-agent/values.yaml).
Specify the contents that would normally by defined in your launch agent config file (`~/.config/wandb/launch-config.yaml`) within the `launchConfig` key in the`values.yaml` file.
For example, suppose you have Launch agent config that enables you to run a Launch agent in EKS that uses the Kaniko Docker image builder:
```yaml title="launch-config.yaml"
queues:
-
max_jobs:
environment:
type: aws
region: us-east-1
registry:
type: ecr
uri:
builder:
type: kaniko
build-context-store:
```
Within your `values.yaml` file, this might look like:
```yaml title="values.yaml"
agent:
labels: {}
# W&B API key.
apiKey: ''
# Container image to use for the agent.
image: wandb/launch-agent:latest
# Image pull policy for agent image.
imagePullPolicy: Always
# Resources block for the agent spec.
resources:
limits:
cpu: 1000m
memory: 1Gi
# Namespace to deploy launch agent into
namespace: wandb
# W&B api url (Set yours here)
baseUrl: https://api.wandb.ai
# Additional target namespaces that the launch agent can deploy into
additionalTargetNamespaces:
- default
- wandb
# This should be set to the literal contents of your launch agent config.
launchConfig: |
queues:
-
max_jobs:
environment:
type: aws
region:
registry:
type: ecr
uri:
builder:
type: kaniko
build-context-store:
# The contents of a git credentials file. This will be stored in a k8s secret
# and mounted into the agent container. Set this if you want to clone private
# repos.
gitCreds: |
# Annotations for the wandb service account. Useful when setting up workload identity on gcp.
serviceAccount:
annotations:
iam.gke.io/gcp-service-account:
azure.workload.identity/client-id:
# Set to access key for azure storage if using kaniko with azure.
azureStorageAccessKey: ''
```
For more information on registries, environments, and required agent permissions see [Advanced agent set up]({{< relref "./setup-agent-advanced.md" >}}).
# Tutorial: Set up W&B Launch on SageMaker
You can use W&B Launch to submit launch jobs to Amazon SageMaker to train machine learning models using provided or custom algorithms on the SageMaker platform. SageMaker takes care of spinning up and releasing compute resources, so it can be a good choice for teams without an EKS cluster.
Launch jobs sent to a W&B Launch queue connected to Amazon SageMaker are executed as SageMaker Training Jobs with the [CreateTrainingJob API](https://docs.aws.amazon.com/sagemaker/latest/APIReference/API_CreateTrainingJob.html). Use the launch queue configuration to control arguments sent to the `CreateTrainingJob` API.
Amazon SageMaker [uses Docker images to execute training jobs](https://docs.aws.amazon.com/sagemaker/latest/dg/your-algorithms-training-algo-dockerfile.html). Images pulled by SageMaker must be stored in the Amazon Elastic Container Registry (ECR). This means that the image you use for training must be stored on ECR.
{{% alert %}}
This guide shows how to execute SageMaker Training Jobs. For information on how to deploy to models for inference on Amazon SageMaker, see [this example Launch job](https://github.com/wandb/launch-jobs/tree/main/jobs/deploy_to_sagemaker_endpoints).
{{% /alert %}}
## Prerequisites
Before you get started, ensure you satisfy the following prerequisites:
* [Decide if you want the Launch agent to build a Docker image for you.]({{< relref "#decide-if-you-want-the-launch-agent-to-build-a-docker-images" >}})
* [Set up AWS resources and gather information about S3, ECR, and Sagemaker IAM roles.]({{< relref "#set-up-aws-resources" >}})
* [Create an IAM role for the Launch agent]({{< relref "#create-an-iam-role-for-launch-agent" >}}).
### Decide if you want the Launch agent to build a Docker images
Decide if you want the W&B Launch agent to build a Docker image for you. There are two options you can choose from:
* Permit the launch agent build a Docker image, push the image to Amazon ECR, and submit [SageMaker Training](https://docs.aws.amazon.com/sagemaker/latest/APIReference/API_CreateTrainingJob.html) jobs for you. This option can offer some simplicity to ML Engineers rapidly iterating over training code.
* The launch agent uses an existing Docker image that contains your training or inference scripts. This option works well with existing CI systems. If you choose this option, you will need to manually upload your Docker image to your container registry on Amazon ECR.
### Set up AWS resources
Ensure you have the following AWS resources configured in your preferred AWS region:
1. An [ECR repository](https://docs.aws.amazon.com/AmazonECR/latest/userguide/repository-create.html) to store container images.
2. One or more [S3 buckets](https://docs.aws.amazon.com/AmazonS3/latest/userguide/create-bucket-overview.html) to store inputs and outputs for your SageMaker Training jobs.
3. An IAM role for Amazon SageMaker that permits SageMaker to run training jobs and interact with Amazon ECR and Amazon S3.
Make a note of the ARNs for these resources. You will need the ARNs when you define the [Launch queue configuration]({{< relref "#configure-launch-queue-for-sagemaker" >}}).
### Create a IAM Policy for Launch agent
1. From the IAM screen in AWS, create a new policy.
2. Toggle to the JSON policy editor, then paste the following policy based on your use case. Substitute values enclosed with `<>` with your own values:
{{< tabpane text=true >}}
{{% tab "Agent submits pre-built Docker image" %}}
```json
{
"Version": "2012-10-17",
"Statement": [
{
"Effect": "Allow",
"Action": [
"logs:DescribeLogStreams",
"SageMaker:AddTags",
"SageMaker:CreateTrainingJob",
"SageMaker:DescribeTrainingJob"
],
"Resource": "arn:aws:sagemaker:::*"
},
{
"Effect": "Allow",
"Action": "iam:PassRole",
"Resource": "arn:aws:iam:::role/"
},
{
"Effect": "Allow",
"Action": "kms:CreateGrant",
"Resource": "",
"Condition": {
"StringEquals": {
"kms:ViaService": "SageMaker..amazonaws.com",
"kms:GrantIsForAWSResource": "true"
}
}
}
]
}
```
{{% /tab %}}
{{% tab "Agent builds and submits Docker image" %}}
```json
{
"Version": "2012-10-17",
"Statement": [
{
"Effect": "Allow",
"Action": [
"logs:DescribeLogStreams",
"SageMaker:AddTags",
"SageMaker:CreateTrainingJob",
"SageMaker:DescribeTrainingJob"
],
"Resource": "arn:aws:sagemaker:::*"
},
{
"Effect": "Allow",
"Action": "iam:PassRole",
"Resource": "arn:aws:iam:::role/"
},
{
"Effect": "Allow",
"Action": [
"ecr:CreateRepository",
"ecr:UploadLayerPart",
"ecr:PutImage",
"ecr:CompleteLayerUpload",
"ecr:InitiateLayerUpload",
"ecr:DescribeRepositories",
"ecr:DescribeImages",
"ecr:BatchCheckLayerAvailability",
"ecr:BatchDeleteImage"
],
"Resource": "arn:aws:ecr:::repository/"
},
{
"Effect": "Allow",
"Action": "ecr:GetAuthorizationToken",
"Resource": "*"
},
{
"Effect": "Allow",
"Action": "kms:CreateGrant",
"Resource": "",
"Condition": {
"StringEquals": {
"kms:ViaService": "SageMaker..amazonaws.com",
"kms:GrantIsForAWSResource": "true"
}
}
}
]
}
```
{{% /tab %}}
{{< /tabpane >}}
3. Click **Next**.
4. Give the policy a name and description.
5. Click **Create policy**.
### Create an IAM role for Launch agent
The Launch agent needs permission to create Amazon SageMaker training jobs. Follow the procedure below to create an IAM role:
1. From the IAM screen in AWS, create a new role.
2. For **Trusted Entity**, select **AWS Account** (or another option that suits your organization's policies).
3. Scroll through the permissions screen and select the policy name you just created above.
4. Give the role a name and description.
5. Select **Create role**.
6. Note the ARN for the role. You will specify the ARN when you set up the launch agent.
For more information on how to create IAM role, see the [AWS Identity and Access Management Documentation](https://docs.aws.amazon.com/IAM/latest/UserGuide/introduction.html).
{{% alert %}}
* If you want the launch agent to build images, see the [Advanced agent set up]({{< relref "./setup-agent-advanced.md" >}}) for additional permissions required.
* The `kms:CreateGrant` permission for SageMaker queues is required only if the associated ResourceConfig has a specified VolumeKmsKeyId and the associated role does not have a policy that permits this action.
{{% /alert %}}
## Configure launch queue for SageMaker
Next, create a queue in the W&B App that uses SageMaker as its compute resource:
1. Navigate to the [Launch App](https://wandb.ai/launch).
3. Click on the **Create Queue** button.
4. Select the **Entity** you would like to create the queue in.
5. Provide a name for your queue in the **Name** field.
6. Select **SageMaker** as the **Resource**.
7. Within the **Configuration** field, provide information about your SageMaker job. By default, W&B will populate a YAML and JSON `CreateTrainingJob` request body:
```json
{
"RoleArn": "",
"ResourceConfig": {
"InstanceType": "ml.m4.xlarge",
"InstanceCount": 1,
"VolumeSizeInGB": 2
},
"OutputDataConfig": {
"S3OutputPath": ""
},
"StoppingCondition": {
"MaxRuntimeInSeconds": 3600
}
}
```
You must at minimum specify:
- `RoleArn` : ARN of the SageMaker execution IAM role (see [prerequisites]({{< relref "#prerequisites" >}})). Not to be confused with the launch **agent** IAM role.
- `OutputDataConfig.S3OutputPath` : An Amazon S3 URI specifying where SageMaker outputs will be stored.
- `ResourceConfig`: Required specification of a resource config. Options for resource config are outlined [here](https://docs.aws.amazon.com/sagemaker/latest/APIReference/API_ResourceConfig.html).
- `StoppingCondition`: Required specification of the stopping conditions for the training job. Options outlined [here](https://docs.aws.amazon.com/sagemaker/latest/APIReference/API_StoppingCondition.html).
7. Click on the **Create Queue** button.
## Set up the launch agent
The following section describes where you can deploy your agent and how to configure your agent based on where it is deployed.
There are [several options for how the Launch agent is deployed for a Amazon SageMaker]({{< relref "#decide-where-to-run-the-launch-agent" >}}) queue: on a local machine, on an EC2 instance, or in an EKS cluster. [Configure your launch agent appropriately]({{< relref "#configure-a-launch-agent" >}}) based on the where you deploy your agent.
### Decide where to run the Launch agent
For production workloads and for customers who already have an EKS cluster, W&B recommends deploying the Launch agent to the EKS cluster using this Helm chart.
For production workloads without an current EKS cluster, an EC2 instance is a good option. Though the launch agent instance will keep running all the time, the agent doesn't need more than a `t2.micro` sized EC2 instance which is relatively affordable.
For experimental or solo use cases, running the Launch agent on your local machine can be a fast way to get started.
Based on your use case, follow the instructions provided in the following tabs to properly configure up your launch agent:
{{< tabpane text=true >}}
{{% tab "EKS" %}}
W&B strongly encourages that you use the[ W&B managed helm chart](https://github.com/wandb/helm-charts/tree/main/charts/launch-agent) to install the agent in an EKS cluster.
{{% /tab %}}
{{% tab "EC2" %}}
Navigate to the Amazon EC2 Dashboard and complete the following steps:
1. Click **Launch instance**.
2. Provide a name for the **Name** field. Optionally add a tag.
2. From the **Instance type**, select an instance type for your EC2 container. You do not need more than 1vCPU and 1GiB of memory (for example a t2.micro).
3. Create a key pair for your organization within the **Key pair (login)** field. You will use this key pair to [connect to your EC2 instance](https://docs.aws.amazon.com/AWSEC2/latest/UserGuide/connect.html) with SSH client at a later step.
2. Within **Network settings**, select an appropriate security group for your organization.
3. Expand **Advanced details**. For **IAM instance profile**, select the launch agent IAM role you created above.
2. Review the **Summary** field. If correct, select **Launch instance**.
Navigate to **Instances** within the left panel of the EC2 Dashboard on AWS. Ensure that the EC2 instance you created is running (see the **Instance state** column). Once you confirm your EC2 instance is running, navigate to your local machine's terminal and complete the following:
1. Select **Connect**.
2. Select the **SSH client** tab and following the instructions outlined to connect to your EC2 instance.
3. Within your EC2 instance, install the following packages:
```bash
sudo yum install python311 -y && python3 -m ensurepip --upgrade && pip3 install wandb && pip3 install wandb[launch]
```
4. Next, install and start Docker within your EC2 instance:
```bash
sudo yum update -y && sudo yum install -y docker python3 && sudo systemctl start docker && sudo systemctl enable docker && sudo usermod -a -G docker ec2-user
newgrp docker
```
Now you can proceed to setting up the Launch agent config.
{{% /tab %}}
{{% tab "Local machine" %}}
Use the AWS config files located at `~/.aws/config` and `~/.aws/credentials` to associate a role with an agent that is polling on a local machine. Provide the IAM role ARN that you created for the launch agent in the previous step.
```yaml title="~/.aws/config"
[profile SageMaker-agent]
role_arn = arn:aws:iam:::role/
source_profile = default
```
```yaml title="~/.aws/credentials"
[default]
aws_access_key_id=
aws_secret_access_key=
aws_session_token=
```
Note that session tokens have a [max length](https://docs.aws.amazon.com/cli/latest/reference/sts/get-session-token.html#description) of 1 hour or 3 days depending on the principal they are associated with.
{{% /tab %}}
{{< /tabpane >}}
### Configure a launch agent
Configure the launch agent with a YAML config file named `launch-config.yaml`.
By default, W&B will check for the config file in `~/.config/wandb/launch-config.yaml`. You can optionally specify a different directory when you activate the launch agent with the `-c` flag.
The following YAML snippet demonstrates how to specify the core config agent options:
```yaml title="launch-config.yaml"
max_jobs: -1
queues:
-
environment:
type: aws
region:
registry:
type: ecr
uri:
builder:
type: docker
```
Now start the agent with `wandb launch-agent`
## (Optional) Push your launch job Docker image to Amazon ECR
{{% alert %}}
This section applies only if your launch agent uses existing Docker images that contain your training or inference logic. [There are two options on how your launch agent behaves.]({{< relref "#decide-if-you-want-the-launch-agent-to-build-a-docker-images" >}})
{{% /alert %}}
Upload your Docker image that contains your launch job to your Amazon ECR repo. Your Docker image needs to be in your ECR registry before you submit new launch jobs if you are using image-based jobs.
# Tutorial: Set up W&B Launch on Vertex AI
You can use W&B Launch to submit jobs for execution as Vertex AI training jobs. With Vertex AI training jobs, you can train machine learning models using either provided, or custom algorithms on the Vertex AI platform. Once a launch job is initiated, Vertex AI manages the underlying infrastructure, scaling, and orchestration.
W&B Launch works with Vertex AI through the `CustomJob` class in the `google-cloud-aiplatform` SDK. The parameters of a `CustomJob` can be controlled with the launch queue configuration. Vertex AI cannot be configured to pull images from a private registry outside of GCP. This means that you must store container images in GCP or in a public registry if you want to use Vertex AI with W&B Launch. See the Vertex AI documentation for more information on making container images accessible to Vertex jobs.
## Prerequisites
1. **Create or access a GCP project with the Vertex AI API enabled.** See the [GCP API Console docs](https://support.google.com/googleapi/answer/6158841?hl=en) for more information on enabling an API.
2. **Create a GCP Artifact Registry repository** to store images you want to execute on Vertex. See the [GCP Artifact Registry documentation](https://cloud.google.com/artifact-registry/docs/overview) for more information.
3. **Create a staging GCS bucket** for Vertex AI to store its metadata. Note that this bucket must be in the same region as your Vertex AI workloads in order to be used as a staging bucket. The same bucket can be used for staging and build contexts.
4. **Create a service account** with the necessary permissions to spin up Vertex AI jobs. See the [GCP IAM documentation](https://cloud.google.com/iam/docs/creating-managing-service-accounts) for more information on assigning permissions to service accounts.
5. **Grant your service account permission to manage Vertex jobs**
| Permission | Resource Scope | Description |
| ------------------------------ | --------------------- | ---------------------------------------------------------------------------------------- |
| `aiplatform.customJobs.create` | Specified GCP Project | Allows creation of new machine learning jobs within the project. |
| `aiplatform.customJobs.list` | Specified GCP Project | Allows listing of machine learning jobs within the project. |
| `aiplatform.customJobs.get` | Specified GCP Project | Allows retrieval of information about specific machine learning jobs within the project. |
{{% alert %}}
If you want your Vertex AI workloads to assume the identity of a non-standard service account, refer to the Vertex AI documentation for instructions on service account creation and necessary permissions. The `spec.service_account` field of the launch queue configuration can be used to select a custom service account for your W&B runs.
{{% /alert %}}
## Configure a queue for Vertex AI
The queue configuration for Vertex AI resources specify inputs to the `CustomJob` constructor in the Vertex AI Python SDK, and the `run` method of the `CustomJob`. Resource configurations are stored under the `spec` and `run` keys:
- The `spec` key contains values for the named arguments of the [`CustomJob` constructor](https://cloud.google.com/vertex-ai/docs/pipelines/customjob-component) in the Vertex AI Python SDK.
- The `run` key contains values for the named arguments of the `run` method of the `CustomJob` class in the Vertex AI Python SDK.
Customizations of the execution environment happens primarily in the `spec.worker_pool_specs` list. A worker pool spec defines a group of workers that will run your job. The worker spec in the default config asks for a single `n1-standard-4` machine with no accelerators. You can change the machine type, accelerator type and count to suit your needs.
For more information on available machine types and accelerator types, see the [Vertex AI documentation](https://cloud.google.com/vertex-ai/docs/reference/rest/v1/MachineSpec).
## Create a queue
Create a queue in the W&B App that uses Vertex AI as its compute resource:
1. Navigate to the [Launch page](https://wandb.ai/launch).
2. Click on the **Create Queue** button.
3. Select the **Entity** you would like to create the queue in.
4. Provide a name for your queue in the **Name** field.
5. Select **GCP Vertex** as the **Resource**.
6. Within the **Configuration** field, provide information about your Vertex AI `CustomJob` you defined in the previous section. By default, W&B will populate a YAML and JSON request body similar to the following:
```yaml
spec:
worker_pool_specs:
- machine_spec:
machine_type: n1-standard-4
accelerator_type: ACCELERATOR_TYPE_UNSPECIFIED
accelerator_count: 0
replica_count: 1
container_spec:
image_uri: ${image_uri}
staging_bucket:
run:
restart_job_on_worker_restart: false
```
7. After you configure your queue, click on the **Create Queue** button.
You must at minimum specify:
- `spec.worker_pool_specs` : non-empty list of worker pool specifications.
- `spec.staging_bucket` : GCS bucket to be used for staging Vertex AI assets and metadata.
{{% alert color="secondary" %}}
Some of the Vertex AI docs show worker pool specifications with all keys in camel case,for example, ` workerPoolSpecs`. The Vertex AI Python SDK uses snake case for these keys, for example `worker_pool_specs`.
Every key in the launch queue configuration should use snake case.
{{% /alert %}}
## Configure a launch agent
The launch agent is configurable through a config file that is, by default, located at `~/.config/wandb/launch-config.yaml`.
```yaml
max_jobs:
queues:
-
```
If you want the launch agent to build images for you that are executed in Vertex AI, see [Advanced agent set up]({{< relref "./setup-agent-advanced.md" >}}).
## Set up agent permissions
There are multiple methods to authenticate as this service account. This can be achieved through Workload Identity, a downloaded service account JSON, environment variables, the Google Cloud Platform command-line tool, or a combination of these methods.
# Tutorial: Set up W&B Launch with Docker
The following guide describes how to configure W&B Launch to use Docker on a local machine for both the launch agent environment and for the queue's target resource.
Using Docker to execute jobs and as the launch agent's environment on the same local machine is particularly useful if your compute is installed on a machine that does not have a cluster management system (such as Kubernetes).
You can also use Docker queues to run workloads on powerful workstations.
{{% alert %}}
This set up is common for users who perform experiments on their local machine, or that have a remote machine that they SSH in to, to submit launch jobs.
{{% /alert %}}
When you use Docker with W&B Launch, W&B will first build an image, and then build and run a container from that image. The image is built with the Docker `docker run ` command. The queue configuration is interpreted as additional arguments that are passed to the `docker run` command.
## Configure a Docker queue
The launch queue configuration (for a Docker target resource) accepts the same options defined in the [`docker run`]({{< relref "/ref/cli/wandb-docker-run.md" >}}) CLI command.
The agent receives options defined in the queue configuration. The agent then merges the received options with any overrides from the launch job’s configuration to produce a final `docker run` command that is executed on the target resource (in this case, a local machine).
There are two syntax transformations that take place:
1. Repeated options are defined in the queue configuration as a list.
2. Flag options are defined in the queue configuration as a Boolean with the value `true`.
For example, the following queue configuration:
```json
{
"env": ["MY_ENV_VAR=value", "MY_EXISTING_ENV_VAR"],
"volume": "/mnt/datasets:/mnt/datasets",
"rm": true,
"gpus": "all"
}
```
Results in the following `docker run` command:
```bash
docker run \
--env MY_ENV_VAR=value \
--env MY_EXISTING_ENV_VAR \
--volume "/mnt/datasets:/mnt/datasets" \
--rm \
--gpus all
```
Volumes can be specified either as a list of strings, or a single string. Use a list if you specify multiple volumes.
Docker automatically passes environment variables, that are not assigned a value, from the launch agent environment. This means that, if the launch agent has an environment variable `MY_EXISTING_ENV_VAR`, that environment variable is available in the container. This is useful if you want to use other config keys without publishing them in the queue configuration.
The `--gpus` flag of the `docker run` command allows you to specify GPUs that are available to a Docker container. For more information on how to use the `gpus` flag, see the [Docker documentation](https://docs.docker.com/config/containers/resource_constraints/#gpu).
{{% alert %}}
* Install the [NVIDIA Container Toolkit](https://docs.nvidia.com/datacenter/cloud-native/container-toolkit/install-guide.html#docker) to use GPUs within a Docker container.
* If you build images from a code or artifact-sourced job, you can override the base image used by the [agent]({{< relref "#configure-a-launch-agent-on-a-local-machine" >}}) to include the NVIDIA Container Toolkit.
For example, within your launch queue, you can override the base image to `tensorflow/tensorflow:latest-gpu`:
```json
{
"builder": {
"accelerator": {
"base_image": "tensorflow/tensorflow:latest-gpu"
}
}
}
```
{{% /alert %}}
## Create a queue
Create a queue that uses Docker as compute resource with the W&B CLI:
1. Navigate to the [Launch page](https://wandb.ai/launch).
2. Click on the **Create Queue** button.
3. Select the **Entity** you would like to create the queue in.
4. Enter a name for your queue in the **Name** field.
5. Select **Docker** as the **Resource**.
6. Define your Docker queue configuration in the **Configuration** field.
7. Click on the **Create Queue** button to create the queue.
## Configure a launch agent on a local machine
Configure the launch agent with a YAML config file named `launch-config.yaml`. By default, W&B will check for the config file in `~/.config/wandb/launch-config.yaml`. You can optionally specify a different directory when you activate the launch agent.
{{% alert %}}
You can use the W&B CLI to specify core configurable options for the launch agent (instead of the config YAML file): maximum number of jobs, W&B entity, and launch queues. See the [`wandb launch-agent`]({{< relref "/ref/cli/wandb-launch-agent.md" >}}) command for more information.
{{% /alert %}}
## Core agent config options
The following tabs demonstrate how to specify the core config agent options with the W&B CLI and with a YAML config file:
{{< tabpane text=true >}}
{{% tab "W&B CLI" %}}
```bash
wandb launch-agent -q --max-jobs
```
{{% /tab %}}
{{% tab "Config file" %}}
```yaml title="launch-config.yaml"
max_jobs:
queues:
-
```
{{% /tab %}}
{{< /tabpane >}}
## Docker image builders
The launch agent on your machine can be configured to build Docker images. By default, these images are stored on your machine’s local image repository. To enable your launch agent to build Docker images, set the `builder` key in the launch agent config to `docker`:
```yaml title="launch-config.yaml"
builder:
type: docker
```
If you don't want the agent to build Docker images, and instead use prebuilt images from a registry, set the `builder` key in the launch agent config to `noop`
```yaml title="launch-config.yaml"
builder:
type: noop
```
## Container registries
Launch uses external container registeries such as Dockerhub, Google Container Registry, Azure Container Registry, and Amazon ECR.
If you want to run a job on a different environment from where you built it, configure your agent to be able to pull from a container registry.
To learn more about how connect the launch agent with a cloud registry, see the [Advanced agent setup]({{< relref "./setup-agent-advanced.md#agent-configuration" >}}) page.
# Create and deploy jobs
# Add job to queue
The following page describes how to add launch jobs to a launch queue.
{{% alert %}}
Ensure that you, or someone on your team, has already configured a launch queue. For more information, see the [Set up Launch]({{< relref "/launch/set-up-launch/" >}}) page.
{{% /alert %}}
## Add jobs to your queue
Add jobs to your queue interactively with the W&B App or programmatically with the W&B CLI.
{{< tabpane text=true >}}
{{% tab "W&B app" %}}
Add a job to your queue programmatically with the W&B App.
1. Navigate to your W&B Project Page.
2. Select the **Jobs** icon on the left panel:
{{< img src="/images/launch/project_jobs_tab_gs.png" alt="" >}}
3. The **Jobs** page displays a list of W&B launch jobs that were created from previously executed W&B runs.
{{< img src="/images/launch/view_jobs.png" alt="" >}}
4. Select the **Launch** button next to the name of the Job name. A modal will appear on the right side of the page.
5. From the **Job version** dropdown, select the version of hte launch job you want to use. Launch jobs are versioned like any other [W&B Artifact]({{< relref "/guides/core/artifacts/create-a-new-artifact-version.md" >}}). Different versions of the same launch job will be created if you make modifications to the software dependencies or source code used to run the job.
6. Within the **Overrides** section, provide new values for any inputs that are configured for your launch job. Common overrides include a new entrypoint command, arguments, or values in the `wandb.config` of your new W&B run.
{{< img src="/images/launch/create_starter_queue_gs.png" alt="" >}}
You can copy and paste values from other W&B runs that used your launch job by clicking on the **Paste from...** button.
7. From the **Queue** dropdown, select the name of the launch queue you want to add your launch job to.
8. Use the **Job Priority** dropdown to specify the priority of your launch job. A launch job's priority is set to "Medium" if the launch queue does not support prioritization.
9. **(Optional) Follow this step only if a queue config template was created by your team admin**
Within the **Queue Configurations** field, provide values for configuration options that were created by the admin of your team.
For example, in the following example, the team admin configured AWS instance types that can be used by the team. In this case, team members can pick either the `ml.m4.xlarge` or `ml.p3.xlarge` compute instance type to train their model.
{{< img src="/images/launch/team_member_use_config_template.png" alt="" >}}
10. Select the **Destination project**, where the resulting run will appear. This project needs to belong to the same entity as the queue.
11. Select the **Launch now** button.
{{% /tab %}}
{{% tab "W&B CLI" %}}
Use the `wandb launch` command to add jobs to a queue. Create a JSON configuration with hyperparameter overrides. For example, using the script from the [Quickstart]({{< relref "../walkthrough.md" >}}) guide, we create a JSON file with the following overrides:
```json title="config.json"
{
"overrides": {
"args": [],
"run_config": {
"learning_rate": 0,
"epochs": 0
},
"entry_point": []
}
}
```
{{% alert %}}
W&B Launch will use the default parameters if you do not provide a JSON configuration file.
{{% /alert %}}
If you want to override the queue configuration, or if your launch queue does not have a configuration resource defined, you can specify the `resource_args` key in your config.json file. For example, following continuing the example above, your config.json file might look similar to the following:
```json title="config.json"
{
"overrides": {
"args": [],
"run_config": {
"learning_rate": 0,
"epochs": 0
},
"entry_point": []
},
"resource_args": {
"" : {
"": ""
}
}
}
```
Replace values within the `<>` with your own values.
Provide the name of the queue for the `queue`(`-q`) flag, the name of the job for the `job`(`-j`) flag, and the path to the configuration file for the `config`(`-c`) flag.
```bash
wandb launch -j -q \
-e -c path/to/config.json
```
If you work within a W&B Team, we suggest you specify the `entity` flag (`-e`) to indicate which entity the queue will use.
{{% /tab %}}
{{% /tabpane %}}
# Create a launch job
{{< cta-button colabLink="https://colab.research.google.com/drive/1wX0OSVxZJDHRsZaOaOEDx-lLUrO1hHgP" >}}
Launch jobs are blueprints for reproducing W&B runs. Jobs are W&B Artifacts that capture the source code, dependencies, and inputs required to execute a workload.
Create and run jobs with the `wandb launch` command.
{{% alert %}}
To create a job without submitting it for execution, use the `wandb job create` command. See the [command reference docs]({{< relref "/ref/cli/wandb-job/wandb-job-create.md" >}}) for more information.
{{% /alert %}}
## Git jobs
You can create a Git-based job where code and other tracked assets are cloned from a certain commit, branch, or tag in a remote git repository with W&B Launch. Use the `--uri` or `-u` flag to specify the URI containing the code, along with optionally a `--build-context` flag to specify a subdirectory.
Run a "hello world" job from a git repository with the following command:
```bash
wandb launch --uri "https://github.com/wandb/launch-jobs.git" --build-context jobs/hello_world --dockerfile Dockerfile.wandb --project "hello-world" --job-name "hello-world" --entry-point "python job.py"
```
The command does the following:
1. Clones the [W&B Launch jobs repository](https://github.com/wandb/launch-jobs) to a temporary directory.
2. Creates a job named **hello-world-git** in the **hello** project. The job is associated with the commit at the head of the default branch of the repository.
3. Builds a container image from the `jobs/hello_world` directory and the `Dockerfile.wandb`.
4. Starts the container and runs `python job.py`.
To build a job from a specific branch or commit hash, append the `-g`, `--git-hash` argument. For a full list of arguments, run `wandb launch --help`.
### Remote URL format
The git remote associated with a Launch job can be either an HTTPS or an SSH URL. The URL type determines the protocol used to fetch job source code.
| Remote URL Type| URL Format | Requirements for access and authentication |
| ----------| ------------------- | ------------------------------------------ |
| https | `https://github.com/organization/repository.git` | username and password to authenticate with the git remote |
| ssh | `git@github.com:organization/repository.git` | ssh key to authenticate with the git remote |
Note that the exact URL format varies by hosting provider. Jobs created with `wandb launch --uri` will use the transfer protocol specified in the provided `--uri`.
## Code artifact jobs
Jobs can be created from any source code stored in a W&B Artifact. Use a local directory with the `--uri` or `-u` argument to create a new code artifact and job.
To get started, create an empty directory and add a Python script named `main.py` with the following content:
```python
import wandb
with wandb.init() as run:
run.log({"metric": 0.5})
```
Add a file `requirements.txt` with the following content:
```txt
wandb>=0.17.1
```
Log the directory as a code artifact and launch a job with the following command:
```bash
wandb launch --uri . --job-name hello-world-code --project launch-quickstart --entry-point "python main.py"
```
The preceding command does the following:
1. Logs the current directory as a code artifact named `hello-world-code`.
2. Creates a job named `hello-world-code` in the `launch-quickstart` project.
3. Builds a container image from the current directory and Launch's default Dockerfile. The default Dockerfile will install the `requirements.txt` file and set the entry point to `python main.py`.
## Image jobs
Alternatively, you can build jobs off of pre-made Docker images. This is useful when you already have an established build system for your ML code, or when you don't expect to adjust the code or requirements for the job but do want to experiment with hyperparameters or different infrastructure scales.
The image is pulled from a Docker registry and run with the specified entry point, or the default entry point if none is specified. Pass a full image tag to the `--docker-image` option to create and run a job from a Docker image.
To run a simple job from a pre-made image, use the following command:
```bash
wandb launch --docker-image "wandb/job_hello_world:main" --project "hello-world"
```
## Automatic job creation
W&B will automatically create and track a job for any run with tracked source code, even if that run was not created with Launch. Runs are considered to have tracked source code if any of the three following conditions are met:
- The run has an associated git remote and commit hash
- The run logged a code artifact (see [`Run.log_code`]({{< relref "/ref/python/run.md#log_code" >}}) for more information)
- The run was executed in a Docker container with the `WANDB_DOCKER` environment variable set to an image tag
The Git remote URL is inferred from the local git repository if your Launch job is created automatically by a W&B run.
### Launch job names
By default, W&B automatically generates a job name for you. The name is generated depending on how the job is created (GitHub, code artifact, or Docker image). Alternatively, you can define a Launch job's name with environment variables or with the W&B Python SDK.
The following table describes the job naming convention used by default based on job source:
| Source | Naming convention |
| ------------- | --------------------------------------- |
| GitHub | `job--` |
| Code artifact | `job-` |
| Docker image | `job-` |
Name your job with a W&B environment variable or with the W&B Python SDK
{{< tabpane text=true >}}
{{% tab "Environment variable" %}}
Set the `WANDB_JOB_NAME` environment variable to your preferred job name. For example:
```bash
WANDB_JOB_NAME=awesome-job-name
```
{{% /tab %}}
{{% tab "W&B Python SDK" %}}
Define the name of your job with `wandb.Settings`. Then pass this object when you initialize W&B with `wandb.init`. For example:
```python
settings = wandb.Settings(job_name="my-job-name")
wandb.init(settings=settings)
```
{{% /tab %}}
{{< /tabpane >}}
{{% alert %}}
For docker image jobs, the version alias is automatically added as an alias to the job.
{{% /alert %}}
## Containerization
Jobs are executed in a container. Image jobs use a pre-built Docker image, while Git and code artifact jobs require a container build step.
Job containerization can be customized with arguments to `wandb launch` and files within the job source code.
### Build context
The term build context refers to the tree of files and directories that are sent to the Docker daemon to build a container image. By default, Launch uses the root of the job source code as the build context. To specify a subdirectory as the build context, use the `--build-context` argument of `wandb launch` when creating and launching a job.
{{% alert %}}
The `--build-context` argument is particularly useful for working with Git jobs that refer to a monorepo with multiple projects. By specifying a subdirectory as the build context, you can build a container image for a specific project within the monorepo.
See the [example above]({{< relref "#git-jobs" >}}) for a demonstration of how to use the `--build-context` argument with the official W&B Launch jobs repository.
{{% /alert %}}
### Dockerfile
The Dockerfile is a text file that contains instructions for building a Docker image. By default, Launch uses a default Dockerfile that installs the `requirements.txt` file. To use a custom Dockerfile, specify the path to the file with the `--dockerfile` argument of `wandb launch`.
The Dockerfile path is specified relative to the build context. For example, if the build context is `jobs/hello_world`, and the Dockerfile is located in the `jobs/hello_world` directory, the `--dockerfile` argument should be set to `Dockerfile.wandb`. See the [example above]({{< relref "#git-jobs" >}}) for a demonstration of how to use the `--dockerfile` argument with the official W&B Launch jobs repository.
### Requirements file
If no custom Dockerfile is provided, Launch will look in the build context for Python dependencies to install. If a `requirements.txt` file is found at the root of the build context, Launch will install the dependencies listed in the file. Otherwise, if a `pyproject.toml` file is found, Launch will install dependencies from the `project.dependencies` section.
# Manage job inputs
The core experience of Launch is easily experimenting with different job inputs like hyperparameters and datasets, and routing these jobs to appropriate hardware. Once a job is created, users beyond the original author can adjust these inputs via the W&B GUI or CLI. For information on how job inputs can be set when launching from the CLI or UI, see the [Enqueue jobs]({{< relref "./add-job-to-queue.md" >}}) guide.
This section describes how to programmatically control the inputs that can be tweaked for a job.
By default, W&B jobs capture the entire `Run.config` as the inputs to a job, but the Launch SDK provides a function to control select keys in the run config or to specify JSON or YAML files as inputs.
{{% alert %}}
Launch SDK functions require `wandb-core`. See the [`wandb-core` README](https://github.com/wandb/wandb/blob/main/core/README.md) for more information.
{{% /alert %}}
## Reconfigure the `Run` object
The `Run` object returned by `wandb.init` in a job can be reconfigured, by default. The Launch SDK provides a way to customize what parts of the `Run.config` object can be reconfigured when launching the job.
```python
import wandb
from wandb.sdk import launch
# Required for launch sdk use.
wandb.require("core")
config = {
"trainer": {
"learning_rate": 0.01,
"batch_size": 32,
"model": "resnet",
"dataset": "cifar10",
"private": {
"key": "value",
},
},
"seed": 42,
}
with wandb.init(config=config):
launch.manage_wandb_config(
include=["trainer"],
exclude=["trainer.private"],
)
# Etc.
```
The function `launch.manage_wandb_config` configures the job to accept input values for the `Run.config` object. The optional `include` and `exclude` options take path prefixes within the nested config object. This can be useful if, for example, a job uses a library whose options you don't want to expose to end users.
If `include` prefixes are provided, only paths within the config that match an `include` prefix will accept input values. If `exclude` prefixes are provided, no paths that match the `exclude` list will be filtered out of the input values. If a path matches both an `include` and an `exclude` prefix, the `exclude` prefix will take precedence.
In the preceding example, the path `["trainer.private"]` will filter out the `private` key from the `trainer` object, and the path `["trainer"]` will filter out all keys not under the `trainer` object.
{{% alert %}}
Use a `\`-escaped `.` to filter out keys with a `.` in their name.
For example, `r"trainer\.private"` filters out the `trainer.private` key rather than the `private` key under the `trainer` object.
Note that the `r` prefix above denotes a raw string.
{{% /alert %}}
If the code above is packaged and run as a job, the input types of the job will be:
```json
{
"trainer": {
"learning_rate": "float",
"batch_size": "int",
"model": "str",
"dataset": "str",
},
}
```
When launching the job from the W&B CLI or UI, the user will be able to override only the four `trainer` parameters.
### Access run config inputs
Jobs launched with run config inputs can access the input values through the `Run.config`. The `Run` returned by `wandb.init` in the job code will have the input values automatically set. Use
```python
from wandb.sdk import launch
run_config_overrides = launch.load_wandb_config()
```
to load the run config input values anywhere in the job code.
## Reconfigure a file
The Launch SDK also provides a way to manage input values stored in config files in the job code. This is a common pattern in many deep learning and large language model use cases, like this [torchtune](https://github.com/pytorch/torchtune/blob/main/recipes/configs/llama3/8B_lora.yaml) example or this [Axolotl config](https://github.com/OpenAccess-AI-Collective/axolotl/blob/main/examples/llama-3/qlora-fsdp-70b.yaml)).
{{% alert %}}
[Sweeps on Launch]({{< relref "../sweeps-on-launch.md" >}}) does not support the use of config file inputs as sweep parameters. Sweep parameters must be controlled through the `Run.config` object.
{{% /alert %}}
The `launch.manage_config_file` function can be used to add a config file as an input to the Launch job, giving you access to edit values within the config file when launching the job.
By default, no run config inputs will be captured if `launch.manage_config_file` is used. Calling `launch.manage_wandb_config` overrides this behavior.
Consider the following example:
```python
import yaml
import wandb
from wandb.sdk import launch
# Required for launch sdk use.
wandb.require("core")
launch.manage_config_file("config.yaml")
with open("config.yaml", "r") as f:
config = yaml.safe_load(f)
with wandb.init(config=config):
# Etc.
pass
```
Imagine the code is run with an adjacent file `config.yaml`:
```yaml
learning_rate: 0.01
batch_size: 32
model: resnet
dataset: cifar10
```
The call to `launch.manage_config_file` will add the `config.yaml` file as an input to the job, making it reconfigurable when launching from the W&B CLI or UI.
The `include` and `exclude` keyword arugments may be used to filter the acceptable input keys for the config file in the same way as `launch.manage_wandb_config`.
### Access config file inputs
When `launch.manage_config_file` is called in a run created by Launch, `launch` patches the contents of the config file with the input values. The patched config file is available in the job environment.
{{% alert color="secondary" %}}
Call `launch.manage_config_file` before reading the config file in the job code to ensure input values are used.
{{% /alert %}}
### Customize a job's launch drawer UI
Defining a schema for a job's inputs allows you to create a custom UI for launching the job. To define a job's schema, include it in the call to `launch.manage_wandb_config` or `launch.manage_config_file`. The schema can either be a python dict in the form of a [JSON Schema](https://json-schema.org/understanding-json-schema/reference) or a Pydantic model class.
{{% alert color="secondary" %}}
Job input schemas are not used to validate inputs. They are only used to define the UI in the launch drawer.
{{% /alert %}}
{{< tabpane text=true >}}
{{% tab "JSON schema" %}}
The following example shows a schema with these properties:
- `seed`, an integer
- `trainer`, a dictionary with some keys specified:
- `trainer.learning_rate`, a float that must be greater than zero
- `trainer.batch_size`, an integer that must be either 16, 64, or 256
- `trainer.dataset`, a string that must be either `cifar10` or `cifar100`
```python
schema = {
"type": "object",
"properties": {
"seed": {
"type": "integer"
}
"trainer": {
"type": "object",
"properties": {
"learning_rate": {
"type": "number",
"description": "Learning rate of the model",
"exclusiveMinimum": 0,
},
"batch_size": {
"type": "integer",
"description": "Number of samples per batch",
"enum": [16, 64, 256]
},
"dataset": {
"type": "string",
"description": "Name of the dataset to use",
"enum": ["cifar10", "cifar100"]
}
}
}
}
}
launch.manage_wandb_config(
include=["seed", "trainer"],
exclude=["trainer.private"],
schema=schema,
)
```
In general, the following JSON Schema attributes are supported:
| Attribute | Required | Notes |
| --- | --- | --- |
| `type` | Yes | Must be one of `number`, `integer`, `string`, or `object` |
| `title` | No | Overrides the property's display name |
| `description` | No | Gives the property helper text |
| `enum` | No | Creates a dropdown select instead of a freeform text entry |
| `minimum` | No | Allowed only if `type` is `number` or `integer` |
| `maximum` | No | Allowed only if `type` is `number` or `integer` |
| `exclusiveMinimum` | No | Allowed only if `type` is `number` or `integer` |
| `exclusiveMaximum` | No | Allowed only if `type` is `number` or `integer` |
| `properties` | No | If `type` is `object`, used to define nested configurations |
{{% /tab %}}
{{% tab "Pydantic model" %}}
The following example shows a schema with these properties:
- `seed`, an integer
- `trainer`, a schema with some sub-attributes specified:
- `trainer.learning_rate`, a float that must be greater than zero
- `trainer.batch_size`, an integer that must be between 1 and 256, inclusive
- `trainer.dataset`, a string that must be either `cifar10` or `cifar100`
```python
class DatasetEnum(str, Enum):
cifar10 = "cifar10"
cifar100 = "cifar100"
class Trainer(BaseModel):
learning_rate: float = Field(gt=0, description="Learning rate of the model")
batch_size: int = Field(ge=1, le=256, description="Number of samples per batch")
dataset: DatasetEnum = Field(title="Dataset", description="Name of the dataset to use")
class Schema(BaseModel):
seed: int
trainer: Trainer
launch.manage_wandb_config(
include=["seed", "trainer"],
exclude=["trainer.private"],
schema=Schema,
)
```
You can also use an instance of the class:
```python
t = Trainer(learning_rate=0.01, batch_size=32, dataset=DatasetEnum.cifar10)
s = Schema(seed=42, trainer=t)
launch.manage_wandb_config(
include=["seed", "trainer"],
exclude=["trainer.private"],
input_schema=s,
)
```
{{% /tab %}}
{{< /tabpane >}}
Adding a job input schema will create a structured form in the launch drawer, making it easier to launch the job.
{{< img src="/images/launch/schema_overrides.png" alt="" >}}
# Monitor launch queue
Use the interactive **Queue monitoring dashboard** to view when a launch queue is in heavy use or idle, visualize workloads that are running, and spot inefficient jobs. The launch queue dashboard is especially useful for deciding whether or not you are effectively using your compute hardware or cloud resources.
For deeper analysis, the page links to the W&B experiment tracking workspace and to external infrastructure monitoring providers like Datadog, NVIDIA Base Command, or cloud consoles.
{{% alert %}}
Queue monitoring dashboards are currently available only in the W&B Multi-tenant Cloud deployment option.
{{% /alert %}}
## Dashboard and plots
Use the **Monitor** tab to view the activity of a queue that occurred during the last seven days. Use the left panel to control time ranges, grouping, and filters.
The dashboard contains a number of plots answering common questions about performance and efficiency. The proceeding sections describe UI elements of queue dashboards.
### Job status
The **Job status** plot shows how many jobs are running, pending, queued, or completed in each time interval. Use the **Job status** plot for identifying periods of idleness in the queue.
{{< img src="/images/launch/launch_obs_jobstatus.png" alt="" >}}
For example, suppose you have a fixed resource (such as DGX BasePod). If you observe an idle queue with the fixed resource, this might suggest an opportunity to run lower-priority pre-emptible launch jobs such as sweeps.
On the other hand, suppose you use a cloud resource and you see periodic bursts of activity. Periodic bursts of activity might suggest an opportunity to save money by reserving resources for particular times.
To the right of the plot is a key that shows which colors represent the [status of a launch job]({{< relref "./launch-view-jobs.md#check-the-status-of-a-job" >}}).
{{% alert %}}
`Queued` items might indicate opportunities to shift workloads to other queues. A spike in failures can identify users who might need help with their launch job setup.
{{% /alert %}}
### Queued time
The **Queued time** plots shows the amount of time (in seconds) that a launch job was on a queue for a given date or time range.
{{< img src="/images/launch/launch_obs_queuedtime.png" alt="" >}}
The x-axis shows a time frame that you specify and the y-axis shows the time (in seconds) a launch job was on a launch queue. For example, suppose on a given day there are 10 launch jobs queued. The **Queue time** plot shows 600 seconds if those 10 launch jobs wait an average of 60 seconds each.
{{% alert %}}
Use the **Queued time** plot to identify users affected by long queue times.
{{% /alert %}}
Customize the color of each job with the `Grouping` control in the left bar.
which can be particularly helpful for identifying which users and jobs are feeling the pain of scarce queue capacity.
### Job runs
{{< img src="/images/launch/launch_obs_jobruns2.png" alt="" >}}
This plot shows the start and end of every job executed in a time period, with distinct colors for each run. This makes it easy to see at a glance what workloads the queue was processing at a given time.
Use the Select tool in the bottom right of the panel to brush over jobs to populate details in the table below.
### CPU and GPU usage
Use the **GPU use by a job**, **CPU use by a job**, **GPU memory by job**, and **System memory by job** to view the efficiency of your launch jobs.
{{< img src="/images/launch/launch_obs_gpu.png" alt="" >}}
For example, you can use the **GPU memory by job** to view if a W&B run took a long time to complete and whether or not it used a low percentage of its CPU cores.
The x-axis of each plot shows the duration of a W&B run (created by a launch job) in seconds. Hover your mouse over a data point to view information about a W&B run such as the run ID, the project the run belongs to, the launch job that created the W&B run and more.
### Errors
The **Errors** panel shows errors that occurred on a given launch queue. More specifically, the Errors panel shows a timestamp of when the error occurred, the name of the launch job where the error comes from, and the error message that was created. By default, errors are ordered from latest to oldest.
{{< img src="/images/launch/launch_obs_errors.png" alt="" >}}
Use the **Errors** panel to identify and unblock users.
## External links
The queue observability dashboard's view is consistent across all queue types, but in many cases, it can be useful to jump directly into environment-specific monitors. To accomplish this, add a link from the console directly from the queue observability dashboard.
At the bottom of the page, click `Manage Links` to open a panel. Add the full URL of the page you want. Next, add a label. Links that you add appear in the **External Links** section.
# View launch jobs
The following page describes how to view information about launch jobs added to queues.
## View jobs
View jobs added to a queue with the W&B App.
1. Navigate to the W&B App at https://wandb.ai/home.
2. Select **Launch** within the **Applications** section of the left sidebar.
3. Select the **All entities** dropdown and select the entity the launch job belongs to.
4. Expand the collapsible UI from the Launch Application page to view a list of jobs added to that specific queue.
{{% alert %}}
A run is created when the launch agent executes a launch job. In other words, each run listed corresponds to a specific job that was added to that queue.
{{% /alert %}}
For example, the following image shows two runs that were created from a job called `job-source-launch_demo-canonical`. The job was added to a queue called `Start queue`. The first run listed in the queue called `resilient-snowball` and the second run listed is called `earthy-energy-165`.
{{< img src="/images/launch/launch_jobs_status.png" alt="" >}}
Within the W&B App UI you can find additional information about runs created from launch jobs such as the:
- **Run**: The name of the W&B run assigned to that job.
- **Job ID**: The name of the job.
- **Project**: The name of the project the run belongs to.
- **Status**: The status of the queued run.
- **Author**: The W&B entity that created the run.
- **Creation date**: The timestamp when the queue was created.
- **Start time**: The timestamp when the job started.
- **Duration**: Time, in seconds, it took to complete the job’s run.
## List jobs
View a list of jobs that exist within a project with the W&B CLI. Use the W&B job list command and provide the name of the project and entity the launch job belongs to the `--project` and `--entity` flags, respectively.
```bash
wandb job list --entity your-entity --project project-name
```
## Check the status of a job
The following table defines the status a queued run can have:
| Status | Description |
| --- | --- |
| **Idle** | The run is in a queue with no active agents. |
| **Queued** | The run is in a queue waiting for an agent to process it. |
| **Pending** | The run has been picked up by an agent but has not yet started. This could be due to resources being unavailable on the cluster. |
| **Running** | The run is currently executing. |
| **Killed** | The job was killed by the user. |
| **Crashed** | The run stopped sending data or did not successfully start. |
| **Failed** | The run ended with a non-zero exit code or the run failed to start. |
| **Finished** | The job completed successfully. |
# Launch FAQ
# Are there best practices for using Launch effectively?
1. Create the queue before starting the agent to enable easy configuration. Failure to do this results in errors that prevent the agent from functioning until a queue is added.
2. Create a W&B service account to initiate the agent, ensuring it is not linked to an individual user account.
3. Use `wandb.config` to manage hyperparameters, allowing for overwriting during job re-runs. Refer to [this guide]({{< relref "/guides/models/track/config/#set-the-configuration-with-argparse" >}}) for details on using argparse.
# Can I specify a Dockerfile and let W&B build a Docker image for me?
This feature suits projects with stable requirements but frequently changing codebases.
{{% alert color="secondary" %}}
Format your Dockerfile to use mounts. For further details, visit the [Mounts documentation on the Docker Docs website](https://docs.docker.com/build/guide/mounts/).
{{% /alert %}}
After configuring the Dockerfile, specify it in one of three ways to W&B:
* Use Dockerfile.wandb
* Use W&B CLI
* Use W&B App
{{< tabpane text=true >}}
{{% tab "Dockerfile.wandb" %}}
Include a `Dockerfile.wandb` file in the same directory as the W&B run's entrypoint. W&B utilizes this file instead of the built-in Dockerfile.
{{% /tab %}}
{{% tab "W&B CLI" %}}
Use the `--dockerfile` flag with the `wandb launch` command to queue a job:
```bash
wandb launch --dockerfile path/to/Dockerfile
```
{{% /tab %}}
{{% tab "W&B app" %}}
When adding a job to a queue in the W&B App, provide the Dockerfile path in the **Overrides** section. Enter it as a key-value pair with `"dockerfile"` as the key and the path to the Dockerfile as the value.
The following JSON demonstrates how to include a Dockerfile in a local directory:
```json title="Launch job W&B App"
{
"args": [],
"run_config": {
"lr": 0,
"batch_size": 0,
"epochs": 0
},
"entrypoint": [],
"dockerfile": "./Dockerfile"
}
```
{{% /tab %}}
{{% /tabpane %}}
# Can Launch automatically provision (and spin down) compute resources for me in the target environment?
This process depends on the environment. Resources provision in Amazon SageMaker and Vertex. In Kubernetes, autoscalers automatically adjust resources based on demand. Solution Architects at W&B assist in configuring Kubernetes infrastructure to enable retries, autoscaling, and the use of spot instance node pools. For support, contact support@wandb.com or use your shared Slack channel.
# Can you specify secrets for jobs/automations? For instance, an API key which you do not wish to be directly visible to users?
Yes. Follow these steps:
1. Create a Kubernetes secret in the designated namespace for the runs using the command:
`kubectl create secret -n generic `
2. After creating the secret, configure the queue to inject the secret when runs start. Only cluster administrators can view the secret; end users cannot see it.
# Does Launch support parallelization? How can I limit the resources consumed by a job?
Launch supports scaling jobs across multiple GPUs and nodes. Refer to [this guide]({{< relref "/launch/integration-guides/volcano.md" >}}) for details.
Each launch agent is configured with a `max_jobs` parameter, which determines the maximum number of simultaneous jobs it can run. Multiple agents can point to a single queue as long as they connect to an appropriate launching infrastructure.
You can set limits on CPU, GPU, memory, and other resources at the queue or job run level in the resource configuration. For information on setting up queues with resource limits on Kubernetes, refer to [this guide]({{< relref "/launch/set-up-launch/setup-launch-kubernetes.md" >}}).
For sweeps, include the following block in the queue configuration to limit the number of concurrent runs:
```yaml title="queue config"
scheduler:
num_workers: 4
```
# How can admins restrict which users have modify access?
Control access to certain queue fields for users who are not team administrators through [queue config templates]({{< relref "/launch/set-up-launch/setup-queue-advanced.md" >}}). Team administrators define which fields non-admin users can view, and set the editing limits. Only team administrators have the ability to create or edit queues.
# How do I control who can push to a queue?
Queues are specific to a user team. Define the owning entity during queue creation. To restrict access, modify team membership.
# How do I fix a "permission denied" error in Launch?
If you encounter the error message `Launch Error: Permission denied`, it indicates insufficient permissions to log to the desired project. Possible causes include:
1. You are not logged in on this machine. Run [`wandb login`]({{< relref "/ref/cli/wandb-login.md" >}}) in the command line.
2. The specified entity does not exist. The entity must be your username or an existing team's name. Create a team if necessary with the [Subscriptions page](https://app.wandb.ai/billing).
3. You lack project permissions. Request the project creator to change the privacy setting to **Open** to allow logging runs to the project.
# How do I make W&B Launch work with Tensorflow on GPU?
For TensorFlow jobs using GPUs, specify a custom base image for the container build. This ensures proper GPU utilization during runs. Add an image tag under the `builder.accelerator.base_image` key in the resource configuration. For example:
```json
{
"gpus": "all",
"builder": {
"accelerator": {
"base_image": "tensorflow/tensorflow:latest-gpu"
}
}
}
```
In versions prior to W&B 0.15.6, use `cuda` instead of `accelerator` as the parent key for `base_image`.
# How does W&B Launch build images?
The steps for building an image depend on the job source and the specified accelerator base image in the resource configuration.
{{% alert %}}
When configuring a queue or submitting a job, include a base accelerator image in the queue or job resource configuration:
```json
{
"builder": {
"accelerator": {
"base_image": "image-name"
}
}
}
```
{{% /alert %}}
The build process includes the following actions based on the job type and provided accelerator base image:
| | Install Python using apt | Install Python packages | Create a user and workdir | Copy code into image | Set entrypoint | |
# I do not like clicking- can I use Launch without going through the UI?
Yes. The standard `wandb` CLI includes a `launch` subcommand to launch jobs. For more information, run:
```bash
wandb launch --help
```
# I do not want W&B to build a container for me, can I still use Launch?
To launch a pre-built Docker image, execute the following command. Replace the placeholders in the `<>` with your specific information:
```bash
wandb launch -d -q -E
```
This command creates a job and starts a run.
To create a job from an image, use the following command:
```bash
wandb job create image -p -e
```
# Is `wandb launch -d` or `wandb job create image` uploading a whole docker artifact and not pulling from a registry?
No, the `wandb launch -d` command does not upload images to a registry. Upload images to a registry separately. Follow these steps:
1. Build an image.
2. Push the image to a registry.
The workflow is as follows:
```bash
docker build -t : .
docker push :
wandb launch -d :
```
The launch agent then spins up a job pointing to the specified container. See [Advanced agent setup]({{< relref "/launch/set-up-launch/setup-agent-advanced.md#agent-configuration" >}}) for examples on configuring agent access to pull images from a container registry.
For Kubernetes, ensure that the Kubernetes cluster pods have access to the registry where the image is pushed.
# What permissions does the agent require in Kubernetes?
The following Kubernetes manifest creates a role named `wandb-launch-agent` in the `wandb` namespace. This role allows the agent to create pods, configmaps, secrets, and access pod logs in the `wandb` namespace. The `wandb-cluster-role` enables the agent to create pods, access pod logs, create secrets, jobs, and check job status across any specified namespace.
# What requirements does the accelerator base image have?
For jobs utilizing an accelerator, provide a base image that includes the necessary accelerator components. Ensure the following requirements for the accelerator image:
- Compatibility with Debian (the Launch Dockerfile uses apt-get to install Python)
- Supported CPU and GPU hardware instruction set (confirm the CUDA version compatibility with the intended GPU)
- Compatibility between the supplied accelerator version and the packages in the machine learning algorithm
- Installation of packages that require additional steps for hardware compatibility
# When multiple jobs in a Docker queue download the same artifact, is any caching used, or is it re-downloaded every run?
No caching exists. Each launch job operates independently. Configure the queue or agent to mount a shared cache using Docker arguments in the queue configuration.
Additionally, mount the W&B artifacts cache as a persistent volume for specific use cases.
# Launch integration guides
# Dagster
> Guide on how to integrate W&B with Dagster.
Use Dagster and W&B (W&B) to orchestrate your MLOps pipelines and maintain ML assets. The integration with W&B makes it easy within Dagster to:
* Use and create [W&B Artifacts]({{< relref "/guides/core/artifacts/" >}}).
* Use and create Registered Models in [W&B Registry]({{< relref "/guides/core/registry/" >}}).
* Run training jobs on dedicated compute using [W&B Launch]({{< relref "/launch/" >}}).
* Use the [wandb]({{< relref "/ref/python/" >}}) client in ops and assets.
The W&B Dagster integration provides a W&B-specific Dagster resource and IO Manager:
* `wandb_resource`: a Dagster resource used to authenticate and communicate to the W&B API.
* `wandb_artifacts_io_manager`: a Dagster IO Manager used to consume W&B Artifacts.
The following guide demonstrates how to satisfy prerequisites to use W&B in Dagster, how to create and use W&B Artifacts in ops and assets, how to use W&B Launch and recommended best practices.
## Before you get started
You will need the following resources to use Dagster within Weights and Biases:
1. **W&B API Key**.
2. **W&B entity (user or team)**: An entity is a username or team name where you send W&B Runs and Artifacts. Make sure to create your account or team entity in the W&B App UI before you log runs. If you do not specify ain entity, the run will be sent to your default entity, which is usually your username. Change your default entity in your settings under **Project Defaults**.
3. **W&B project**: The name of the project where [W&B Runs]({{< relref "/guides/models/track/runs/" >}}) are stored.
Find your W&B entity by checking the profile page for that user or team in the W&B App. You can use a pre-existing W&B project or create a new one. New projects can be created on the W&B App homepage or on user/team profile page. If a project does not exist it will be automatically created when you first use it. The proceeding instructions demonstrate how to get an API key:
### How to get an API key
1. [Log in to W&B](https://wandb.ai/login). Note: if you are using W&B Server ask your admin for the instance host name.
2. Collect your API key by navigating to the [authorize page](https://wandb.ai/authorize) or in your user/team settings. For a production environment we recommend using a [service account]({{< relref "/support/kb-articles/service_account_useful.md" >}}) to own that key.
3. Set an environment variable for that API key export `WANDB_API_KEY=YOUR_KEY`.
The proceeding examples demonstrate where to specify your API key in your Dagster code. Make sure to specify your entity and project name within the `wandb_config` nested dictionary. You can pass different `wandb_config` values to different ops/assets if you want to use a different W&B Project. For more information about possible keys you can pass, see the Configuration section below.
{{< tabpane text=true >}}
{{% tab "Config for @job" %}}
Example: configuration for `@job`
```python
# add this to your config.yaml
# alternatively you can set the config in Dagit's Launchpad or JobDefinition.execute_in_process
# Reference: https://docs.dagster.io/concepts/configuration/config-schema#specifying-runtime-configuration
resources:
wandb_config:
config:
entity: my_entity # replace this with your W&B entity
project: my_project # replace this with your W&B project
@job(
resource_defs={
"wandb_config": make_values_resource(
entity=str,
project=str,
),
"wandb_resource": wandb_resource.configured(
{"api_key": {"env": "WANDB_API_KEY"}}
),
"io_manager": wandb_artifacts_io_manager,
}
)
def simple_job_example():
my_op()
```
{{% /tab %}}
{{% tab "Config for @repository using assets" %}}
Example: configuration for `@repository` using assets
```python
from dagster_wandb import wandb_artifacts_io_manager, wandb_resource
from dagster import (
load_assets_from_package_module,
make_values_resource,
repository,
with_resources,
)
from . import assets
@repository
def my_repository():
return [
*with_resources(
load_assets_from_package_module(assets),
resource_defs={
"wandb_config": make_values_resource(
entity=str,
project=str,
),
"wandb_resource": wandb_resource.configured(
{"api_key": {"env": "WANDB_API_KEY"}}
),
"wandb_artifacts_manager": wandb_artifacts_io_manager.configured(
{"cache_duration_in_minutes": 60} # only cache files for one hour
),
},
resource_config_by_key={
"wandb_config": {
"config": {
"entity": "my_entity", # replace this with your W&B entity
"project": "my_project", # replace this with your W&B project
}
}
},
),
]
```
Note that we are configuring the IO Manager cache duration in this example contrary to the example for `@job`.
{{% /tab %}}
{{< /tabpane >}}
### Configuration
The proceeding configuration options are used as settings on the W&B-specific Dagster resource and IO Manager provided by the integration.
* `wandb_resource`: Dagster [resource](https://docs.dagster.io/concepts/resources) used to communicate with the W&B API. It automatically authenticates using the provided API key. Properties:
* `api_key`: (str, required): a W&B API key necessary to communicate with the W&B API.
* `host`: (str, optional): the API host server you wish to use. Only required if you are using W&B Server. It defaults to the Public Cloud host, `https://api.wandb.ai`.
* `wandb_artifacts_io_manager`: Dagster [IO Manager](https://docs.dagster.io/concepts/io-management/io-managers) to consume W&B Artifacts. Properties:
* `base_dir`: (int, optional) Base directory used for local storage and caching. W&B Artifacts and W&B Run logs will be written and read from that directory. By default, it’s using the `DAGSTER_HOME` directory.
* `cache_duration_in_minutes`: (int, optional) to define the amount of time W&B Artifacts and W&B Run logs should be kept in the local storage. Only files and directories that were not opened for that amount of time are removed from the cache. Cache purging happens at the end of an IO Manager execution. You can set it to 0, if you want to turn off caching completely. Caching improves speed when an Artifact is reused between jobs running on the same machine. It defaults to 30 days.
* `run_id`: (str, optional): A unique ID for this run, used for resuming. It must be unique in the project, and if you delete a run you can't reuse the ID. Use the name field for a short descriptive name, or config for saving hyperparameters to compare across runs. The ID cannot contain the following special characters: `/\#?%:..` You need to set the Run ID when you are doing experiment tracking inside Dagster to allow the IO Manager to resume the run. By default it’s set to the Dagster Run ID e.g `7e4df022-1bf2-44b5-a383-bb852df4077e`.
* `run_name`: (str, optional) A short display name for this run to help you identify this run in the UI. By default, it is a string with the following format: `dagster-run-[8 first characters of the Dagster Run ID]`. For example, `dagster-run-7e4df022`.
* `run_tags`: (list[str], optional): A list of strings, which will populate the list of tags on this run in the UI. Tags are useful for organizing runs together, or applying temporary labels like `baseline` or `production`. It's easy to add and remove tags in the UI, or filter down to just runs with a specific tag. Any W&B Run used by the integration will have the `dagster_wandb` tag.
## Use W&B Artifacts
The integration with W&B Artifact relies on a Dagster IO Manager.
[IO Managers](https://docs.dagster.io/concepts/io-management/io-managers) are user-provided objects that are responsible for storing the output of an asset or op and loading it as input to downstream assets or ops. For example, an IO Manager might store and load objects from files on a filesystem.
The integration provides an IO Manager for W&B Artifacts. This allows any Dagster `@op` or `@asset` to create and consume W&B Artifacts natively. Here’s a simple example of an `@asset` producing a W&B Artifact of type dataset containing a Python list.
```python
@asset(
name="my_artifact",
metadata={
"wandb_artifact_arguments": {
"type": "dataset",
}
},
io_manager_key="wandb_artifacts_manager",
)
def create_dataset():
return [1, 2, 3] # this will be stored in an Artifact
```
You can annotate your `@op`, `@asset` and `@multi_asset` with a metadata configuration in order to write Artifacts. Similarly you can also consume W&B Artifacts even if they were created outside Dagster.
## Write W&B Artifacts
Before continuing, we recommend you to have a good understanding of how to use W&B Artifacts. Consider reading the [Guide on Artifacts]({{< relref "/guides/core/artifacts/" >}}).
Return an object from a Python function to write a W&B Artifact. The following objects are supported by W&B:
* Python objects (int, dict, list…)
* W&B objects (Table, Image, Graph…)
* W&B Artifact objects
The proceeding examples demonstrate how to write W&B Artifacts with Dagster assets (`@asset`):
{{< tabpane text=true >}}
{{% tab "Python objects" %}}
Anything that can be serialized with the [pickle](https://docs.python.org/3/library/pickle.html) module is pickled and added to an Artifact created by the integration. The content is unpickled when you read that Artifact inside Dagster (see [Read artifacts]({{< relref "#read-wb-artifacts" >}}) for more details).
```python
@asset(
name="my_artifact",
metadata={
"wandb_artifact_arguments": {
"type": "dataset",
}
},
io_manager_key="wandb_artifacts_manager",
)
def create_dataset():
return [1, 2, 3]
```
W&B supports multiple Pickle-based serialization modules ([pickle](https://docs.python.org/3/library/pickle.html), [dill](https://github.com/uqfoundation/dill), [cloudpickle](https://github.com/cloudpipe/cloudpickle), [joblib](https://github.com/joblib/joblib)). You can also use more advanced serialization like [ONNX](https://onnx.ai/) or [PMML](https://en.wikipedia.org/wiki/Predictive_Model_Markup_Language). Please refer to the [Serialization]({{< relref "#serialization-configuration" >}}) section for more information.
{{% /tab %}}
{{% tab "W&B Object" %}}
Any native W&B object (e.g [Table]({{< relref "/ref/python/data-types/table.md" >}}), [Image]({{< relref "/ref/python/data-types/image.md" >}}), or [Graph]({{< relref "/ref/python/data-types/graph.md" >}})) is added to an Artifact created by the integration. Here’s an example using a Table.
```python
import wandb
@asset(
name="my_artifact",
metadata={
"wandb_artifact_arguments": {
"type": "dataset",
}
},
io_manager_key="wandb_artifacts_manager",
)
def create_dataset_in_table():
return wandb.Table(columns=["a", "b", "c"], data=[[1, 2, 3]])
```
{{% /tab %}}
{{% tab "W&B Artifact" %}}
For complex use cases, it might be necessary to build your own Artifact object. The integration still provides useful additional features like augmenting the metadata on both sides of the integration.
```python
import wandb
MY_ASSET = "my_asset"
@asset(
name=MY_ASSET,
io_manager_key="wandb_artifacts_manager",
)
def create_artifact():
artifact = wandb.Artifact(MY_ASSET, "dataset")
table = wandb.Table(columns=["a", "b", "c"], data=[[1, 2, 3]])
artifact.add(table, "my_table")
return artifact
```
{{% /tab %}}
{{< /tabpane >}}
### Configuration
A configuration dictionary called wandb_artifact_configuration can be set on an `@op`, `@asset` and `@multi_asset`. This dictionary must be passed in the decorator arguments as metadata. This configuration is required to control the IO Manager reads and writes of W&B Artifacts.
For `@op`, it’s located in the output metadata through the [Out](https://docs.dagster.io/_apidocs/ops#dagster.Out) metadata argument.
For `@asset`, it’s located in the metadata argument on the asset.
For `@multi_asset`, it’s located in each output metadata through the [AssetOut](https://docs.dagster.io/_apidocs/assets#dagster.AssetOut) metadata arguments.
The proceeding code examples demonstrate how to configure a dictionary on an `@op`, `@asset` and `@multi_asset` computations:
{{< tabpane text=true >}}
{{% tab "Example for @op" %}}
Example for `@op`:
```python
@op(
out=Out(
metadata={
"wandb_artifact_configuration": {
"name": "my_artifact",
"type": "dataset",
}
}
)
)
def create_dataset():
return [1, 2, 3]
```
{{% /tab %}}
{{% tab "Example for @asset" %}}
Example for `@asset`:
```python
@asset(
name="my_artifact",
metadata={
"wandb_artifact_configuration": {
"type": "dataset",
}
},
io_manager_key="wandb_artifacts_manager",
)
def create_dataset():
return [1, 2, 3]
```
You do not need to pass a name through the configuration because the @asset already has a name. The integration sets the Artifact name as the asset name.
{{% /tab %}}
{{% tab "Example for @multi_asset" %}}
Example for `@multi_asset`:
```python
@multi_asset(
name="create_datasets",
outs={
"first_table": AssetOut(
metadata={
"wandb_artifact_configuration": {
"type": "training_dataset",
}
},
io_manager_key="wandb_artifacts_manager",
),
"second_table": AssetOut(
metadata={
"wandb_artifact_configuration": {
"type": "validation_dataset",
}
},
io_manager_key="wandb_artifacts_manager",
),
},
group_name="my_multi_asset_group",
)
def create_datasets():
first_table = wandb.Table(columns=["a", "b", "c"], data=[[1, 2, 3]])
second_table = wandb.Table(columns=["d", "e"], data=[[4, 5]])
return first_table, second_table
```
{{% /tab %}}
{{< /tabpane >}}
Supported properties:
* `name`: (str) human-readable name for this artifact, which is how you can identify this artifact in the UI or reference it in use_artifact calls. Names can contain letters, numbers, underscores, hyphens, and dots. The name must be unique across a project. Required for `@op`.
* `type`: (str) The type of the artifact, which is used to organize and differentiate artifacts. Common types include dataset or model, but you can use any string containing letters, numbers, underscores, hyphens, and dots. Required when the output is not already an Artifact.
* `description`: (str) Free text that offers a description of the artifact. The description is markdown rendered in the UI, so this is a good place to place tables, links, etc.
* `aliases`: (list[str]) An array containing one or more aliases you want to apply on the Artifact. The integration will also add the “latest” tag to that list whether it’s set or not. This is an effective way for you to manage versioning of models and datasets.
* [`add_dirs`]({{< relref "/ref/python/artifact.md#add_dir" >}}): (list[dict[str, Any]]): An array containing configuration for each local directory to include in the Artifact. It supports the same arguments as the homonymous method in the SDK.
* [`add_files`]({{< relref "/ref/python/artifact.md#add_file" >}}): (list[dict[str, Any]]): An array containing configuration for each local file to include in the Artifact. It supports the same arguments as the homonymous method in the SDK.
* [`add_references`]({{< relref "/ref/python/artifact.md#add_reference" >}}): (list[dict[str, Any]]): An array containing configuration for each external reference to include in the Artifact. It supports the same arguments as the homonymous method in the SDK.
* `serialization_module`: (dict) Configuration of the serialization module to be used. Refer to the Serialization section for more information.
* `name`: (str) Name of the serialization module. Accepted values: `pickle`, `dill`, `cloudpickle`, `joblib`. The module needs to be available locally.
* `parameters`: (dict[str, Any]) Optional arguments passed to the serialization function. It accepts the same parameters as the dump method for that module. For example, `{"compress": 3, "protocol": 4}`.
Advanced example:
```python
@asset(
name="my_advanced_artifact",
metadata={
"wandb_artifact_configuration": {
"type": "dataset",
"description": "My *Markdown* description",
"aliases": ["my_first_alias", "my_second_alias"],
"add_dirs": [
{
"name": "My directory",
"local_path": "path/to/directory",
}
],
"add_files": [
{
"name": "validation_dataset",
"local_path": "path/to/data.json",
},
{
"is_tmp": True,
"local_path": "path/to/temp",
},
],
"add_references": [
{
"uri": "https://picsum.photos/200/300",
"name": "External HTTP reference to an image",
},
{
"uri": "s3://my-bucket/datasets/mnist",
"name": "External S3 reference",
},
],
}
},
io_manager_key="wandb_artifacts_manager",
)
def create_advanced_artifact():
return [1, 2, 3]
```
The asset is materialized with useful metadata on both sides of the integration:
* W&B side: the source integration name and version, the python version used, the pickle protocol version and more.
* Dagster side:
* Dagster Run ID
* W&B Run: ID, name, path, URL
* W&B Artifact: ID, name, type, version, size, URL
* W&B Entity
* W&B Project
The proceeding image demonstrates the metadata from W&B that was added to the Dagster asset. This information would not be available without the integration.
{{< img src="/images/integrations/dagster_wb_metadata.png" alt="" >}}
The following image demonstrates how the provided configuration was enriched with useful metadata on the W&B Artifact. This information should help for reproducibility and maintenance. It would not be available without the integration.
{{< img src="/images/integrations/dagster_inte_1.png" alt="" >}}
{{< img src="/images/integrations/dagster_inte_2.png" alt="" >}}
{{< img src="/images/integrations/dagster_inte_3.png" alt="" >}}
{{% alert %}}
If you use a static type checker like mypy, import the configuration type definition object using:
```python
from dagster_wandb import WandbArtifactConfiguration
```
{{% /alert %}}
### Using partitions
The integration natively supports [Dagster partitions](https://docs.dagster.io/concepts/partitions-schedules-sensors/partitions).
The following is an example with a partitioned using `DailyPartitionsDefinition`.
```python
@asset(
partitions_def=DailyPartitionsDefinition(start_date="2023-01-01", end_date="2023-02-01"),
name="my_daily_partitioned_asset",
compute_kind="wandb",
metadata={
"wandb_artifact_configuration": {
"type": "dataset",
}
},
)
def create_my_daily_partitioned_asset(context):
partition_key = context.asset_partition_key_for_output()
context.log.info(f"Creating partitioned asset for {partition_key}")
return random.randint(0, 100)
```
This code will produce one W&B Artifact for each partition. View artifacts in the Artifact panel (UI) under the asset name, which has the partition key appended. For example, `my_daily_partitioned_asset.2023-01-01`, `my_daily_partitioned_asset.2023-01-02`, or`my_daily_partitioned_asset.2023-01-03`. Assets that are partitioned across multiple dimensions shows each dimension in dot-delimited format. For example, `my_asset.car.blue`.
{{% alert color="secondary" %}}
The integration does not allow for the materialization of multiple partitions within one run. You will need to carry out multiple runs to materialize your assets. This can be executed in Dagit when you're materializing your assets.
{{< img src="/images/integrations/dagster_multiple_runs.png" alt="" >}}
{{% /alert %}}
#### Advanced usage
- [Partitioned job](https://github.com/dagster-io/dagster/blob/master/examples/with_wandb/with_wandb/ops/partitioned_job.py)
- [Simple partitioned asset](https://github.com/wandb/dagster/blob/master/examples/with_wandb/with_wandb/assets/simple_partitions_example.py)
- [Multi-partitioned asset](https://github.com/wandb/dagster/blob/master/examples/with_wandb/with_wandb/assets/multi_partitions_example.py)
- [Advanced partitioned usage](https://github.com/wandb/dagster/blob/master/examples/with_wandb/with_wandb/assets/advanced_partitions_example.py)
## Read W&B Artifacts
Reading W&B Artifacts is similar to writing them. A configuration dictionary called `wandb_artifact_configuration` can be set on an `@op` or `@asset`. The only difference is that we must set the configuration on the input instead of the output.
For `@op`, it’s located in the input metadata through the [In](https://docs.dagster.io/_apidocs/ops#dagster.In) metadata argument. You need to
explicitly pass the name of the Artifact.
For `@asset`, it’s located in the input metadata through the [Asset](https://docs.dagster.io/_apidocs/assets#dagster.AssetIn) In metadata argument. You should not pass an Artifact name because the name of the parent asset should match it.
If you want to have a dependency on an Artifact created outside the integration you will need to use [SourceAsset](https://docs.dagster.io/_apidocs/assets#dagster.SourceAsset). It will always read the latest version of that asset.
The following examples demonstrate how to read an Artifact from various ops.
{{< tabpane text=true >}}
{{% tab "From an @op" %}}
Reading an artifact from an `@op`
```python
@op(
ins={
"artifact": In(
metadata={
"wandb_artifact_configuration": {
"name": "my_artifact",
}
}
)
},
io_manager_key="wandb_artifacts_manager"
)
def read_artifact(context, artifact):
context.log.info(artifact)
```
{{% /tab %}}
{{% tab "Created by another @asset" %}}
Reading an artifact created by another `@asset`
```python
@asset(
name="my_asset",
ins={
"artifact": AssetIn(
# if you don't want to rename the input argument you can remove 'key'
key="parent_dagster_asset_name",
input_manager_key="wandb_artifacts_manager",
)
},
)
def read_artifact(context, artifact):
context.log.info(artifact)
```
{{% /tab %}}
{{% tab "Artifact created outside Dagster" %}}
Reading an Artifact created outside Dagster:
```python
my_artifact = SourceAsset(
key=AssetKey("my_artifact"), # the name of the W&B Artifact
description="Artifact created outside Dagster",
io_manager_key="wandb_artifacts_manager",
)
@asset
def read_artifact(context, my_artifact):
context.log.info(my_artifact)
```
{{% /tab %}}
{{< /tabpane >}}
### Configuration
The proceeding configuration is used to indicate what the IO Manager should collect and provide as inputs to the decorated functions. The following read patterns are supported.
1. To get an named object contained within an Artifact use get:
```python
@asset(
ins={
"table": AssetIn(
key="my_artifact_with_table",
metadata={
"wandb_artifact_configuration": {
"get": "my_table",
}
},
input_manager_key="wandb_artifacts_manager",
)
}
)
def get_table(context, table):
context.log.info(table.get_column("a"))
```
2. To get the local path of a downloaded file contained within an Artifact use get_path:
```python
@asset(
ins={
"path": AssetIn(
key="my_artifact_with_file",
metadata={
"wandb_artifact_configuration": {
"get_path": "name_of_file",
}
},
input_manager_key="wandb_artifacts_manager",
)
}
)
def get_path(context, path):
context.log.info(path)
```
3. To get the entire Artifact object (with the content downloaded locally):
```python
@asset(
ins={
"artifact": AssetIn(
key="my_artifact",
input_manager_key="wandb_artifacts_manager",
)
},
)
def get_artifact(context, artifact):
context.log.info(artifact.name)
```
Supported properties
* `get`: (str) Gets the W&B object located at the artifact relative name.
* `get_path`: (str) Gets the path to the file located at the artifact relative name.
### Serialization configuration
By default, the integration will use the standard [pickle](https://docs.python.org/3/library/pickle.html) module, but some objects are not compatible with it. For example, functions with yield will raise an error if you try to pickle them.
We support more Pickle-based serialization modules ([dill](https://github.com/uqfoundation/dill), [cloudpickle](https://github.com/cloudpipe/cloudpickle), [joblib](https://github.com/joblib/joblib)). You can also use more advanced serialization like [ONNX](https://onnx.ai/) or [PMML](https://en.wikipedia.org/wiki/Predictive_Model_Markup_Language) by returning a serialized string or creating an Artifact directly. The right choice will depend on your use case, please refer to the available literature on this subject.
### Pickle-based serialization modules
{{% alert color="secondary" %}}
Pickling is known to be insecure. If security is a concern please only use W&B objects. We recommend signing your data and storing the hash keys in your own systems. For more complex use cases don’t hesitate to contact us, we will be happy to help.
{{% /alert %}}
You can configure the serialization used through the `serialization_module` dictionary in the `wandb_artifact_configuration`. Please make sure the module is available on the machine running Dagster.
The integration will automatically know which serialization module to use when you read that Artifact.
The currently supported modules are `pickle`, `dill`, `cloudpickle`, and `joblib`.
Here’s a simplified example where we create a “model” serialized with joblib and then use it for inference.
```python
@asset(
name="my_joblib_serialized_model",
compute_kind="Python",
metadata={
"wandb_artifact_configuration": {
"type": "model",
"serialization_module": {
"name": "joblib"
},
}
},
io_manager_key="wandb_artifacts_manager",
)
def create_model_serialized_with_joblib():
# This is not a real ML model but this would not be possible with the pickle module
return lambda x, y: x + y
@asset(
name="inference_result_from_joblib_serialized_model",
compute_kind="Python",
ins={
"my_joblib_serialized_model": AssetIn(
input_manager_key="wandb_artifacts_manager",
)
},
metadata={
"wandb_artifact_configuration": {
"type": "results",
}
},
io_manager_key="wandb_artifacts_manager",
)
def use_model_serialized_with_joblib(
context: OpExecutionContext, my_joblib_serialized_model
):
inference_result = my_joblib_serialized_model(1, 2)
context.log.info(inference_result) # Prints: 3
return inference_result
```
### Advanced serialization formats (ONNX, PMML)
It’s common to use interchange file formats like ONNX and PMML. The integration supports those formats but it requires a bit more work than for Pickle-based serialization.
There are two different methods to use those formats.
1. Convert your model to the selected format, then return the string representation of that format as if it were a normal Python objects. The integration will pickle that string. You can then rebuild your model using that string.
2. Create a new local file with your serialized model, then build a custom Artifact with that file using the add_file configuration.
Here’s an example of a Scikit-learn model being serialized using ONNX.
```python
import numpy
import onnxruntime as rt
from skl2onnx import convert_sklearn
from skl2onnx.common.data_types import FloatTensorType
from sklearn.datasets import load_iris
from sklearn.ensemble import RandomForestClassifier
from sklearn.model_selection import train_test_split
from dagster import AssetIn, AssetOut, asset, multi_asset
@multi_asset(
compute_kind="Python",
outs={
"my_onnx_model": AssetOut(
metadata={
"wandb_artifact_configuration": {
"type": "model",
}
},
io_manager_key="wandb_artifacts_manager",
),
"my_test_set": AssetOut(
metadata={
"wandb_artifact_configuration": {
"type": "test_set",
}
},
io_manager_key="wandb_artifacts_manager",
),
},
group_name="onnx_example",
)
def create_onnx_model():
# Inspired from https://onnx.ai/sklearn-onnx/
# Train a model.
iris = load_iris()
X, y = iris.data, iris.target
X_train, X_test, y_train, y_test = train_test_split(X, y)
clr = RandomForestClassifier()
clr.fit(X_train, y_train)
# Convert into ONNX format
initial_type = [("float_input", FloatTensorType([None, 4]))]
onx = convert_sklearn(clr, initial_types=initial_type)
# Write artifacts (model + test_set)
return onx.SerializeToString(), {"X_test": X_test, "y_test": y_test}
@asset(
name="experiment_results",
compute_kind="Python",
ins={
"my_onnx_model": AssetIn(
input_manager_key="wandb_artifacts_manager",
),
"my_test_set": AssetIn(
input_manager_key="wandb_artifacts_manager",
),
},
group_name="onnx_example",
)
def use_onnx_model(context, my_onnx_model, my_test_set):
# Inspired from https://onnx.ai/sklearn-onnx/
# Compute the prediction with ONNX Runtime
sess = rt.InferenceSession(my_onnx_model)
input_name = sess.get_inputs()[0].name
label_name = sess.get_outputs()[0].name
pred_onx = sess.run(
[label_name], {input_name: my_test_set["X_test"].astype(numpy.float32)}
)[0]
context.log.info(pred_onx)
return pred_onx
```
### Using partitions
The integration natively supports [Dagster partitions](https://docs.dagster.io/concepts/partitions-schedules-sensors/partitions).
You can selectively read one, multiple, or all partitions of an asset.
All partitions are provided in a dictionary, with the key and value representing the partition key and the Artifact content, respectively.
{{< tabpane text=true >}}
{{% tab "Read all partitions" %}}
It reads all partitions of the upstream `@asset`, which are given as a dictionary. In this dictionary, the key and value correlate to the partition key and the Artifact content, respectively.
```python
@asset(
compute_kind="wandb",
ins={"my_daily_partitioned_asset": AssetIn()},
output_required=False,
)
def read_all_partitions(context, my_daily_partitioned_asset):
for partition, content in my_daily_partitioned_asset.items():
context.log.info(f"partition={partition}, content={content}")
```
{{% /tab %}}
{{% tab "Read specific partitions" %}}
The `AssetIn`'s `partition_mapping` configuration allows you to choose specific partitions. In this case, we are employing the `TimeWindowPartitionMapping`.
```python
@asset(
partitions_def=DailyPartitionsDefinition(start_date="2023-01-01", end_date="2023-02-01"),
compute_kind="wandb",
ins={
"my_daily_partitioned_asset": AssetIn(
partition_mapping=TimeWindowPartitionMapping(start_offset=-1)
)
},
output_required=False,
)
def read_specific_partitions(context, my_daily_partitioned_asset):
for partition, content in my_daily_partitioned_asset.items():
context.log.info(f"partition={partition}, content={content}")
```
{{% /tab %}}
{{< /tabpane >}}
The configuration object, `metadata`, is used to configure how Weights & Biases (wandb) interacts with different artifact partitions in your project.
The object `metadata` contains a key named `wandb_artifact_configuration` which further contains a nested object `partitions`.
The `partitions` object maps the name of each partition to its configuration. The configuration for each partition can specify how to retrieve data from it. These configurations can contain different keys, namely `get`, `version`, and `alias`, depending on the requirements of each partition.
**Configuration keys**
1. `get`:
The `get` key specifies the name of the W&B Object (Table, Image...) where to fetch the data.
2. `version`:
The `version` key is used when you want to fetch a specific version for the Artifact.
3. `alias`:
The `alias` key allows you to get the Artifact by its alias.
**Wildcard configuration**
The wildcard `"*"` stands for all non-configured partitions. This provides a default configuration for partitions that are not explicitly mentioned in the `partitions` object.
For example,
```python
"*": {
"get": "default_table_name",
},
```
This configuration means that for all partitions not explicitly configured, data is fetched from the table named `default_table_name`.
**Specific partition configuration**
You can override the wildcard configuration for specific partitions by providing their specific configurations using their keys.
For example,
```python
"yellow": {
"get": "custom_table_name",
},
```
This configuration means that for the partition named `yellow`, data will be fetched from the table named `custom_table_name`, overriding the wildcard configuration.
**Versioning and aliasing**
For versioning and aliasing purposes, you can provide specific `version` and `alias` keys in your configuration.
For versions,
```python
"orange": {
"version": "v0",
},
```
This configuration will fetch data from the version `v0` of the `orange` Artifact partition.
For aliases,
```python
"blue": {
"alias": "special_alias",
},
```
This configuration will fetch data from the table `default_table_name` of the Artifact partition with the alias `special_alias` (referred to as `blue` in the configuration).
### Advanced usage
To view advanced usage of the integration please refer to the following full code examples:
* [Advanced usage example for assets](https://github.com/dagster-io/dagster/blob/master/examples/with_wandb/with_wandb/assets/advanced_example.py)
* [Partitioned job example](https://github.com/dagster-io/dagster/blob/master/examples/with_wandb/with_wandb/ops/partitioned_job.py)
* [Linking a model to the Model Registry](https://github.com/dagster-io/dagster/blob/master/examples/with_wandb/with_wandb/assets/model_registry_example.py)
## Using W&B Launch
{{% alert color="secondary" %}}
Beta product in active development
Interested in Launch? Reach out to your account team to talk about joining the customer pilot program for W&B Launch.
Pilot customers need to use AWS EKS or SageMaker to qualify for the beta program. We ultimately plan to support additional platforms.
{{% /alert %}}
Before continuing, we recommend you to have a good understanding of how to use W&B Launch. Consider, reading the Guide on Launch: /guides/launch.
The Dagster integration helps with:
* Running one or multiple Launch agents in your Dagster instance.
* Executing local Launch jobs within your Dagster instance.
* Remote Launch jobs on-prem or in a cloud.
### Launch agents
The integration provides an importable `@op` called `run_launch_agent`. It starts a Launch Agent and runs it as a long running process until stopped manually.
Agents are processes that poll launch queues and execute the jobs (or dispatch them to external services to be executed) in order.
Refer to the [reference documentation]({{< relref "/launch/" >}}) for configuration
You can also view useful descriptions for all properties in Launchpad.
{{< img src="/images/integrations/dagster_launch_agents.png" alt="" >}}
Simple example
```python
# add this to your config.yaml
# alternatively you can set the config in Dagit's Launchpad or JobDefinition.execute_in_process
# Reference: https://docs.dagster.io/concepts/configuration/config-schema#specifying-runtime-configuration
resources:
wandb_config:
config:
entity: my_entity # replace this with your W&B entity
project: my_project # replace this with your W&B project
ops:
run_launch_agent:
config:
max_jobs: -1
queues:
- my_dagster_queue
from dagster_wandb.launch.ops import run_launch_agent
from dagster_wandb.resources import wandb_resource
from dagster import job, make_values_resource
@job(
resource_defs={
"wandb_config": make_values_resource(
entity=str,
project=str,
),
"wandb_resource": wandb_resource.configured(
{"api_key": {"env": "WANDB_API_KEY"}}
),
},
)
def run_launch_agent_example():
run_launch_agent()
```
### Launch jobs
The integration provides an importable `@op` called `run_launch_job`. It executes your Launch job.
A Launch job is assigned to a queue in order to be executed. You can create a queue or use the default one. Make sure you have an active agent listening to that queue. You can run an agent inside your Dagster instance but can also consider using a deployable agent in Kubernetes.
Refer to the [reference documentation]({{< relref "/launch/" >}}) for configuration.
You can also view useful descriptions for all properties in Launchpad.
{{< img src="/images/integrations/dagster_launch_jobs.png" alt="" >}}
Simple example
```python
# add this to your config.yaml
# alternatively you can set the config in Dagit's Launchpad or JobDefinition.execute_in_process
# Reference: https://docs.dagster.io/concepts/configuration/config-schema#specifying-runtime-configuration
resources:
wandb_config:
config:
entity: my_entity # replace this with your W&B entity
project: my_project # replace this with your W&B project
ops:
my_launched_job:
config:
entry_point:
- python
- train.py
queue: my_dagster_queue
uri: https://github.com/wandb/example-dagster-integration-with-launch
from dagster_wandb.launch.ops import run_launch_job
from dagster_wandb.resources import wandb_resource
from dagster import job, make_values_resource
@job(resource_defs={
"wandb_config": make_values_resource(
entity=str,
project=str,
),
"wandb_resource": wandb_resource.configured(
{"api_key": {"env": "WANDB_API_KEY"}}
),
},
)
def run_launch_job_example():
run_launch_job.alias("my_launched_job")() # we rename the job with an alias
```
## Best practices
1. Use the IO Manager to read and write Artifacts.
You should never need to use [`Artifact.download()`]({{< relref "/ref/python/artifact.md#download" >}}) or [`Run.log_artifact()`]({{< relref "/ref/python/run.md#log_artifact" >}}) directly. Those methods are handled by integration. Simply return the data you wish to store in Artifact and let the integration do the rest. This will provide better lineage for the Artifact in W&B.
2. Only build an Artifact object yourself for complex use cases.
Python objects and W&B objects should be returned from your ops/assets. The integration handles bundling the Artifact.
For complex use cases, you can build an Artifact directly in a Dagster job. We recommend you pass an Artifact object to the integration for metadata enrichment such as the source integration name and version, the python version used, the pickle protocol version and more.
3. Add files, directories and external references to your Artifacts through the metadata.
Use the integration `wandb_artifact_configuration` object to add any file, directory or external references (Amazon S3, GCS, HTTP…). See the advanced example in the [Artifact configuration section]({{< relref "#configuration-1" >}}) for more information.
4. Use an @asset instead of an @op when an Artifact is produced.
Artifacts are assets. It is recommended to use an asset when Dagster maintains that asset. This will provide better observability in the Dagit Asset Catalog.
5. Use a SourceAsset to consume an Artifact created outside Dagster.
This allows you to take advantage of the integration to read externally created Artifacts. Otherwise, you can only use Artifacts created by the integration.
6. Use W&B Launch to orchestrate training on dedicated compute for large models.
You can train small models inside your Dagster cluster and you can run Dagster in a Kubernetes cluster with GPU nodes. We recommend using W&B Launch for large model training. This will prevent overloading your instance and provide access to more adequate compute.
7. When experiment tracking within Dagster, set your W&B Run ID to the value of your Dagster Run ID.
We recommend that you both: make the [Run resumable]({{< relref "/guides/models/track/runs/resuming.md" >}}) and set the W&B Run ID to the Dagster Run ID or to a string of your choice. Following this recommendation ensures your W&B metrics and W&B Artifacts are stored in the same W&B Run when you train models inside of Dagster.
Either set the W&B Run ID to the Dagster Run ID.
```python
wandb.init(
id=context.run_id,
resume="allow",
...
)
```
Or choose your own W&B Run ID and pass it to the IO Manager configuration.
```python
wandb.init(
id="my_resumable_run_id",
resume="allow",
...
)
@job(
resource_defs={
"io_manager": wandb_artifacts_io_manager.configured(
{"wandb_run_id": "my_resumable_run_id"}
),
}
)
```
8. Only collect data you need with get or get_path for large W&B Artifacts.
By default, the integration will download an entire Artifact. If you are using very large artifacts you might want to only collect the specific files or objects you need. This will improve speed and resource utilization.
9. For Python objects adapt the pickling module to your use case.
By default, the W&B integration will use the standard [pickle](https://docs.python.org/3/library/pickle.html) module. But some objects are not compatible with it. For example, functions with yield will raise an error if you try to pickle them. W&B supports other Pickle-based serialization modules ([dill](https://github.com/uqfoundation/dill), [cloudpickle](https://github.com/cloudpipe/cloudpickle), [joblib](https://github.com/joblib/joblib)).
You can also use more advanced serialization like [ONNX](https://onnx.ai/) or [PMML](https://en.wikipedia.org/wiki/Predictive_Model_Markup_Language) by returning a serialized string or creating an Artifact directly. The right choice will depend on your use case, refer to the available literature on this subject.
# Launch multinode jobs with Volcano
This tutorial will guide you through the process of launching multinode training jobs with W&B and Volcano on Kubernetes.
## Overview
In this tutorial, you will learn how to use W&B Launch to run multinode jobs on Kubernetes. The steps we will follow are:
- Ensure that you have a Weights & Biases account and a Kubernetes cluster.
- Create a launch queue for our volcano jobs.
- Deploy a Launch agent into our kubernetes cluster.
- Create a distributed training job.
- Launch our distributed training.
## Prerequisites
Before you get started, you will need:
- A Weights & Biases account
- A Kubernetes cluster
## Create a launch queue
The first step is to create a launch queue. Head to [wandb.ai/launch](https://wandb.ai/launch) and in the top right corner of your screen, hit the blue **Create a queue** button. A queue creation drawer will slide out from the right side of your screen. Select an entity, enter a name, and select **Kubernetes** as the type for your queue.
In the configuration section, we will enter a [volcano job](https://volcano.sh/en/docs/vcjob/) template. Any runs launched from this queue will be created using this job specification, so you can modify this configuration as needed to customize your jobs.
This configuration block can accept a Kubernetes job specification, volcano job specification, or any other custom resource definition (CRD) that you are interested in launching. You can make use of [macros in the configuration block]({{< relref "/launch/set-up-launch/" >}}) to dynamically set the contents of this spec.
In this tutorial, we will use a configuration for multinode pytorch training that makes use of [volcano's pytorch plugin](https://github.com/volcano-sh/volcano/blob/master/docs/user-guide/how_to_use_pytorch_plugin.md). You can copy and paste the following config as YAML or JSON:
{{< tabpane text=true >}}
{{% tab "YAML" %}}
```yaml
kind: Job
spec:
tasks:
- name: master
policies:
- event: TaskCompleted
action: CompleteJob
replicas: 1
template:
spec:
containers:
- name: master
image: ${image_uri}
imagePullPolicy: IfNotPresent
restartPolicy: OnFailure
- name: worker
replicas: 1
template:
spec:
containers:
- name: worker
image: ${image_uri}
workingDir: /home
imagePullPolicy: IfNotPresent
restartPolicy: OnFailure
plugins:
pytorch:
- --master=master
- --worker=worker
- --port=23456
minAvailable: 1
schedulerName: volcano
metadata:
name: wandb-job-${run_id}
labels:
wandb_entity: ${entity_name}
wandb_project: ${project_name}
namespace: wandb
apiVersion: batch.volcano.sh/v1alpha1
```
{{% /tab %}}
{{% tab "JSON" %}}
```json
{
"kind": "Job",
"spec": {
"tasks": [
{
"name": "master",
"policies": [
{
"event": "TaskCompleted",
"action": "CompleteJob"
}
],
"replicas": 1,
"template": {
"spec": {
"containers": [
{
"name": "master",
"image": "${image_uri}",
"imagePullPolicy": "IfNotPresent"
}
],
"restartPolicy": "OnFailure"
}
}
},
{
"name": "worker",
"replicas": 1,
"template": {
"spec": {
"containers": [
{
"name": "worker",
"image": "${image_uri}",
"workingDir": "/home",
"imagePullPolicy": "IfNotPresent"
}
],
"restartPolicy": "OnFailure"
}
}
}
],
"plugins": {
"pytorch": [
"--master=master",
"--worker=worker",
"--port=23456"
]
},
"minAvailable": 1,
"schedulerName": "volcano"
},
"metadata": {
"name": "wandb-job-${run_id}",
"labels": {
"wandb_entity": "${entity_name}",
"wandb_project": "${project_name}"
},
"namespace": "wandb"
},
"apiVersion": "batch.volcano.sh/v1alpha1"
}
```
{{% /tab %}}
{{< /tabpane >}}
Click the **Create queue** button at the bottom of the drawer to finish creating your queue.
## Install Volcano
To install Volcano in your Kubernetes cluster, you can follow the [official installation guide](https://volcano.sh/en/docs/installation/).
## Deploy your launch agent
Now that you have created a queue, you will need to deploy a launch agent to pull and execute jobs from the queue. The easiest way to do this is with the [`launch-agent` chart from W&B's official `helm-charts` repository](https://github.com/wandb/helm-charts/tree/main/charts/launch-agent). Follow the instructions in the README to install the chart into your Kubernetes cluster, and be sure to configure the agent to poll the queue you created earlier.
## Create a training job
Volcano's pytorch plugin automatically configures the necessary environment variables for pytorch DPP to work, such as `MASTER_ADDR`, `RANK`, and `WORLD_SIZE`, as long as your pytorch code uses DDP correctly. Refer to [pytorch's documentation](https://pytorch.org/tutorials/intermediate/ddp_tutorial.html) for more details on how to use DDP in your custom python code.
{{% alert %}}
Volcano's pytorch plugin is also compatible with [multinode training via the PyTorch Lightning `Trainer`](https://lightning.ai/docs/pytorch/stable/common/trainer.html#num-nodes).
{{% /alert %}}
## Launch 🚀
Now that our queue and cluster are set up, it's time to launch some distributed training. To start off with we will use [a job](https://wandb.ai/wandb/multinodetest/jobs/QXJ0aWZhY3RDb2xsZWN0aW9uOjc3MDcwNTg1/runs/latest) trains a simple multi-layer perceptron on random data using volcano's pytorch plugin. You can find the source code for the job [here](https://github.com/wandb/launch-jobs/tree/main/jobs/distributed_test).
To launch this job, head to the [job's page](https://wandb.ai/wandb/multinodetest/jobs/QXJ0aWZhY3RDb2xsZWN0aW9uOjc3MDcwNTg1/runs/latest) and click the **Launch** button in the top right corner of the screen. You will be prompted to select a queue to launch the job from.
{{< img src="/images/launch/launching_multinode_job.png" alt="" >}}
1. Set the jobs parameters however you like,
2. Select the queue you created earlier.
3. Modify the volcano job in the **Resource config** section to modify the parameters of your job. For example, you can change the number of workers by changing the `replicas` field in the `worker` task.
4. Click **Launch** 🚀
You can monitor the progress and if necessary stop your job from the W&B UI.
# NVIDIA NeMo Inference Microservice Deploy Job
Deploy a model artifact from W&B to a NVIDIA NeMo Inference Microservice. To do this, use W&B Launch. W&B Launch converts model artifacts to NVIDIA NeMo Model and deploys to a running NIM/Triton server.
W&B Launch currently accepts the following compatible model types:
1. [Llama2](https://llama.meta.com/llama2/)
2. [StarCoder](https://github.com/bigcode-project/starcoder)
3. NV-GPT (coming soon)
{{% alert %}}
Deployment time varies by model and machine type. The base Llama2-7b config takes about 1 minute on GCP's `a2-ultragpu-1g`.
{{% /alert %}}
## Quickstart
1. [Create a launch queue]({{< relref "../create-and-deploy-jobs/add-job-to-queue.md" >}}) if you don't have one already. See an example queue config below.
```yaml
net: host
gpus: all # can be a specific set of GPUs or `all` to use everything
runtime: nvidia # also requires nvidia container runtime
volume:
- model-store:/model-store/
```
{{< img src="/images/integrations/nim1.png" alt="image" >}}
2. Create this job in your project:
```bash
wandb job create -n "deploy-to-nvidia-nemo-inference-microservice" \
-e $ENTITY \
-p $PROJECT \
-E jobs/deploy_to_nvidia_nemo_inference_microservice/job.py \
-g andrew/nim-updates \
git https://github.com/wandb/launch-jobs
```
3. Launch an agent on your GPU machine:
```bash
wandb launch-agent -e $ENTITY -p $PROJECT -q $QUEUE
```
4. Submit the deployment launch job with your desired configs from the [Launch UI](https://wandb.ai/launch)
1. You can also submit via the CLI:
```bash
wandb launch -d gcr.io/playground-111/deploy-to-nemo:latest \
-e $ENTITY \
-p $PROJECT \
-q $QUEUE \
-c $CONFIG_JSON_FNAME
```
{{< img src="/images/integrations/nim2.png" alt="image" >}}
5. You can track the deployment process in the Launch UI.
{{< img src="/images/integrations/nim3.png" alt="image" >}}
6. Once complete, you can immediately curl the endpoint to test the model. The model name is always `ensemble`.
```bash
#!/bin/bash
curl -X POST "http://0.0.0.0:9999/v1/completions" \
-H "accept: application/json" \
-H "Content-Type: application/json" \
-d '{
"model": "ensemble",
"prompt": "Tell me a joke",
"max_tokens": 256,
"temperature": 0.5,
"n": 1,
"stream": false,
"stop": "string",
"frequency_penalty": 0.0
}'
```
# Spin up a single node GPU cluster with Minikube
Set up W&B Launch on a Minikube cluster that can schedule and run GPU workloads.
{{% alert %}}
This tutorial is intended to guide users with direct access to a machine that has multiple GPUs. This tutorial is not intended for users who rent a cloud machine.
W&B recommends you create a Kubernetes cluster with GPU support that uses your cloud provider, if you want to set up a minikube cluster on a cloud machine. For example, AWS, GCP, Azure, Coreweave, and other cloud providers have tools to create Kubernetes clusters with GPU support.
W&B recommends you use a [Launch Docker queue]({{< relref "/launch/set-up-launch/setup-launch-docker" >}}) if you want to set up a minikube cluster for scheduling GPUs on a machine that has a single GPU. You can still follow the tutorial for fun, but the GPU scheduling will not be very useful.
{{% /alert %}}
## Background
The [Nvidia container toolkit](https://docs.nvidia.com/datacenter/cloud-native/container-toolkit/latest/index.html) has made it easy to run GPU-enabled workflows on Docker. One limitation is a lack of native support for scheduling GPU by volume. If you want to use a GPU with the `docker run` command you must either request specific GPU by ID or all GPU present, which makes many distributed GPU enabled workloads impractical. Kubernetes offers support for scheduling by a volume request, but setting up a local Kubernetes cluster with GPU scheduling can take considerable time and effort, until recently. Minikube, one of the most popular tools for running single node Kubernetes clusters, recently released [support for GPU scheduling](https://minikube.sigs.k8s.io/docs/tutorials/nvidia/) 🎉 In this tutorial, we will create a Minikube cluster on a multi-GPU machine and launch concurrent stable diffusion inference jobs to the cluster using W&B Launch 🚀
## Prerequisites
Before getting started, you will need:
1. A W&B account.
2. Linux machine with the following installed and running:
1. Docker runtime
2. Drivers for any GPU you want to use
3. Nvidia container toolkit
{{% alert %}}
For testing and creating this tutorial, we used an `n1-standard-16` Google Cloud Compute Engine instance with 4 NVIDIA Tesla T4 GPU connected.
{{% /alert %}}
## Create a queue for launch jobs
First, create a launch queue for our launch jobs.
1. Navigate to [wandb.ai/launch](https://wandb.ai/launch) (or `/launch` if you use a private W&B server).
2. In the top right corner of your screen, click the blue **Create a queue** button. A queue creation drawer will slide out from the right side of your screen.
3. Select an entity, enter a name, and select **Kubernetes** as the type for your queue.
4. The **Config** section of the drawer is where you will enter a [Kubernetes job specification](https://kubernetes.io/docs/concepts/workloads/controllers/job/) for the launch queue. Any runs launched from this queue will be created using this job specification, so you can modify this configuration as needed to customize your jobs. For this tutorial, you can copy and paste the sample config below in your queue config as YAML or JSON:
{{< tabpane text=true >}}
{{% tab "YAML" %}}
```yaml
spec:
template:
spec:
containers:
- image: ${image_uri}
resources:
limits:
cpu: 4
memory: 12Gi
nvidia.com/gpu: '{{gpus}}'
restartPolicy: Never
backoffLimit: 0
```
{{% /tab %}}
{{% tab "JSON" %}}
```json
{
"spec": {
"template": {
"spec": {
"containers": [
{
"image": "${image_uri}",
"resources": {
"limits": {
"cpu": 4,
"memory": "12Gi",
"nvidia.com/gpu": "{{gpus}}"
}
}
}
],
"restartPolicy": "Never"
}
},
"backoffLimit": 0
}
}
```
{{% /tab %}}
{{< /tabpane >}}
For more information about queue configurations, see the [Set up Launch on Kubernetes]({{< relref "/launch/set-up-launch/setup-launch-kubernetes.md" >}}) and the [Advanced queue setup guide]({{< relref "/launch/set-up-launch/setup-queue-advanced.md" >}}).
The `${image_uri}` and `{{gpus}}` strings are examples of the two kinds of
variable templates that you can use in your queue configuration. The `${image_uri}`
template will be replaced with the image URI of the job you are launching by the
agent. The `{{gpus}}` template will be used to create a template variable that
you can override from the launch UI, CLI, or SDK when submitting a job. These values
are placed in the job specification so that they will modify the correct fields
to control the image and GPU resources used by the job.
5. Click the **Parse configuration** button to begin customizing your `gpus` template
variable.
6. Set the **Type** to `Integer` and the **Default**, **Min**, and **Max** to values of your choosing.
Attempts to submit a run to this queue which violate the constraints of the template variable will
be rejected.
{{< img src="/images/tutorials/minikube_gpu/create_queue.png" alt="Image of queue creation drawer with gpus template variable" >}}
7. Click **Create queue** to create your queue. You will be redirected to the queue page for your new queue.
In the next section, we will set up an agent that can pull and execute jobs from the queue you created.
## Setup Docker + NVIDIA CTK
If you already have Docker and the Nvidia container toolkit setup on your machine, you can skip this section.
Refer to [Docker’s documentation](https://docs.docker.com/engine/install/) for instructions on setting up the Docker container engine on your system.
Once you have Docker installed, install the Nvidia container toolkit [following the instructions in Nvidia’s documentation](https://docs.nvidia.com/datacenter/cloud-native/container-toolkit/latest/install-guide.html).
To validate that your container runtime has access to your GPU, you can run:
```bash
docker run --gpus all ubuntu nvidia-smi
```
You should see `nvidia-smi` output describing the GPU connected to your machine. For example, on our setup the output looks like this:
```
Wed Nov 8 23:25:53 2023
+-----------------------------------------------------------------------------+
| NVIDIA-SMI 525.105.17 Driver Version: 525.105.17 CUDA Version: 12.0 |
|-------------------------------+----------------------+----------------------+
| GPU Name Persistence-M| Bus-Id Disp.A | Volatile Uncorr. ECC |
| Fan Temp Perf Pwr:Usage/Cap| Memory-Usage | GPU-Util Compute M. |
| | | MIG M. |
|===============================+======================+======================|
| 0 Tesla T4 Off | 00000000:00:04.0 Off | 0 |
| N/A 38C P8 9W / 70W | 2MiB / 15360MiB | 0% Default |
| | | N/A |
+-------------------------------+----------------------+----------------------+
| 1 Tesla T4 Off | 00000000:00:05.0 Off | 0 |
| N/A 38C P8 9W / 70W | 2MiB / 15360MiB | 0% Default |
| | | N/A |
+-------------------------------+----------------------+----------------------+
| 2 Tesla T4 Off | 00000000:00:06.0 Off | 0 |
| N/A 40C P8 9W / 70W | 2MiB / 15360MiB | 0% Default |
| | | N/A |
+-------------------------------+----------------------+----------------------+
| 3 Tesla T4 Off | 00000000:00:07.0 Off | 0 |
| N/A 39C P8 9W / 70W | 2MiB / 15360MiB | 0% Default |
| | | N/A |
+-------------------------------+----------------------+----------------------+
+-----------------------------------------------------------------------------+
| Processes: |
| GPU GI CI PID Type Process name GPU Memory |
| ID ID Usage |
|=============================================================================|
| No running processes found |
+-----------------------------------------------------------------------------+
```
## Setup Minikube
Minikube’s GPU support requires version `v1.32.0` or later. Refer to [Minikube’s install documentation](https://minikube.sigs.k8s.io/docs/start/) for up to date installation help. For this tutorial, we installed the latest Minikube release using the command:
```yaml
curl -LO https://storage.googleapis.com/minikube/releases/latest/minikube-linux-amd64
sudo install minikube-linux-amd64 /usr/local/bin/minikube
```
The next step is to start a minikube cluster using your GPU. On your machine, run:
```yaml
minikube start --gpus all
```
The output of the command above will indicate whether a cluster has been successfully created.
## Start launch agent
The launch agent for your new cluster can either be started by invoking `wandb launch-agent` directly or by deploying the launch agent using a [helm chart managed by W&B](https://github.com/wandb/helm-charts/tree/main/charts/launch-agent).
In this tutorial we will run the agent directly on our host machine.
{{% alert %}}
Running the agent outside of a container also means we can use the local Docker host to build images for our cluster to run.
{{% /alert %}}
To run the agent locally, make sure your default Kubernetes API context refers to the Minikube cluster. Then, execute the following:
```bash
pip install "wandb[launch]"
```
to install the agent’s dependencies. To setup authentication for the agent, run `wandb login` or set the `WANDB_API_KEY` environment variable.
To start the agent, execute this command:
```bash
wandb launch-agent -j -q -e
```
Within your terminal you should see the launch agent start to print polling message.
Congratulations, you have a launch agent polling your launch queue. When a job is added to your queue, your agent will pick it up and schedule it to run on your Minikube cluster.
## Launch a job
Let's send a job to our agent. You can launch a simple "hello world" from a terminal logged into your W&B account with:
```yaml
wandb launch -d wandb/job_hello_world:main -p -q -e
```
You can test with any job or image you like, but make sure your cluster can pull your image. See [Minikube’s documentation](https://minikube.sigs.k8s.io/docs/handbook/registry/) for additional guidance. You can also [test using one of our public jobs](https://wandb.ai/wandb/jobs/jobs?workspace=user-bcanfieldsherman).
## (Optional) Model and data caching with NFS
For ML workloads we will often want multiple jobs to have access to the same data. For example, you might want to have a shared cache to avoid repeatedly downloading large assets like datasets or model weights. Kubernetes supports this through [persistent volumes and persistent volume claims](https://kubernetes.io/docs/concepts/storage/persistent-volumes/). Persistent volumes can be used to create `volumeMounts` in our Kubernetes workloads, providing direct filesystem access to the shared cache.
In this step, we will set up a network file system (NFS) server that can be used as a shared cache for model weights. The first step is to install and configure NFS. This process varies by operating system. Since our VM is running Ubuntu, we installed nfs-kernel-server and configured an export at `/srv/nfs/kubedata`:
```bash
sudo apt-get install nfs-kernel-server
sudo mkdir -p /srv/nfs/kubedata
sudo chown nobody:nogroup /srv/nfs/kubedata
sudo sh -c 'echo "/srv/nfs/kubedata *(rw,sync,no_subtree_check,no_root_squash,no_all_squash,insecure)" >> /etc/exports'
sudo exportfs -ra
sudo systemctl restart nfs-kernel-server
```
Keep note of the export location of the server in your host filesystem, as well as the local IP address of your NFS server. You need this information in the next step.
Next, you will need to create a persistent volume and persistent volume claim for this NFS. Persistent volumes are highly customizable, but we will use straightforward configuration here for the sake of simplicity.
Copy the yaml below into a file named `nfs-persistent-volume.yaml` , making sure to fill out your desired volume capacity and claim request. The `PersistentVolume.spec.capcity.storage` field controls the maximum size of the underlying volume. The `PersistentVolumeClaim.spec.resources.requests.stroage` can be used to limit the volume capacity allotted for a particular claim. For our use case, it makes sense to use the same value for each.
```yaml
apiVersion: v1
kind: PersistentVolume
metadata:
name: nfs-pv
spec:
capacity:
storage: 100Gi # Set this to your desired capacity.
accessModes:
- ReadWriteMany
nfs:
server: # TODO: Fill this in.
path: '/srv/nfs/kubedata' # Or your custom path
---
apiVersion: v1
kind: PersistentVolumeClaim
metadata:
name: nfs-pvc
spec:
accessModes:
- ReadWriteMany
resources:
requests:
storage: 100Gi # Set this to your desired capacity.
storageClassName: ''
volumeName: nfs-pv
```
Create the resources in your cluster with:
```yaml
kubectl apply -f nfs-persistent-volume.yaml
```
In order for our runs to make use of this cache, we will need to add `volumes` and `volumeMounts` to our launch queue config. To edit the launch config, head back to [wandb.ai/launch](http://wandb.ai/launch) (or \/launch for users on wandb server), find your queue, click to the queue page, and then click the **Edit config** tab. The original config can be modified to:
{{< tabpane text=true >}}
{{% tab "YAML" %}}
```yaml
spec:
template:
spec:
containers:
- image: ${image_uri}
resources:
limits:
cpu: 4
memory: 12Gi
nvidia.com/gpu: "{{gpus}}"
volumeMounts:
- name: nfs-storage
mountPath: /root/.cache
restartPolicy: Never
volumes:
- name: nfs-storage
persistentVolumeClaim:
claimName: nfs-pvc
backoffLimit: 0
```
{{% /tab %}}
{{% tab "JSON" %}}
```json
{
"spec": {
"template": {
"spec": {
"containers": [
{
"image": "${image_uri}",
"resources": {
"limits": {
"cpu": 4,
"memory": "12Gi",
"nvidia.com/gpu": "{{gpus}}"
},
"volumeMounts": [
{
"name": "nfs-storage",
"mountPath": "/root/.cache"
}
]
}
}
],
"restartPolicy": "Never",
"volumes": [
{
"name": "nfs-storage",
"persistentVolumeClaim": {
"claimName": "nfs-pvc"
}
}
]
}
},
"backoffLimit": 0
}
}
```
{{% /tab %}}
{{< /tabpane >}}
Now, our NFS will be mounted at `/root/.cache` in the containers running our jobs. The mount path will require adjustment if your container runs as a user other than `root`. Huggingface’s libraries and W&B Artifacts both make use of `$HOME/.cache/` by default, so downloads should only happen once.
## Playing with stable diffusion
To test out our new system, we are going to experiment with stable diffusion’s inference parameters.
To run a simple stable diffusion inference job with a default prompt and sane
parameters, you can run:
```
wandb launch -d wandb/job_stable_diffusion_inference:main -p -q -e
```
The command above will submit the container image `wandb/job_stable_diffusion_inference:main` to your queue.
Once your agent picks up the job and schedules it for execution on your cluster,
it may take a while for the image to be pulled, depending on your connection.
You can follow the status of the job on the queue page on [wandb.ai/launch](http://wandb.ai/launch) (or \/launch for users on wandb server).
Once the run has finished, you should have a job artifact in the project you specified.
You can check your project's job page (`/jobs`) to find the job artifact. Its default name should
be `job-wandb_job_stable_diffusion_inference` but you can change that to whatever you like on the job's page
by clicking the pencil icon next to the job name.
You can now use this job to run more stable diffusion inference on your cluster.
From the job page, we can click the **Launch** button in the top right hand corner
to configure a new inference job and submit it to our queue. The job configuration
page will be pre-populated with the parameters from the original run, but you can
change them to whatever you like by modifying their values in the **Overrides** section
of the launch drawer.
{{< img src="/images/tutorials/minikube_gpu/sd_launch_drawer.png" alt="Image of launch UI for stable diffusion inference job" >}}
# launch-library
## Classes
[`class LaunchAgent`](./launchagent.md): Launch agent class which polls run given run queues and launches runs for wandb launch.
## Functions
[`launch(...)`](./launch.md): Launch a W&B launch experiment.
[`launch_add(...)`](./launch_add.md): Enqueue a W&B launch experiment. With either a source uri, job or docker_image.
# launch api
{{< cta-button githubLink=https://www.github.com/wandb/wandb/tree/v0.20.1/wandb/sdk/launch/_launch.py#L249-L331 >}}
Launch a W&B launch experiment.
```python
launch(
api: Api,
job: Optional[str] = None,
entry_point: Optional[List[str]] = None,
version: Optional[str] = None,
name: Optional[str] = None,
resource: Optional[str] = None,
resource_args: Optional[Dict[str, Any]] = None,
project: Optional[str] = None,
entity: Optional[str] = None,
docker_image: Optional[str] = None,
config: Optional[Dict[str, Any]] = None,
synchronous: Optional[bool] = (True),
run_id: Optional[str] = None,
repository: Optional[str] = None
) -> AbstractRun
```
| Arguments | |
| :--- | :--- |
| `job` | string reference to a wandb.Job eg: wandb/test/my-job:latest |
| `api` | An instance of a wandb Api from wandb.apis.internal. |
| `entry_point` | Entry point to run within the project. Defaults to using the entry point used in the original run for wandb URIs, or main.py for git repository URIs. |
| `version` | For Git-based projects, either a commit hash or a branch name. |
| `name` | Name run under which to launch the run. |
| `resource` | Execution backend for the run. |
| `resource_args` | Resource related arguments for launching runs onto a remote backend. Will be stored on the constructed launch config under `resource_args`. |
| `project` | Target project to send launched run to |
| `entity` | Target entity to send launched run to |
| `config` | A dictionary containing the configuration for the run. May also contain resource specific arguments under the key "resource_args". |
| `synchronous` | Whether to block while waiting for a run to complete. Defaults to True. Note that if `synchronous` is False and `backend` is "local-container", this method will return, but the current process will block when exiting until the local run completes. If the current process is interrupted, any asynchronous runs launched via this method will be terminated. If `synchronous` is True and the run fails, the current process will error out as well. |
| `run_id` | ID for the run (To ultimately replace the :name: field) |
| `repository` | string name of repository path for remote registry |
#### Example:
```python
from wandb.sdk.launch import launch
job = "wandb/jobs/Hello World:latest"
params = {"epochs": 5}
# Run W&B project and create a reproducible docker environment
# on a local host
api = wandb.apis.internal.Api()
launch(api, job, parameters=params)
```
| Returns | |
| :--- | :--- |
| an instance of`wandb.launch.SubmittedRun` exposing information (e.g. run ID) about the launched run. |
| Raises | |
| :--- | :--- |
| `wandb.exceptions.ExecutionError` If a run launched in blocking mode is unsuccessful. |
# launch_add
{{< cta-button githubLink=https://www.github.com/wandb/wandb/tree/v0.20.1/wandb/sdk/launch/_launch_add.py#L34-L131 >}}
Enqueue a W&B launch experiment. With either a source uri, job or docker_image.
```python
launch_add(
uri: Optional[str] = None,
job: Optional[str] = None,
config: Optional[Dict[str, Any]] = None,
template_variables: Optional[Dict[str, Union[float, int, str]]] = None,
project: Optional[str] = None,
entity: Optional[str] = None,
queue_name: Optional[str] = None,
resource: Optional[str] = None,
entry_point: Optional[List[str]] = None,
name: Optional[str] = None,
version: Optional[str] = None,
docker_image: Optional[str] = None,
project_queue: Optional[str] = None,
resource_args: Optional[Dict[str, Any]] = None,
run_id: Optional[str] = None,
build: Optional[bool] = (False),
repository: Optional[str] = None,
sweep_id: Optional[str] = None,
author: Optional[str] = None,
priority: Optional[int] = None
) -> "public.QueuedRun"
```
| Arguments | |
| :--- | :--- |
| `uri` | URI of experiment to run. A wandb run uri or a Git repository URI. |
| `job` | string reference to a wandb.Job eg: wandb/test/my-job:latest |
| `config` | A dictionary containing the configuration for the run. May also contain resource specific arguments under the key "resource_args" |
| `template_variables` | A dictionary containing values of template variables for a run queue. Expected format of `{"VAR_NAME": VAR_VALUE}` |
| `project` | Target project to send launched run to |
| `entity` | Target entity to send launched run to |
| `queue` | the name of the queue to enqueue the run to |
| `priority` | the priority level of the job, where 1 is the highest priority |
| `resource` | Execution backend for the run: W&B provides built-in support for "local-container" backend |
| `entry_point` | Entry point to run within the project. Defaults to using the entry point used in the original run for wandb URIs, or main.py for git repository URIs. |
| `name` | Name run under which to launch the run. |
| `version` | For Git-based projects, either a commit hash or a branch name. |
| `docker_image` | The name of the docker image to use for the run. |
| `resource_args` | Resource related arguments for launching runs onto a remote backend. Will be stored on the constructed launch config under `resource_args`. |
| `run_id` | optional string indicating the id of the launched run |
| `build` | optional flag defaulting to false, requires queue to be set if build, an image is created, creates a job artifact, pushes a reference to that job artifact to queue |
| `repository` | optional string to control the name of the remote repository, used when pushing images to a registry |
| `project_queue` | optional string to control the name of the project for the queue. Primarily used for back compatibility with project scoped queues |
#### Example:
```python
from wandb.sdk.launch import launch_add
project_uri = "https://github.com/wandb/examples"
params = {"alpha": 0.5, "l1_ratio": 0.01}
# Run W&B project and create a reproducible docker environment
# on a local host
api = wandb.apis.internal.Api()
launch_add(uri=project_uri, parameters=params)
```
| Returns | |
| :--- | :--- |
| an instance of`wandb.api.public.QueuedRun` which gives information about the queued run, or if `wait_until_started` or `wait_until_finished` are called, gives access to the underlying Run information. |
| Raises | |
| :--- | :--- |
| `wandb.exceptions.LaunchError` if unsuccessful |
# LaunchAgent
{{< cta-button githubLink=https://www.github.com/wandb/wandb/tree/v0.20.1/wandb/sdk/launch/agent/agent.py#L164-L924 >}}
Launch agent class which polls run given run queues and launches runs for wandb launch.
```python
LaunchAgent(
api: Api,
config: Dict[str, Any]
)
```
| Arguments | |
| :--- | :--- |
| `api` | Api object to use for making requests to the backend. |
| `config` | Config dictionary for the agent. |
| Attributes | |
| :--- | :--- |
| `num_running_jobs` | Return the number of jobs not including schedulers. |
| `num_running_schedulers` | Return just the number of schedulers. |
| `thread_ids` | Returns a list of keys running thread ids for the agent. |
## Methods
### `check_sweep_state`
[View source](https://www.github.com/wandb/wandb/tree/v0.20.1/wandb/sdk/launch/agent/agent.py#L786-L803)
```python
check_sweep_state(
launch_spec, api
)
```
Check the state of a sweep before launching a run for the sweep.
### `fail_run_queue_item`
[View source](https://www.github.com/wandb/wandb/tree/v0.20.1/wandb/sdk/launch/agent/agent.py#L295-L304)
```python
fail_run_queue_item(
run_queue_item_id, message, phase, files=None
)
```
### `finish_thread_id`
[View source](https://www.github.com/wandb/wandb/tree/v0.20.1/wandb/sdk/launch/agent/agent.py#L416-L509)
```python
finish_thread_id(
thread_id, exception=None
)
```
Removes the job from our list for now.
### `get_job_and_queue`
[View source](https://www.github.com/wandb/wandb/tree/v0.20.1/wandb/sdk/launch/agent/agent.py#L908-L915)
```python
get_job_and_queue()
```
### `initialized`
[View source](https://www.github.com/wandb/wandb/tree/v0.20.1/wandb/sdk/launch/agent/agent.py#L190-L193)
```python
@classmethod
initialized() -> bool
```
Return whether the agent is initialized.
### `loop`
[View source](https://www.github.com/wandb/wandb/tree/v0.20.1/wandb/sdk/launch/agent/agent.py#L572-L653)
```python
loop()
```
Loop infinitely to poll for jobs and run them.
| Raises | |
| :--- | :--- |
| `KeyboardInterrupt` | if the agent is requested to stop. |
### `name`
[View source](https://www.github.com/wandb/wandb/tree/v0.20.1/wandb/sdk/launch/agent/agent.py#L180-L188)
```python
@classmethod
name() -> str
```
Return the name of the agent.
### `pop_from_queue`
[View source](https://www.github.com/wandb/wandb/tree/v0.20.1/wandb/sdk/launch/agent/agent.py#L340-L363)
```python
pop_from_queue(
queue
)
```
Pops an item off the runqueue to run as a job.
| Arguments | |
| :--- | :--- |
| `queue` | Queue to pop from. |
| Returns | |
| :--- | :--- |
| Item popped off the queue. |
| Raises | |
| :--- | :--- |
| `Exception` | if there is an error popping from the queue. |
### `print_status`
[View source](https://www.github.com/wandb/wandb/tree/v0.20.1/wandb/sdk/launch/agent/agent.py#L365-L381)
```python
print_status() -> None
```
Prints the current status of the agent.
### `run_job`
[View source](https://www.github.com/wandb/wandb/tree/v0.20.1/wandb/sdk/launch/agent/agent.py#L511-L541)
```python
run_job(
job, queue, file_saver
)
```
Set up project and run the job.
| Arguments | |
| :--- | :--- |
| `job` | Job to run. |
### `task_run_job`
[View source](https://www.github.com/wandb/wandb/tree/v0.20.1/wandb/sdk/launch/agent/agent.py#L656-L688)
```python
task_run_job(
launch_spec, job, default_config, api, job_tracker
)
```
### `update_status`
[View source](https://www.github.com/wandb/wandb/tree/v0.20.1/wandb/sdk/launch/agent/agent.py#L383-L394)
```python
update_status(
status
)
```
Update the status of the agent.
| Arguments | |
| :--- | :--- |
| `status` | Status to update the agent to. |
# Reference
> Generated documentation for Weights & Biases APIs
{{< cardpane >}}
{{< card >}}
A beta query language to select and aggregate data.
{{< /card >}}
{{< /cardpane >}}
{{% alert %}}
Looking for Weave API? See the [W&B Weave Docs](https://weave-docs.wandb.ai/).
{{% /alert %}}
# Release Notes
This section includes release notes for supported W&B Server releases. For releases that are no longer supported, refer to [Archived releases]({{< relref "archived/" >}}).
# Command Line Interface
**Usage**
`wandb [OPTIONS] COMMAND [ARGS]...`
**Options**
| **Option** | **Description** |
| :--- | :--- |
| `--version` | Show the version and exit. |
**Commands**
| **Command** | **Description** |
| :--- | :--- |
| agent | Run the W&B agent |
| artifact | Commands for interacting with artifacts |
| beta | Beta versions of wandb CLI commands. |
| controller | Run the W&B local sweep controller |
| disabled | Disable W&B. |
| docker | Run your code in a docker container. |
| docker-run | Wrap `docker run` and adds WANDB_API_KEY and WANDB_DOCKER... |
| enabled | Enable W&B. |
| init | Configure a directory with Weights & Biases |
| job | Commands for managing and viewing W&B jobs |
| launch | Launch or queue a W&B Job. |
| launch-agent | Run a W&B launch agent. |
| launch-sweep | Run a W&B launch sweep (Experimental). |
| login | Login to Weights & Biases |
| offline | Disable W&B sync |
| online | Enable W&B sync |
| pull | Pull files from Weights & Biases |
| restore | Restore code, config and docker state for a run |
| scheduler | Run a W&B launch sweep scheduler (Experimental) |
| server | Commands for operating a local W&B server |
| status | Show configuration settings |
| sweep | Initialize a hyperparameter sweep. |
| sync | Upload an offline training directory to W&B |
| verify | Verify your local instance |
# JavaScript Library
> The W&B SDK for TypeScript, Node, and modern Web Browsers
Similar to our Python library, we offer a client to track experiments in JavaScript/TypeScript.
- Log metrics from your Node server and display them in interactive plots on W&B
- Debug LLM applications with interactive traces
- Debug [LangChain.js](https://github.com/hwchase17/langchainjs) usage
This library is compatible with Node and modern JS run times.
You can find the source code for the JavaScript client in the [Github repository](https://github.com/wandb/wandb-js).
{{% alert %}}
Our JavaScript integration is still in Beta, if you run into issues please let us know.
{{% /alert %}}
## Installation
```shell
npm install @wandb/sdk
# or ...
yarn add @wandb/sdk
```
## Usage
### TypeScript/ESM:
```typescript
import wandb from '@wandb/sdk'
async function track() {
await wandb.init({config: {test: 1}});
wandb.log({acc: 0.9, loss: 0.1});
wandb.log({acc: 0.91, loss: 0.09});
await wandb.finish();
}
await track()
```
{{% alert color="secondary" %}}
We spawn a separate MessageChannel to process all api calls async. This will cause your script to hang if you don't call `await wandb.finish()`.
{{% /alert %}}
### Node/CommonJS:
```javascript
const wandb = require('@wandb/sdk').default;
```
We're currently missing a lot of the functionality found in our Python SDK, but basic logging functionality is available. We'll be adding additional features like [Tables]({{< relref "/guides/models/tables/?utm_source=github&utm_medium=code&utm_campaign=wandb&utm_content=readme" >}}) soon.
## Authentication and Settings
In node environments we look for `process.env.WANDB_API_KEY` and prompt for it's input if we have a TTY. In non-node environments we look for `sessionStorage.getItem("WANDB_API_KEY")`. Additional settings can be [found here](https://github.com/wandb/wandb-js/blob/main/src/sdk/lib/config.ts).
## Integrations
Our [Python integrations]({{< relref "/guides/integrations/" >}}) are widely used by our community, and we hope to build out more JavaScript integrations to help LLM app builders leverage whatever tool they want.
If you have any requests for additional integrations, we'd love you to open an issue with details about the request.
## LangChain.js
This library integrates with the popular library for building LLM applications, [LangChain.js](https://github.com/hwchase17/langchainjs) version >= 0.0.75.
```typescript
import {WandbTracer} from '@wandb/sdk/integrations/langchain';
const wbTracer = await WandbTracer.init({project: 'langchain-test'});
// run your langchain workloads...
chain.call({input: "My prompt"}, wbTracer)
await WandbTracer.finish();
```
{{% alert color="secondary" %}}
We spawn a seperate MessageChannel to process all api calls async. This will cause your script to hang if you don't call `await WandbTracer.finish()`.
{{% /alert %}}
See [this test](https://github.com/wandb/wandb-js/blob/main/src/sdk/integrations/langchain/langchain.test.ts) for a more detailed example.
# Python Library
Use wandb to track machine learning work.
Train and fine-tune models, manage models from experimentation to production.
For guides and examples, see https://docs.wandb.ai.
For scripts and interactive notebooks, see https://github.com/wandb/examples.
For reference documentation, see https://docs.wandb.com/ref/python.
## Classes
[`class Artifact`](./artifact.md): Flexible and lightweight building block for dataset and model versioning.
[`class Run`](./run.md): A unit of computation logged by wandb. Typically, this is an ML experiment.
## Functions
[`agent(...)`](./agent.md): Start one or more sweep agents.
[`controller(...)`](./controller.md): Public sweep controller constructor.
[`finish(...)`](./finish.md): Finish a run and upload any remaining data.
[`init(...)`](./init.md): Start a new run to track and log to W&B.
[`log(...)`](./log.md): Upload run data.
[`login(...)`](./login.md): Set up W&B login credentials.
[`save(...)`](./save.md): Sync one or more files to W&B.
[`sweep(...)`](./sweep.md): Initialize a hyperparameter sweep.
[`watch(...)`](./watch.md): Hooks into the given PyTorch model(s) to monitor gradients and the model's computational graph.
| Other Members | |
| :--- | :--- |
| `__version__` | `'0.20.1'` |
| `config` | |
| `summary` | |
# Query Expression Language
Use the query expressions to select and aggregate data across runs and projects.
Learn more about [query panels]({{< relref "/guides/models/app/features/panels/query-panels/" >}}).
## Data Types
* [artifact](./artifact.md)
* [artifactType](./artifact-type.md)
* [artifactVersion](./artifact-version.md)
* [audio-file](./audio-file.md)
* [bokeh-file](./bokeh-file.md)
* [boolean](./boolean.md)
* [entity](./entity.md)
* [file](./file.md)
* [float](./float.md)
* [html-file](./html-file.md)
* [image-file](./image-file.md)
* [int](./int.md)
* [joined-table](./joined-table.md)
* [molecule-file](./molecule-file.md)
* [number](./number.md)
* [object3D-file](./object-3-d-file.md)
* [partitioned-table](./partitioned-table.md)
* [project](./project.md)
* [pytorch-model-file](./pytorch-model-file.md)
* [run](./run.md)
* [string](./string.md)
* [table](./table.md)
* [user](./user.md)
* [video-file](./video-file.md)
# Release Notes
This section includes release notes for supported W&B Server releases. For releases that are no longer supported, refer to [Archived releases]({{< relref "archived/" >}}).
# 0.69.x
> May 28, 2025
W&B 0.69 focuses on making the workspace more intuitive, collaborative, and efficient. Clearer visualizations and faster artifact downloads streamline how you interact with your data, so you can gain and share insights more quickly. Updates to Weave improve team workflows and evaluation tracking. A range of quality-of-life fixes tidy up the overall user experience.
This release also marks the end of life for v0.54 and older, which are now officially unsupported.
## Support and end of life
W&B Server v0.54 and below have reached end of life as of May 27, 2025.
W&B Server v0.56 is scheduled to reach end of life in July 2025
{{% readfile "/_includes/release-notes-support-eol-reminder.md" %}}
## Upgrading
To [upgrade]({{< relref "/guides/hosting/hosting-options/self-managed/server-upgrade-process.md#update-with-helm" >}}) to W&B v0.69.x, you must use v0.31.4+ of the `operator-wandb` Helm chart. Otherwise, after the upgrade, the `weave-cache-clear` container can fail to start. Ensure that your deployment uses these values:
```yaml
chart:
url: https://charts.wandb.ai
name: operator-wandb
version: 0.31.4
```
If you have questions or are experiencing issues with an upgrade, contact [support](mailto:support@wandb.com).
## Features
- You can now set a custom display name for a run directly in the workspace. Customized run names show up in all plots and tables but only in your workspace, with no impact on your teammates’ views. This provides a clearer and cleaner view in your workspace, with no more labels like `*...v6-final-restart...`* in every legend and plot.
- When filtering or grouping runs, colors can sometimes overlap and become indistinct. The run selector’s new **Randomize Colors** option reassigns random colors from the default palette to your current run selection or groups, helping to make the colors more distinguishable.
- In line plots, you can now use **Cmd+Click** on a line to open a single-run view in a new tab.
- Video media panels now provide more playback controls to play, pause, seek, view full screen, and adjust playback speed.
- Settings for all types of media panels have been reorganized and improved.
- You can now customize the point and background colors for point cloud panels.
- Team-level and organization-level service accounts can now interact with Registry.
- Improved Exponentially-weighted Moving Average (EMA) smoothing provides more reliable [smoothed lines]({{< relref "/guides/models/app/features/panels/line-plot/smoothing.md" >}}) when operating on complete, unbinned data. In most cases, smoothing is handled at the back end for improved performance. This feature was in private preview in v0.68.x.
### Private preview
Private preview features are available by invitation only. To request enrollment in a private preview, contact [support]({{< relref "mailto:support@wandb.com" >}}) or your AISE.
- You can now color all of your runs based on a secondary metric, such as loss or custom efficiency metrics. This creates a clear gradient color scale across your runs in all plots, so you can spot patterns faster. [Watch a video demo](https://www.loom.com/share/c6ed484899324de991ef7147fd73785d).
- [Personal workspace templates](/guides/track/workspaces/#workspace-templates) allow you to save core line plot settings and automatically reapply them in new views. These settings include x-axis key, smoothing algorithm, smoothing factor, max number of lines, whether to use the run selector’s grouping, and which aggregation to apply.
### Weave
- [Saved views](https://weave-docs.wandb.ai/guides/tools/saved-views/) simplify team collaboration and allow you to persist filter and column settings.
- PDFs and generic files are now supported.
- The new [`EvaluationLogger` API](https://weave-docs.wandb.ai/guides/evaluation/evaluation_logger) provides flexible imperative-style evaluation logging.
- You can now import [human annotations](https://weave-docs.wandb.ai/guides/tracking/feedback#add-human-annotations) into Weave datasets
- [Playground](https://weave-docs.wandb.ai/guides/tools/playground/) now supports saved configurations and prompts.
- Decorators are now supported in TypeScript.
- Added support for [tracing generator functions](https://weave-docs.wandb.ai/guides/tracking/tracing#trace-sync--async-generator-functions).
- The new [`dataset.add_rows`](https://weave-docs.wandb.ai/reference/python-sdk/weave/#method-add_rows) helper improves the efficiency of appending to an existing dataset.
- To help you understand your usage, trace and object sizes are now shown through the UI.
## Performance
- With [`wandb` SDK](/quickstart/#install-the-wandb-library-and-log-in) v0.19.11, artifacts now download 3-5x faster on average. For example, an artifact that previously downloaded at around 100 MB/sec may now download at 450 MB/sec or faster. Actual download speeds vary based on factors such as your network and storage infrastructure.
- Improved caching on [Project](/guides/track/project-page/) and [User Settings](/guides/models/app/settings-page/user-settings/) pages.
## Fixes
- Improved the startup process for the `weave-cache-clear` container to ensure compatibility with Python virtual environments.
- Added options for denser display of console logs.
- Workspace loading screens are now more informative.
- When adding a panel from a workspace to a report, the current project’s reports are now shown first in the destination report list.
- Fixed many cases where y-axes would over-round to a degree that caused duplicate values to display.
- Fixed confusing behavior when entering invalid smoothing parameters.
- Removed the **Partial Media** warning from media panels. This does not change the behavior of the media panels.
- When adding a [run filter based on tags](/guides/runs/filter-runs/#filter-runs-with-tags), the filter is now selected by default, as when filtering by other fields.
- Removed the green bell icon that could appear on active runs in the run selector.
- Removed the System page for individual runs.
- The project description field now respects new lines.
- Fixed URLs for legacy model registry collections.
- Fixed a bug where the Netron viewer did not expand to fill all available space on the page.
- When you click **Delete** on a project, the project name now displays in the confirmation modal.
# 0.68.x
> April 29, 2025
W&B Server v0.68 includes enhancements to various types of panels and visualizations, security improvements for Registry, Weave, and service accounts, performance improvements when forking and rewinding runs, and more.
The latest patch is **v0.68.2**. Refer to [Patches]({{< relref "#patches" >}}).
{{% alert %}}
v0.68.0 introduced a bug, fixed in [v0.68.1]({{< relref "#0_68_1" >}}), that could prevent media from loading in media panels. To avoid this bug, install or upgrade to a patch that contains the fix. If you need assistance, contact [support](mailto:support@wandb.com).
{{% /alert %}}
## Features
- Release notes for W&B Server are now published [in the W&B documentation](/ref/release-notes/) in addition to on GitHub. [Subscribe using RSS]({/ref/release-notes/index.xml).
- Registry admins can define and assign [*protected aliases*]({{< relref "/guides/core/registry/model_registry/access_controls.md#add-protected-aliases" >}}) to represent key stages of your development pipeline. A protected alias can be assigned only by a registry admin. W&B blocks other users from adding or removing protected aliases from versions in a registry using the API or UI.
- You can now filter console logs based on a run's `x_label` value. During [distributed training]({{< relref "/guides/models/track/log/distributed-training.md#track-all-processes-to-a-single-run" >}}), this optional parameter tracks the node that logged the run.
- You can now move runs between `Groups`, one by one or in bulk. Also, you can now create new `Groups` after the initial logging time.
- Line plots now support **synchronized zooming** mode, where zooming to a given range on one plot automatically zooms into the same range on all other line plots with a common x-axis. Turn this on in the [workspace display settings for line plots]({{< relref "/guides/models/app/features/panels/line-plot/#all-line-plots-in-a-workspace" >}}).
- Line plots now support formatting custom metrics as timestamps. This is useful when synchronizing or uploading runs from a different system.
- You can now slide through [media panels]({{< relref "/guides/models/app/features/panels/media.md" >}}) using non-`_step` fields such as `epoch` or `train/global_step` (or anything else).
- In Tables and plots in [Query Panels]({{< relref "/guides/models/app/features/panels/query-panels/" >}}) that use `runs` or `runs.history` expressions, a step slider allows you to step through the progress on your metrics, text, or media through the course of your runs. The slider supports stepping through non-`_step` metrics.
- You can now customize [bar chart]({{< relref "/guides/models/app/features/panels/bar-plot.md" >}}) labels using a font size control.
### Private preview
Private preview features are available by invitation only. To request enrollment in a private preview, contact [support]({{< relref "mailto:support@wandb.com" >}}) or your AISE.
- **Personal workspace templates** allow you to save your workspace setup so it is automatically applied to your new [projects]({{< relref "/guides/models/track/project-page.md" >}}). Initially, you can configure certain line plot settings such as the default X axis metric, smoothing algorithm, and smoothing factor.
- **Improved Exponentially-weighted Moving Average (EMA) smoothing** provides more reliable [smoothed lines]({{< relref "/guides/models/app/features/panels/line-plot/smoothing.md" >}}) when operating on complete, unbinned data. In most cases, smoothing is handled at the back end for improved performance.
### Weave
- Chat with fine-tuned models from within your W&B instance. [Playground](https://weave-docs.wandb.ai/guides/tools/playground/) is now supported in Dedicated Cloud. Playground is a chat interface for comparing different LLMs on historical traces. Admins can add API keys to different model providers or hook up [custom hosted LLM providers](https://weave-docs.wandb.ai/guides/tools/playground/#add-a-custom-provider) so your team can interact with them from within Weave.
- Open Telemetry Support. Now you can log traces via OpenTelemetry (OTel). [Learn more](https://weave-docs.wandb.ai/guides/tracking/otel/?utm_source=beamer&utm_medium=sidebar&utm_campaign=OpenTelemetry-support-in-Weave&utm_content=ctalink).
- Weave [tracing](https://weave-docs.wandb.ai/guides/tracking/) has new framework integrations: CrewAI, OpenAI’s Agent SDK, DSPy 2.x and Google's genai Python SDK.
- Playground supports new [OpenAI models](https://weave-docs.wandb.ai/guides/tools/playground/#openai): GPT‑4.1, GPT‑4.1 mini, and GPT‑4.1 nano.
- Build labeled datasets directly from traces, with your annotations automatically converted into dataset columns. [Learn more](https://weave-docs.wandb.ai/guides/core-types/datasets/#create-edit-and-delete-a-dataset-in-the-ui).
## Security
- Registry admins can now designate a [service account]({{< relref "/guides/hosting/iam/authentication/service-accounts.md" >}}) in a registry as either a Registry Admin or a Member. Previously, the service account’s role was always Registry Admin. [Learn more]({{< relref "/guides/core/registry/configure_registry.md" >}}).
## Performance
- Improved the performance of many workspace interactions, particularly in large workspaces. For example, expanding sections and using the run selector are significantly more responsive.
- Improved Fork and Rewind Performance.
[Forking]({{< relref "/guides/models/track/runs/forking.md" >}}) a run creates a new run that uses the same configuration as an existing run. Changes to the forked run do not the parent run, and vice versa. A pointer is maintained between the forked run and the parent. [Rewinding]({{< relref "/guides/models/track/runs/rewind.md" >}}) a run lets you log new data from that point in time without losing the existing data.
In projects with many nested forks, forking new runs is now much more efficient due to improvements in caching.
## Fixes
- Fixed a bug that could prevent an organization service account from being added to new teams.
- Fixed a bug that could cause hover marks to be missing for grouped lines.
- Fixed a bug that could include invalid project names in the **Import** dropdown of a Report panel.
- Fixed a display bug in the alignment of filters in the run selector.
- Fixed a page crash when adding a timestamp **Within Last** filter
- Fixed a bug that could prevent the X-axis from being set to **Wall Time** in global line plot settings.
- Fixed a bug that could prevent image captions from appearing when they are logged to a Table.
- Fixed a bug that could prevent sparse metrics from showing up in panels.
- In **Run Overview** pages, the **Description** field is now named **Notes**.
## Patches
### 0.68.1
**May 2, 2025**
- Fixed a bug introduced in v0.68.0 that could prevent media from loading in media panels.
### 0.68.2
**May 7, 2025**
- Fixed a bug introduced in v0.68.0 that could cause background jobs to crash or run inconsistently. After upgrading to v0.68.2, affected background jobs will recover automatically. If you experience issues with background jobs after upgrading, contact [Support](mailto:support@wandb.com).
- Fixed a long-standing UI bug where typing an invalid regular expression into the W&B App search field could crash the app. Now if you type an invalid regular expression, it is treated as a simple search string, and you can update the search field and try again.
- Fixed a bug where the SMTP port is set to 25 instead of the port specified in `GORILLA_EMAIL_SINK`.
- Fixed a bug where inviting a user to a team could fail with the misleading error `You have no available seats`.
# 0.67.x
> March 28, 2025
## Features
- In Reports, you can now give a run a custom display name per panel grid. This allows you to replace the run’s (often long and opaque) training-time name with one that is more meaningful to your audience. The report updates the name in all panel grids, helping you to explain your hard-won experimental insights to your colleagues in a concise and readable way. The original run name remain intact in the project, so doing this won’t disrupt your collaborators.
- When you expand a panel in the workspace, it now opens in full screen mode with more space. In this view, line plots now render with more granular detail, using up 10,000 bins. The run selector appear next to the panel, letting you easily toggle, group, or filter runs in context.
- From any panel, you can now copy a unique URL that links directly to that panel's full screen view. This makes it even easier to share a link to dig into interesting or pathological patterns in your plots.
- Run Comparer is a powerful tool you can use to compare the configurations and key metrics of important runs alongside their loss curves. Run Comparer has been updated:
- Faster to add a Run Comparer panel, as an expanded option in **Add Panels**.
- By default, a Run Comparer panel takes up more space, so you can see the values right away.
- Improved readability and legibility of a Run Comparer panel. You can use new controls to quickly change row and column sizes so you can read long or nested values.
- You can copy any value in the panel to your clipboard with a single click.
- You can search keys with regular expressions to quickly find exactly the subset of metrics you want to compare across. Your search history is saved to help you iterate efficiently between views.
- Run Comparer is now more reliable at scale, and handles larger workspaces more efficiently, reducing the likelihood of poor performance or a crashed panel.
- Segmentation mask controls have been updated:
- You can now toggle each mask type on or off in bulk, or toggle all masks or all images on or off.
- You can now change each class’s assigned color, helping to avoid confusion if multiple classes use the same color.
- When you open a media panel in full screen mode, you can now use the left or right arrows on your keyboard to step through the images, *without* first clicking on the step slider.
- Media panels now color run names, matching the run selector. This makes it easier to associate a run’s media values with related metrics and plots.
- In the run selector, you can now filter by whether a run has certain media key or not.
- You can now move runs between groups in the W&B App UI, and you can create new groups after the run is logged.
- Automations can now be edited in the UI
- An automation can now notify a Slack channel for artifact events. When creating an automation, select “Slack notification” for the Action type.
- Registry now supports global search by default, allowing you to search across all registries by registry name, collection name, alias, or tag.
- In Tables and Query panels that use the `runs` expression, you can use the new Runs History step slider and drop-down controls to view a table of metrics at each step of a run.
- Playground in Weave supports new models: OpenAI’s `gpt-4.5-preview` and Deepseek’s `deepseek-chat` and `deepseek-reasoner`.
- Weave tracing has two new agent framework integrations: CrewAI and OpenAI’s Agent SDK.
- In the Weave UI, you can now build Datasets from traces. Learn more: https://weave-docs.wandb.ai/guides/core-types/datasets#create-edit-and-delete-a-dataset-in-the-ui
- The Weave Python SDK now provides a way to filter the inputs and outputs of your Weave data to ensure sensitive data does not leave your network perimeter. You can configure to redact sensitive data. Learn more: https://weave-docs.wandb.ai/guides/tracking/redact-pii/
- To streamline your experience, the System tab in the individual run workspace view will be removed in an upcoming release. View full information about system metrics in the System section of the workspace. For questions, contact [support@wandb.com](mailto:support@wandb.com).
## Security
- `golang crypto` has been upgraded to v0.36.0.
- `golang oauth2` has been upgraded to v0.28.0.
- In Weave, `pyarrow` is now pinned to v17.0.0.
## Performance
- Frontend updates significantly reduce workspace reload times by storing essential data in the browser cache across visits. The update optimizes loading of saved views, metric names, the run selector, run counts, W&B’s configuration details, and the recomputation of workspace views.
- Registry overview pages now load significantly faster.
- Improved the performance of selecting metrics for the X, Y, or Z values in a scatter plot in a workspace with thousands of runs or hundreds of metrics.
- Performance improvements to Weave evaluation logging.
## Fixes
- Fixed a bug in Reports where following a link to a section in the report would not open to that section.
- Improved the behavior of how Gaussian smoothing handles index reflection, matching SciPy's default "reflect" mode.
- A Report comment link sent via email now opens directly to the comment.
- Fixed a bug that could crash a workspace if a sweep takes longer than 2 billion compute seconds by changing the variable type for sweep compute seconds to `int64` rather than `int32`.
- Fixed display bugs that could occur when a report included multiple run sets.
- Fixed a bug where panels Quick Added to an alphabetically sorted section were sorted incorrectly.
- Fixed a bug that generated malformed user invitation links.
# 0.66.x
> March 06, 2025
## Features
- In tables and query panels, columns you derive from other columns now persist, so you can use them for filtering or in query panel plots.
## Security
- Limited the maximum depth for a GraphQL document to 20.
- Upgraded pyarrow to v17.0.0.
# 0.65.x
> January 30, 2025
## Features
- From a registry's **Settings**, you can now update the owner to a different user with the Admin role. Select **Owner** from the user's **Role** menu.
- You can now move a run to a different group in the same project. Hover over a run in the run list, click the three-vertical-dots menu, and choose **Move to another group**.
- You can now configure whether the **Log Scale setting** for line plots is enabled by default at the level of the workspace or section.
- To configure the behavior for a workspace, click the action `...` menu for the workspace, click **Line plots**, then toggle **Log scale** for the X or Y axis.
- To configure the behavior for a section, click the gear icon for the section, then toggle **Log scale** for the X or Y axis.
# 0.63.x
> December 10, 2024
## Features
**[Weave](https://wandb.ai/site/weave/) is now generally available (GA) in Dedicated Cloud on AWS. Reach out to your W&B team if your teams are looking to build Generative AI apps with confidence and putting those in production.**
The release includes the following additional updates:
* W&B Models now seamlessly integrates with **_Azure public cloud_**. You could now create a Dedicated Cloud instance in an Azure region directly from your Azure subscription and manage it as an Azure ISV resource. [This integration is in private preview](https://wandb.ai/site/partners/azure).
* Enable automations at the Registry level to monitor changes and events across all collections in the registry and trigger actions accordingly. This eliminates the need to configure separate webhooks and automations for individual collections.
* Ability to assign x_label, e.g. node-0, in run settings object to distinguish logs and metrics by label, e.g. node, in distributed runs. Enables grouping system metrics and console logs by label for visualization in the workspace.
* **_Coming soon_** with a patch release this week, you will be able to use organization-level service accounts to automate your W&B workloads across all teams in your instance. You would still be able to use existing team-level service accounts if you would like more control over the access scope of a service account.
* Allow org-level service accounts to interact with Registry. Such service accounts can be invited to a registry using the invite modal and are displayed in the members table along with respective organization roles.
## Fixes
* Fixed an issue where users creating custom roles including the `Create Artifact` permission were not able to log artifacts to a project.
* Fixed the issue with metadata logging for files in instances that have subpath support configured for BYOB.
* Block webhook deletion if used by organization registry automations.
# 0.61.0
> October 17, 2024
## Features
**This is a mini-feature and patch release, delivered at a different schedule than the monthly W&B server major releases**
* Organization admins can now configure Models seats and access control for both Models & [Weave](https://weave-docs.wandb.ai/) in a seamless manner from their organization dashboard. This change allows for a efficient user management when [Weave](https://weave-docs.wandb.ai/) is enabled for a Dedicated Cloud or Self-managed instance.
* [Weave](https://weave-docs.wandb.ai/) pricing is consumption-based rather than based on number of seats used. Seat management only applies to the Models product.
* You can now configure [access roles at the project level for team and restricted scoped projects](https://docs.wandb.ai/guides/hosting/iam/access-management/restricted-projects/). It allows assigning different access roles to a user within different projects in the same team, and thus adding another strong control to conform to enterprise governance needs.
## Fixes
* Fixed an issue where underlying database schema changes as part of release upgrades could timeout during platform startup time.
* Added more performance improvements to the underlying parquet store service, to further improve the chart loading times for users. Parquet store service is only available on Dedicated Cloud, and Self-managed instances based on [W&B kubernetes operator](https://docs.wandb.ai/guides/hosting/operator).
* Addressed the high CPU utilization issue for the underlying parquet store service, to make the efficient chart loading more reliable for users. Parquet store service is only available on Dedicated Cloud, and Self-managed instances based on [W&B kubernetes operator](https://docs.wandb.ai/guides/hosting/operator).
# 0.60.0
> September 26, 2024
## Features
* Final updates for 1.1.1 Compliance of Level AA 2.2 for Web Content Accessibility Guidelines (WCAG) standards.
* W&B can now disable auto-version-upgrade for customer-managed instances using the W&B kubernetes operator. You can request this to your W&B team.
* Note that W&B requires all instances to upgrade periodically to comply with the 6-month end-of-life period for each version. W&B does not support versions older than 6 months.
{{% alert %}}
Due to a release versioning issue, 0.60.0 is the next major release after 0.58.0. The 0.59.0 was one of the patch releases for 0.58.0.
{{% /alert %}}
## Fixes
* Fixed a bug to allow instance admins on Dedicated Cloud and Customer-managed instances to access workspaces in personal entities.
* SCIM Groups and Users GET endpoints now filter out service accounts from the responses. Only non service account users are now returned by those endpoints.
* Fixed a user management bug by removing the ability of team admins to simultaneously delete a user from the overall instance while deleting them from a team. Instance or Org admins are responsible to delete a user from the overall instance / organization.
## Performance improvements
* Reduced the latency when adding a panel by up to 90% in workspaces with many metrics.
* Improved the reliability and performance of parquet exports to blob storage when runs are resumed often.
* Runs export to blob storage in parquet format is available on Dedicated Cloud and on Customer-managed instances that are enabled using the W&B kubernetes operator.
# 0.58.1
> September 04, 2024
## Features
* W&B now supports sub-path for **Secure storage connector i.e. Bring your own bucket** capability. You can now provide a sub-path when configuring a bucket at the instance or team level. This is only available for new bucket configurations and not for existing configured buckets.
* W&B-managed storage on newer Dedicated Cloud instances in GCP & Azure will by default be encrypted with **W&B managed cloud-native keys**. This is already available on AWS instances. Each instance storage is encrypted with a key unique to the instance. Until now, all instances on GCP & Azure relied on default cloud provider-managed encryption keys.
* Makes the fields in the run config and summary copyable on click.
* If you're using W&B kubernetes operator for a customer-managed instance, you can now optionally use a custom CA for the controller manager.
* We've modified the W&B kubernetes operator to run in a non-root context by default, aligning with OpenShift's Security Context Constraints (SCCs). This change ensures smoother deployment of customer-managed instances on OpenShift by adhering to its security policies.
## Fixes
* Fixed an issue where exporting panels from a workspace to a report now correctly respects the panel search regex.
* Fixed an issue where setting `GORILLA_DISABLE_PERSONAL_ENTITY` to `true` was not disabling users from creating projects and writing to existing projects in their personal entities.
## Performance improvements
* We have significantly improved performance and stability for experiments with 100k+ logged points. If you've a customer-managed instance, this is available if the deployment is managed using the W&B kubernetes operator.
* Fixed issue where saving changes in large workspaces would be very slow or fail.
* Improved latency of opening workspace sections in large workspaces.
# 0.57.2
> July 24, 2024
## Features
**You can now use JWTs (JSON Web Tokens) to access your W&B instance from the wandb SDK or CLI, using the identity federation capability. The feature is in preview.** Refer to [Identity federation](https://docs.wandb.ai/guides/hosting/iam/identity_federation) and reach out to your W&B team for any questions.
The 0.57.2 release also includes these capabilities:
* New `Add to reports` drawer improvements for exporting Workspace panels into Reports.
* Artifacts metadata filtering in the artifact project browser.
* Pass in artifact metadata in webhook payload via `${artifact_metadata.KEY}`.
* Added GPU memory usage panels to the RunSystemMetrics component, enhancing GPU metrics visualization for runs in the app frontend.
* Mobile users now enjoy a much smoother, more intuitive Workspace experience.
* If you're using W&B Dedicated Cloud on GCP or Azure, you can now enable private connectivity for your instance, thus ensuring that all traffic from your AI workloads and optionally browser clients only transit the cloud provider private network. Refer to [Private connectivity](https://docs.wandb.ai/guides/hosting/data-security/private-connectivity) and reach out to your W&B team for any questions.
* Team-level service accounts are now shown separately in a new tab in the team settings view. The service accounts are not listed in the Members tab anymore. Also, the API key is now hidden and can only be copied by team admins.
* Dedicated Cloud is now available in GCP's Seoul region.
## Fixes
* Gaussian smoothing was extremely aggressive on many plots.
* Fixed issue where pressing the `Ignore Outliers in Chart Scaling` button currently has no effect in the UI workspace.
* Disallow inviting deactivated users to an organization.
* Fixed an issue where users added to an instance using SCIM API could not onbioard successfully.
## Performance improvements
* Significantly improved performance when editing a panel's settings and applying the changes.
* Improved the responsiveness of run visibility toggling in large workspaces.
* Improved chart hovering and brushing performance on plots in large workspaces.
* Reduced workspace memory usage and loading times in workspaces with many keys.
# 0.56.0
> June 29, 2024
## Features
**The new Full Fidelity line plot in W&B Experiments enhances the visibility of training metrics by aggregating all data along the x-axis, displaying the minimum, maximum, and average values within each bucket, allowing users to easily spot outliers and zoom into high-fidelity details without downsampling loss.** [Learn more in our documentation](https://docs.wandb.ai/guides/app/features/panels/line-plot/sampling).
{{% alert %}}
Due to a release versioning issue, 0.56.0 is the next major release after 0.54.0. The 0.55.0 was a patch release for 0.54.0.
{{% /alert %}}
The 0.56.0 release also includes these capabilities:
* You can now use [cross-cloud storage buckets for team-level BYOB (secure storage connector)](https://docs.wandb.ai/guides/hosting/data-security/secure-storage-connector#cross-cloud-or-s3-compatible-storage-for-team-level-byob) in Dedicated Cloud and Self-managed instances. For example, in a W&B instance on AWS, you can now configure Azure Blob Storage or Google Cloud Storage for team-level BYOB, and so on for each cross-cloud combination.
* In the same vein, you can now use [S3-compatible storage buckets like MinIO for team-level BYOB (secure storage connector)](https://docs.wandb.ai/guides/hosting/data-security/secure-storage-connector#cross-cloud-or-s3-compatible-storage-for-team-level-byob) in Dedicated Cloud and Self-managed instances. For example, in a W&B instance on GCP, you can configure a MinIO bucket hosted in cloud or on-prem for team-level BYOB.
* Admins can now automate full deletion of users in their Dedicated Cloud or Self-managed instances using the [SCIM API's DELETE User endpoint](https://docs.wandb.ai/guides/hosting/iam/scim#delete-user). The user deactivation operation has been reimplemented using the [PATCH User endpoint](https://docs.wandb.ai/guides/hosting/iam/scim#deactivate-user), along with the introduction of [user reactivation operation](https://docs.wandb.ai/guides/hosting/iam/scim#reactivate-user).
* If you use the SCIM API, you will also see a couple of minor improvements:
* The API now has a more pertinent error message in case of authentication failures.
* Relevant endpoints now return the full name of a user in the SCIM User object if it's available.
## Fixes
* The fix resolves an issue where deleting a search term from a runset in a report could delete the panel or cause the report to crash by ensuring proper handling of selected text during copy/paste operations.
* The fix addresses a problem with indenting bulleted items in reports, which was caused by an upgrade of slate and an additional check in the normalization process for elements.
* The fix resolves an issue where text could not be selected from a panel when the report was in edit mode.
* The fix addresses an issue where copy-pasting an entire panel grid in a Report using command-c was broken.
* The fix resolves an issue where report sharing with a magic link was broken when a team had the `Hide this team from all non-members` setting enabled.
* The fix introduces proper handling for restricted projects by allowing only explicitly invited users to access them, and implementing permissions based on project members and team roles.
* The fix allows instance admins to write to their own named workspaces, read other personal and shared workspaces, and write to shared views in private and public projects.
* The fix resolves an issue where the report would crash when trying to edit filters due to an out-of-bounds filter index caused by skipping non-individual filters while keeping the index count incremental.
* The fix addresses an issue where unselecting a runset caused media panels to crash in a report by ensuring only runs in enabled runsets are returned.
* The fix resolves an issue where the parameter importance panel crashes on initial load due to a violation of hooks error caused by a change in the order of hooks.
* The fix prevents chart data from being reloaded when scrolling down and then back up in small workspaces, enhancing performance and eliminating the feeling of slowness.
# Archived Releases
Archived releases have reached end of life and are no longer supported. A major release and its patches are supported for 12 months from the initial release date. Release notes for archived releases are provided for historical purposes. For supported releases, refer to [Releases](/ref/release-notes/).
{{% alert color="warning" %}}
Customers using [Self-managed](/guides/hosting/hosting-options/self-managed/) are responsible to upgrade to a [supported release](/ref/releases-notes/) in time to maintain support. For assistance or questions, contact [support](mailto:support@wandb.com).
{{% /alert %}}
# Release policies and processes
> Release process for W&B Server
This page gives details about W&B Server releases and W&B's release policies. This page relates to [W&B Dedicated Cloud]({{< relref "/guides/hosting/hosting-options/dedicated_cloud/" >}}) and [Self-Managed]({{< relref "/guides/hosting/hosting-options/self-managed/" >}}) deployments. To learn more about an individual W&B Server release, refer to [W&B release notes]({{< relref "/ref/release-notes/" >}}).
W&B fully manages [W&B Multi-tenant Cloud]({{< relref "/guides/hosting/hosting-options/saas_cloud.md" >}}) and the details in this page do not apply.
## Release support and end of life policy
W&B supports a major W&B Server release for 12 months from its initial release date.
- **Dedicated Cloud** instances are automatically updated to maintain support.
- Customers with **Self-managed** instances are responsible for upgrading in time to maintain support. Avoid staying on an unsupported version.
{{% alert %}}
W&B strongly recommends customers with **Self-managed** instances to update their deployments with the latest release at minimum once per quarter to maintain support and receive the latest features, performance improvements, and fixes.
{{% /alert %}}
## Release types and frequencies
- **Major releases** are produced monthly, and may include new features, enhancements, performance improvements, medium and low severity bug fixes, and deprecations. An example of a major release is `0.68.0`.
- **Patch releases** within a major version are produced as needed, and include critical and high severity bug fixes. An example of a patch release is `0.67.1`.
## Release rollout
1. After testing and validation are complete, a release is first rolled out to all **Dedicated Cloud** instances to keep them fully updated.
1. After additional observation, the release is published, and **Self-managed** deployments can upgrade to it on their own schedule, and are responsible for upgrading in time to comply with the [Release support and End of Life (EOL) policy]({{< relref "#release-support-and-end-of-life-policy" >}}). Learn more about [upgrading W&B Server]({{< relref "/guides/hosting/hosting-options/self-managed/server-upgrade-process.md" >}}).
## Downtime during upgrades
- When a **Dedicated Cloud** instance is upgraded, downtime is generally not expected, but may occur in certain situations:
- If a new feature or enhancement requires changes to the underlying infrastructure, such as compute, storage or network.
- To roll out a critical infrastructure change such as a security fix.
- If the instance's current version has reached its [End of Life (EOL)]({{< relref "/guides/hosting/hosting-options/self-managed/server-upgrade-process.md" >}}) and is upgraded by W&B to maintain support.
- For **Self-managed** deployments, the customer is responsible for implementing a rolling update process that meets their service level objectives (SLOs), such as by [running W&B Server on Kubernetes]({{< relref "/guides/hosting/hosting-options/self-managed/kubernetes-operator/" >}}).
## Feature availability
After installing or upgrading, certain features may not be immediately available.
### Enterprise features
An Enterprise license includes support for important security capabilities and other enterprise-friendly functionality. Some advanced features require an Enterprise license.
- **Dedicated Cloud** includes an Enterprise license and no action is required.
- On **Self-managed** deployments, features that require an Enterprise license are not available until it is set. To learn more or obtain an Enterprise license, refer to [Obtain your W&B Server license]({{< relref "/guides/hosting/hosting-options/self-managed.md#obtain-your-wb-server-license" >}}).
### Private preview and opt-in features
Most features are available immediately after installing or upgrading W&B Server. The W&B team must enable certain features before you can use them in your instance.
{{% alert color="warning" %}}
Any feature in a preview phase is subject to change. A preview feature is not guaranteed to become generally available.
{{% /alert %}}
- **Private preview**: W&B invites design partners and early adopters to test these features and provide feedback. Private preview features are not recommended for production environments.
The W&B team must enable a private preview feature for your instance before you can use it. Public documentation is not available; instructions are provided directly. Interfaces and APIs may change, and the feature may not be fully implemented.
- **Public preview**: Contact W&B to opt in to a public preview to try it out before it is generally available.
The W&B team must enable a public preview feature before you can use it in your instance. Documentation may not be complete, interfaces and APIs may change, and the feature may not be fully implemented.
To learn more about an individual W&B Server release, including any limitations, refer to [W&B Release notes]({{< relref "/ref/release-notes/" >}}).
# Command Line Interface
**Usage**
`wandb [OPTIONS] COMMAND [ARGS]...`
**Options**
| **Option** | **Description** |
| :--- | :--- |
| `--version` | Show the version and exit. |
**Commands**
| **Command** | **Description** |
| :--- | :--- |
| agent | Run the W&B agent |
| artifact | Commands for interacting with artifacts |
| beta | Beta versions of wandb CLI commands. |
| controller | Run the W&B local sweep controller |
| disabled | Disable W&B. |
| docker | Run your code in a docker container. |
| docker-run | Wrap `docker run` and adds WANDB_API_KEY and WANDB_DOCKER... |
| enabled | Enable W&B. |
| init | Configure a directory with Weights & Biases |
| job | Commands for managing and viewing W&B jobs |
| launch | Launch or queue a W&B Job. |
| launch-agent | Run a W&B launch agent. |
| launch-sweep | Run a W&B launch sweep (Experimental). |
| login | Login to Weights & Biases |
| offline | Disable W&B sync |
| online | Enable W&B sync |
| pull | Pull files from Weights & Biases |
| restore | Restore code, config and docker state for a run |
| scheduler | Run a W&B launch sweep scheduler (Experimental) |
| server | Commands for operating a local W&B server |
| status | Show configuration settings |
| sweep | Initialize a hyperparameter sweep. |
| sync | Upload an offline training directory to W&B |
| verify | Verify your local instance |
# wandb agent
**Usage**
`wandb agent [OPTIONS] SWEEP_ID`
**Summary**
Run the W&B agent
**Options**
| **Option** | **Description** |
| :--- | :--- |
| `-p, --project` | The name of the project where W&B runs created from the sweep are sent to. If the project is not specified, the run is sent to a project labeled 'Uncategorized'. |
| `-e, --entity` | The username or team name where you want to send W&B runs created by the sweep to. Ensure that the entity you specify already exists. If you don't specify an entity, the run will be sent to your default entity, which is usually your username. |
| `--count` | The max number of runs for this agent. |
# wandb artifact
**Usage**
`wandb artifact [OPTIONS] COMMAND [ARGS]...`
**Summary**
Commands for interacting with artifacts
**Options**
| **Option** | **Description** |
| :--- | :--- |
**Commands**
| **Command** | **Description** |
| :--- | :--- |
| cache | Commands for interacting with the artifact cache |
| get | Download an artifact from wandb |
| ls | List all artifacts in a wandb project |
| put | Upload an artifact to wandb |
# wandb beta
**Usage**
`wandb beta [OPTIONS] COMMAND [ARGS]...`
**Summary**
Beta versions of wandb CLI commands. Requires wandb-core.
**Options**
| **Option** | **Description** |
| :--- | :--- |
**Commands**
| **Command** | **Description** |
| :--- | :--- |
| sync | Upload a training run to W&B |
# wandb controller
**Usage**
`wandb controller [OPTIONS] SWEEP_ID`
**Summary**
Run the W&B local sweep controller
**Options**
| **Option** | **Description** |
| :--- | :--- |
| `--verbose` | Display verbose output |
# wandb disabled
**Usage**
`wandb disabled [OPTIONS]`
**Summary**
Disable W&B.
**Options**
| **Option** | **Description** |
| :--- | :--- |
| `--service` | Disable W&B service [default: True] |
# wandb docker
**Usage**
`wandb docker [OPTIONS] [DOCKER_RUN_ARGS]... [DOCKER_IMAGE]`
**Summary**
Run your code in a docker container.
W&B docker lets you run your code in a docker image ensuring wandb is
configured. It adds the WANDB_DOCKER and WANDB_API_KEY environment variables
to your container and mounts the current directory in /app by default. You
can pass additional args which will be added to `docker run` before the
image name is declared, we'll choose a default image for you if one isn't
passed:
```sh wandb docker -v /mnt/dataset:/app/data wandb docker gcr.io/kubeflow-
images-public/tensorflow-1.12.0-notebook-cpu:v0.4.0 --jupyter wandb docker
wandb/deepo:keras-gpu --no-tty --cmd "python train.py --epochs=5" ```
By default, we override the entrypoint to check for the existence of wandb
and install it if not present. If you pass the --jupyter flag we will
ensure jupyter is installed and start jupyter lab on port 8888. If we
detect nvidia-docker on your system we will use the nvidia runtime. If you
just want wandb to set environment variable to an existing docker run
command, see the wandb docker-run command.
**Options**
| **Option** | **Description** |
| :--- | :--- |
| `--nvidia / --no-nvidia` | Use the nvidia runtime, defaults to nvidia if nvidia-docker is present |
| `--digest` | Output the image digest and exit |
| `--jupyter / --no-jupyter` | Run jupyter lab in the container |
| `--dir` | Which directory to mount the code in the container |
| `--no-dir` | Don't mount the current directory |
| `--shell` | The shell to start the container with |
| `--port` | The host port to bind jupyter on |
| `--cmd` | The command to run in the container |
| `--no-tty` | Run the command without a tty |
# wandb docker-run
**Usage**
`wandb docker-run [OPTIONS] [DOCKER_RUN_ARGS]...`
**Summary**
Wrap `docker run` and adds WANDB_API_KEY and WANDB_DOCKER environment
variables.
This will also set the runtime to nvidia if the nvidia-docker executable is
present on the system and --runtime wasn't set.
See `docker run --help` for more details.
**Options**
| **Option** | **Description** |
| :--- | :--- |
# wandb enabled
**Usage**
`wandb enabled [OPTIONS]`
**Summary**
Enable W&B.
**Options**
| **Option** | **Description** |
| :--- | :--- |
| `--service` | Enable W&B service [default: True] |
# wandb init
**Usage**
`wandb init [OPTIONS]`
**Summary**
Configure a directory with Weights & Biases
**Options**
| **Option** | **Description** |
| :--- | :--- |
| `-p, --project` | The project to use. |
| `-e, --entity` | The entity to scope the project to. |
| `--reset` | Reset settings |
| `-m, --mode` | Can be "online", "offline" or "disabled". Defaults to online. |
# wandb job
**Usage**
`wandb job [OPTIONS] COMMAND [ARGS]...`
**Summary**
Commands for managing and viewing W&B jobs
**Options**
| **Option** | **Description** |
| :--- | :--- |
**Commands**
| **Command** | **Description** |
| :--- | :--- |
| create | Create a job from a source, without a wandb run. |
| describe | Describe a launch job. |
| list | List jobs in a project |
# wandb launch
**Usage**
`wandb launch [OPTIONS]`
**Summary**
Launch or queue a W&B Job. See https://wandb.me/launch
**Options**
| **Option** | **Description** |
| :--- | :--- |
| `-u, --uri (str)` | Local path or git repo uri to launch. If provided this command will create a job from the specified uri. |
| `-j, --job (str)` | Name of the job to launch. If passed in, launch does not require a uri. |
| `--entry-point` | Entry point within project. [default: main]. If the entry point is not found, attempts to run the project file with the specified name as a script, using 'python' to run .py files and the default shell (specified by environment variable $SHELL) to run .sh files. If passed in, will override the entrypoint value passed in using a config file. |
| `--build-context (str)` | Path to the build context within the source code. Defaults to the root of the source code. Compatible only with -u. |
| `--name` | Name of the run under which to launch the run. If not specified, a random run name will be used to launch run. If passed in, will override the name passed in using a config file. |
| `-e, --entity (str)` | Name of the target entity which the new run will be sent to. Defaults to using the entity set by local wandb/settings folder. If passed in, will override the entity value passed in using a config file. |
| `-p, --project (str)` | Name of the target project which the new run will be sent to. Defaults to using the project name given by the source uri or for github runs, the git repo name. If passed in, will override the project value passed in using a config file. |
| `-r, --resource` | Execution resource to use for run. Supported values: 'local-process', 'local-container', 'kubernetes', 'sagemaker', 'gcp-vertex'. This is now a required parameter if pushing to a queue with no resource configuration. If passed in, will override the resource value passed in using a config file. |
| `-d, --docker-image` | Specific docker image you'd like to use. In the form name:tag. If passed in, will override the docker image value passed in using a config file. |
| `--base-image` | Docker image to run job code in. Incompatible with --docker-image. |
| `-c, --config` | Path to JSON file (must end in '.json') or JSON string which will be passed as a launch config. Dictation how the launched run will be configured. |
| `-v, --set-var` | Set template variable values for queues with allow listing enabled, as key-value pairs e.g. `--set-var key1=value1 --set-var key2=value2` |
| `-q, --queue` | Name of run queue to push to. If none, launches single run directly. If supplied without an argument (`--queue`), defaults to queue 'default'. Else, if name supplied, specified run queue must exist under the project and entity supplied. |
| `--async` | Flag to run the job asynchronously. Defaults to false, i.e. unless --async is set, wandb launch will wait for the job to finish. This option is incompatible with --queue; asynchronous options when running with an agent should be set on wandb launch-agent. |
| `--resource-args` | Path to JSON file (must end in '.json') or JSON string which will be passed as resource args to the compute resource. The exact content which should be provided is different for each execution backend. See documentation for layout of this file. |
| `--dockerfile` | Path to the Dockerfile used to build the job, relative to the job's root |
| `--priority [critical|high|medium|low]` | When --queue is passed, set the priority of the job. Launch jobs with higher priority are served first. The order, from highest to lowest priority, is: critical, high, medium, low |
# wandb launch-agent
**Usage**
`wandb launch-agent [OPTIONS]`
**Summary**
Run a W&B launch agent.
**Options**
| **Option** | **Description** |
| :--- | :--- |
| `-q, --queue` | The name of a queue for the agent to watch. Multiple -q flags supported. |
| `-e, --entity` | The entity to use. Defaults to current logged-in user |
| `-l, --log-file` | Destination for internal agent logs. Use - for stdout. By default all agents logs will go to debug.log in your wandb/ subdirectory or WANDB_DIR if set. |
| `-j, --max-jobs` | The maximum number of launch jobs this agent can run in parallel. Defaults to 1. Set to -1 for no upper limit |
| `-c, --config` | path to the agent config yaml to use |
| `-v, --verbose` | Display verbose output |
# wandb launch-sweep
**Usage**
`wandb launch-sweep [OPTIONS] [CONFIG]`
**Summary**
Run a W&B launch sweep (Experimental).
**Options**
| **Option** | **Description** |
| :--- | :--- |
| `-q, --queue` | The name of a queue to push the sweep to |
| `-p, --project` | Name of the project which the agent will watch. If passed in, will override the project value passed in using a config file |
| `-e, --entity` | The entity to use. Defaults to current logged-in user |
| `-r, --resume_id` | Resume a launch sweep by passing an 8-char sweep id. Queue required |
| `--prior_run` | ID of an existing run to add to this sweep |
# wandb login
**Usage**
`wandb login [OPTIONS] [KEY]...`
**Summary**
Login to Weights & Biases
**Options**
| **Option** | **Description** |
| :--- | :--- |
| `--cloud` | Login to the cloud instead of local |
| `--host, --base-url` | Login to a specific instance of W&B |
| `--relogin` | Force relogin if already logged in. |
| `--anonymously` | Log in anonymously |
| `--verify / --no-verify` | Verify login credentials |
# wandb offline
**Usage**
`wandb offline [OPTIONS]`
**Summary**
Disable W&B sync
**Options**
| **Option** | **Description** |
| :--- | :--- |
# wandb online
**Usage**
`wandb online [OPTIONS]`
**Summary**
Enable W&B sync
**Options**
| **Option** | **Description** |
| :--- | :--- |
# wandb pull
**Usage**
`wandb pull [OPTIONS] RUN`
**Summary**
Pull files from Weights & Biases
**Options**
| **Option** | **Description** |
| :--- | :--- |
| `-p, --project` | The project you want to download. |
| `-e, --entity` | The entity to scope the listing to. |
# wandb restore
**Usage**
`wandb restore [OPTIONS] RUN`
**Summary**
Restore code, config and docker state for a run
**Options**
| **Option** | **Description** |
| :--- | :--- |
| `--no-git` | Don't restore git state |
| `--branch / --no-branch` | Whether to create a branch or checkout detached |
| `-p, --project` | The project you wish to upload to. |
| `-e, --entity` | The entity to scope the listing to. |
# wandb scheduler
**Usage**
`wandb scheduler [OPTIONS] SWEEP_ID`
**Summary**
Run a W&B launch sweep scheduler (Experimental)
**Options**
| **Option** | **Description** |
| :--- | :--- |
# wandb server
**Usage**
`wandb server [OPTIONS] COMMAND [ARGS]...`
**Summary**
Commands for operating a local W&B server
**Options**
| **Option** | **Description** |
| :--- | :--- |
**Commands**
| **Command** | **Description** |
| :--- | :--- |
| start | Start a local W&B server |
| stop | Stop a local W&B server |
# wandb status
**Usage**
`wandb status [OPTIONS]`
**Summary**
Show configuration settings
**Options**
| **Option** | **Description** |
| :--- | :--- |
| `--settings / --no-settings` | Show the current settings |
# wandb sweep
**Usage**
`wandb sweep [OPTIONS] CONFIG_YAML_OR_SWEEP_ID`
**Summary**
Initialize a hyperparameter sweep. Search for hyperparameters that optimizes
a cost function of a machine learning model by testing various combinations.
**Options**
| **Option** | **Description** |
| :--- | :--- |
| `-p, --project` | The name of the project where W&B runs created from the sweep are sent to. If the project is not specified, the run is sent to a project labeled Uncategorized. |
| `-e, --entity` | The username or team name where you want to send W&B runs created by the sweep to. Ensure that the entity you specify already exists. If you don't specify an entity, the run will be sent to your default entity, which is usually your username. |
| `--controller` | Run local controller |
| `--verbose` | Display verbose output |
| `--name` | The name of the sweep. The sweep ID is used if no name is specified. |
| `--program` | Set sweep program |
| `--update` | Update pending sweep |
| `--stop` | Finish a sweep to stop running new runs and let currently running runs finish. |
| `--cancel` | Cancel a sweep to kill all running runs and stop running new runs. |
| `--pause` | Pause a sweep to temporarily stop running new runs. |
| `--resume` | Resume a sweep to continue running new runs. |
| `--prior_run` | ID of an existing run to add to this sweep |
# wandb sync
**Usage**
`wandb sync [OPTIONS] [PATH]...`
**Summary**
Upload an offline training directory to W&B
**Options**
| **Option** | **Description** |
| :--- | :--- |
| `--id` | The run you want to upload to. |
| `-p, --project` | The project you want to upload to. |
| `-e, --entity` | The entity to scope to. |
| `--job_type` | Specifies the type of run for grouping related runs together. |
| `--sync-tensorboard / --no-sync-tensorboard` | Stream tfevent files to wandb. |
| `--include-globs` | Comma separated list of globs to include. |
| `--exclude-globs` | Comma separated list of globs to exclude. |
| `--include-online / --no-include-online` | Include online runs |
| `--include-offline / --no-include-offline` | Include offline runs |
| `--include-synced / --no-include-synced` | Include synced runs |
| `--mark-synced / --no-mark-synced` | Mark runs as synced |
| `--sync-all` | Sync all runs |
| `--clean` | Delete synced runs |
| `--clean-old-hours` | Delete runs created before this many hours. To be used alongside --clean flag. |
| `--clean-force` | Clean without confirmation prompt. |
| `--show` | Number of runs to show |
| `--append` | Append run |
| `--skip-console` | Skip console logs |
# wandb verify
**Usage**
`wandb verify [OPTIONS]`
**Summary**
Verify your local instance
**Options**
| **Option** | **Description** |
| :--- | :--- |
| `--host` | Test a specific instance of W&B |
# JavaScript Library
> The W&B SDK for TypeScript, Node, and modern Web Browsers
Similar to our Python library, we offer a client to track experiments in JavaScript/TypeScript.
- Log metrics from your Node server and display them in interactive plots on W&B
- Debug LLM applications with interactive traces
- Debug [LangChain.js](https://github.com/hwchase17/langchainjs) usage
This library is compatible with Node and modern JS run times.
You can find the source code for the JavaScript client in the [Github repository](https://github.com/wandb/wandb-js).
{{% alert %}}
Our JavaScript integration is still in Beta, if you run into issues please let us know.
{{% /alert %}}
## Installation
```shell
npm install @wandb/sdk
# or ...
yarn add @wandb/sdk
```
## Usage
### TypeScript/ESM:
```typescript
import wandb from '@wandb/sdk'
async function track() {
await wandb.init({config: {test: 1}});
wandb.log({acc: 0.9, loss: 0.1});
wandb.log({acc: 0.91, loss: 0.09});
await wandb.finish();
}
await track()
```
{{% alert color="secondary" %}}
We spawn a separate MessageChannel to process all api calls async. This will cause your script to hang if you don't call `await wandb.finish()`.
{{% /alert %}}
### Node/CommonJS:
```javascript
const wandb = require('@wandb/sdk').default;
```
We're currently missing a lot of the functionality found in our Python SDK, but basic logging functionality is available. We'll be adding additional features like [Tables]({{< relref "/guides/models/tables/?utm_source=github&utm_medium=code&utm_campaign=wandb&utm_content=readme" >}}) soon.
## Authentication and Settings
In node environments we look for `process.env.WANDB_API_KEY` and prompt for it's input if we have a TTY. In non-node environments we look for `sessionStorage.getItem("WANDB_API_KEY")`. Additional settings can be [found here](https://github.com/wandb/wandb-js/blob/main/src/sdk/lib/config.ts).
## Integrations
Our [Python integrations]({{< relref "/guides/integrations/" >}}) are widely used by our community, and we hope to build out more JavaScript integrations to help LLM app builders leverage whatever tool they want.
If you have any requests for additional integrations, we'd love you to open an issue with details about the request.
## LangChain.js
This library integrates with the popular library for building LLM applications, [LangChain.js](https://github.com/hwchase17/langchainjs) version >= 0.0.75.
```typescript
import {WandbTracer} from '@wandb/sdk/integrations/langchain';
const wbTracer = await WandbTracer.init({project: 'langchain-test'});
// run your langchain workloads...
chain.call({input: "My prompt"}, wbTracer)
await WandbTracer.finish();
```
{{% alert color="secondary" %}}
We spawn a seperate MessageChannel to process all api calls async. This will cause your script to hang if you don't call `await WandbTracer.finish()`.
{{% /alert %}}
See [this test](https://github.com/wandb/wandb-js/blob/main/src/sdk/integrations/langchain/langchain.test.ts) for a more detailed example.
# Python Library
Use wandb to track machine learning work.
Train and fine-tune models, manage models from experimentation to production.
For guides and examples, see https://docs.wandb.ai.
For scripts and interactive notebooks, see https://github.com/wandb/examples.
For reference documentation, see https://docs.wandb.com/ref/python.
## Classes
[`class Artifact`](./artifact.md): Flexible and lightweight building block for dataset and model versioning.
[`class Run`](./run.md): A unit of computation logged by wandb. Typically, this is an ML experiment.
## Functions
[`agent(...)`](./agent.md): Start one or more sweep agents.
[`controller(...)`](./controller.md): Public sweep controller constructor.
[`finish(...)`](./finish.md): Finish a run and upload any remaining data.
[`init(...)`](./init.md): Start a new run to track and log to W&B.
[`log(...)`](./log.md): Upload run data.
[`login(...)`](./login.md): Set up W&B login credentials.
[`save(...)`](./save.md): Sync one or more files to W&B.
[`sweep(...)`](./sweep.md): Initialize a hyperparameter sweep.
[`watch(...)`](./watch.md): Hooks into the given PyTorch model(s) to monitor gradients and the model's computational graph.
| Other Members | |
| :--- | :--- |
| `__version__` | `'0.20.1'` |
| `config` | |
| `summary` | |
# API Walkthrough
Learn when and how to use different W&B APIs to track, share, and manage model artifacts in your machine learning workflows. This page covers logging experiments, generating reports, and accessing logged data using the appropriate W&B API for each task.
W&B offers the following APIs:
* W&B Python SDK (`wandb.sdk`): Log and monitor experiments during training.
* W&B Public API (`wandb.apis.public`): Query and analyze logged experiment data.
* W&B Reports API (`wandb.wandb-workspaces`): Create reports to summarize findings.
## Sign up and create an API key
To authenticate your machine with W&B, you must first generate an API key at [wandb.ai/authorize](https://wandb.ai/authorize). Copy the API key and store it securely.
## Install and import packages
Install the W&B library and some other packages you will need for this walkthrough.
```python
pip install wandb
```
Import W&B Python SDK:
```python
import wandb
```
Specify the entity of your team in the following code block:
```python
TEAM_ENTITY = "" # Replace with your team entity
PROJECT = "my-awesome-project"
```
## Train model
The following code simulates a basic machine learning workflow: training a model, logging metrics, and saving the model as an artifact.
Use the W&B Python SDK (`wandb.sdk`) to interact with W&B during training. Log the loss using [`wandb.log`]({{< relref path="./run.md#log" >}}), then save the trained model as an artifact using [`wandb.Artifact`]({{< relref path="./artifact.md" >}}) before finally adding the model file using [`Artifact.add_file`]({{< relref path="./artifact.md#add_file" >}}).
```python
import random # For simulating data
def model(training_data: int) -> int:
"""Model simulation for demonstration purposes."""
return training_data * 2 + random.randint(-1, 1)
# Simulate weights and noise
weights = random.random() # Initialize random weights
noise = random.random() / 5 # Small random noise to simulate noise
# Hyperparameters and configuration
config = {
"epochs": 10, # Number of epochs to train
"learning_rate": 0.01, # Learning rate for the optimizer
}
# Use context manager to initialize and close W&B runs
with wandb.init(project=PROJECT, entity=TEAM_ENTITY, config=config) as run:
# Simulate training loop
for epoch in range(config["epochs"]):
xb = weights + noise # Simulated input training data
yb = weights + noise * 2 # Simulated target output (double the input noise)
y_pred = model(xb) # Model prediction
loss = (yb - y_pred) ** 2 # Mean Squared Error loss
print(f"epoch={epoch}, loss={y_pred}")
# Log epoch and loss to W&B
run.log({
"epoch": epoch,
"loss": loss,
})
# Unique name for the model artifact,
model_artifact_name = f"model-demo"
# Local path to save the simulated model file
PATH = "model.txt"
# Save model locally
with open(PATH, "w") as f:
f.write(str(weights)) # Saving model weights to a file
# Create an artifact object
# Add locally saved model to artifact object
artifact = wandb.Artifact(name=model_artifact_name, type="model", description="My trained model")
artifact.add_file(local_path=PATH)
artifact.save()
```
The key takeaways from the previous code block are:
* Use `wandb.log` to log metrics during training.
* Use `wandb.Artifact` to save models (datasets, and so forth) as an artifact to your W&B project.
Now that you have trained a model and saved it as an artifact, you can publish it to a registry in W&B. Use [`wandb.use_artifact`]({{< relref path="./run.md#use_artifact" >}}) to retrieve the artifact from your project and prepare it for publication in the Model registry. `wandb.use_artifact` serves two key purposes:
* Retrieves the artifact object from your project.
* Marks the artifact as an input to the run, ensuring reproducibility and traceability. See [Create and view lineage map]({{< relref path="/guides/core/registry/lineage/" >}}) for details.
## Publish the model to the Model registry
To share the model with others in your organization, publish it to a [collection]({{< relref path="../../guides/core/registry/create_collection" >}}) using `wandb.link_artifact`. The following code links the artifact to the [core Model registry]({{< relref path="../../guides/core/registry/registry_types/#core-registry" >}}), making it accessible to your team.
```python
# Artifact name specifies the specific artifact version within our team's project
artifact_name = f'{TEAM_ENTITY}/{PROJECT}/{model_artifact_name}:v0'
print("Artifact name: ", artifact_name)
REGISTRY_NAME = "Model" # Name of the registry in W&B
COLLECTION_NAME = "DemoModels" # Name of the collection in the registry
# Create a target path for our artifact in the registry
target_path = f"wandb-registry-{REGISTRY_NAME}/{COLLECTION_NAME}"
print("Target path: ", target_path)
run = wandb.init(entity=TEAM_ENTITY, project=PROJECT)
model_artifact = run.use_artifact(artifact_or_name=artifact_name, type="model")
run.link_artifact(artifact=model_artifact, target_path=target_path)
run.finish()
```
After running `link_artifact()`, the model artifact will be in the `DemoModels` collection in your registry. From there, you can view details such as the version history, [lineage map]({{< relref path="/guides/core/registry/lineage/" >}}), and other [metadata]({{< relref path="/guides/core/registry/registry_cards/" >}}).
For additional information on how to link artifacts to a registry, see [Link artifacts to a registry]({{< relref path="/guides/core/registry/link_version/" >}}).
## Retrieve model artifact from registry for inference
To use a model for inference, use `use_artifact()` to retrieve the published artifact from the registry. This returns an artifact object that you can then use [`download()`]({{< relref path="./artifact.md#download" >}}) to download the artifact to a local file.
```python
REGISTRY_NAME = "Model" # Name of the registry in W&B
COLLECTION_NAME = "DemoModels" # Name of the collection in the registry
VERSION = 0 # Version of the artifact to retrieve
model_artifact_name = f"wandb-registry-{REGISTRY_NAME}/{COLLECTION_NAME}:v{VERSION}"
print(f"Model artifact name: {model_artifact_name}")
run = wandb.init(entity=TEAM_ENTITY, project=PROJECT)
registry_model = run.use_artifact(artifact_or_name=model_artifact_name)
local_model_path = registry_model.download()
```
For more information on how to retrieve artifacts from a registry, see [Download an artifact from a registry]({{< relref path="/guides/core/registry/download_use_artifact/" >}}).
Depending on your machine learning framework, you may need to recreate the model architecture before loading the weights. This is left as an exercise for the reader, as it depends on the specific framework and model you are using.
## Share your finds with a report
Create and share a [report]({{< relref path="/guides/core/reports/" >}}) to summarize your work. To create a report programmatically, use the [W&B Reports API]({{< relref path="./wandb_workspaces/reports.md" >}}).
First, install the W&B Reports API:
```python
pip install wandb wandb-workspaces -qqq
```
The following code block creates a report with multiple blocks, including markdown, panel grids, and more. You can customize the report by adding more blocks or changing the content of existing blocks.
The output of the code block prints a link to the URL report created. You can open this link in your browser to view the report.
```python
import wandb_workspaces.reports.v2 as wr
experiment_summary = """This is a summary of the experiment conducted to train a simple model using W&B."""
dataset_info = """The dataset used for training consists of synthetic data generated by a simple model."""
model_info = """The model is a simple linear regression model that predicts output based on input data with some noise."""
report = wr.Report(
project=PROJECT,
entity=TEAM_ENTITY,
title="My Awesome Model Training Report",
description=experiment_summary,
blocks= [
wr.TableOfContents(),
wr.H2("Experiment Summary"),
wr.MarkdownBlock(text=experiment_summary),
wr.H2("Dataset Information"),
wr.MarkdownBlock(text=dataset_info),
wr.H2("Model Information"),
wr.MarkdownBlock(text = model_info),
wr.PanelGrid(
panels=[
wr.LinePlot(title="Train Loss", x="Step", y=["loss"], title_x="Step", title_y="Loss")
],
),
]
)
# Save the report to W&B
report.save()
```
For more information on how to create a report programmatically or how to create a report interactively with the W&B App, see [Create a report]({{< relref path="/guides/core/reports/create-a-report.md" >}}) in the W&B Docs Developer guide.
## Query the registry
Use the [W&B Public APIs]({{< relref path="./public-api/" >}}) to query, analyze, and manage historical data from W&B. This can be useful for tracking the lineage of artifacts, comparing different versions, and analyzing the performance of models over time.
The following code block demonstrates how to query the Model registry for all artifacts in a specific collection. It retrieves the collection and iterates through its versions, printing out the name and version of each artifact.
```python
import wandb
# Initialize wandb API
api = wandb.Api()
# Find all artifact versions that contains the string `model` and
# has either the tag `text-classification` or an `latest` alias
registry_filters = {
"name": {"$regex": "model"}
}
# Use logical $or operator to filter artifact versions
version_filters = {
"$or": [
{"tag": "text-classification"},
{"alias": "latest"}
]
}
# Returns an iterable of all artifact versions that match the filters
artifacts = api.registries(filter=registry_filters).collections().versions(filter=version_filters)
# Print out the name, collection, aliases, tags, and created_at date of each artifact found
for art in artifacts:
print(f"artifact name: {art.name}")
print(f"collection artifact belongs to: { art.collection.name}")
print(f"artifact aliases: {art.aliases}")
print(f"tags attached to artifact: {art.tags}")
print(f"artifact created at: {art.created_at}\n")
```
For more information on querying the registry, see the [Query registry items with MongoDB-style queries]({{< relref path="/guides/core/registry/search_registry.md#query-registry-items-with-mongodb-style-queries" >}}).
# agent
{{< cta-button githubLink=https://www.github.com/wandb/wandb/tree/v0.20.1/wandb/wandb_agent.py#L529-L573 >}}
Start one or more sweep agents.
```python
agent(
sweep_id: str,
function: Optional[Callable] = None,
entity: Optional[str] = None,
project: Optional[str] = None,
count: Optional[int] = None
) -> None
```
The sweep agent uses the `sweep_id` to know which sweep it
is a part of, what function to execute, and (optionally) how
many agents to run.
| Args | |
| :--- | :--- |
| `sweep_id` | The unique identifier for a sweep. A sweep ID is generated by W&B CLI or Python SDK. |
| `function` | A function to call instead of the "program" specified in the sweep config. |
| `entity` | The username or team name where you want to send W&B runs created by the sweep to. Ensure that the entity you specify already exists. If you don't specify an entity, the run will be sent to your default entity, which is usually your username. |
| `project` | The name of the project where W&B runs created from the sweep are sent to. If the project is not specified, the run is sent to a project labeled "Uncategorized". |
| `count` | The number of sweep config trials to try. |
# Artifact
{{< cta-button githubLink=https://www.github.com/wandb/wandb/tree/v0.20.1/wandb/sdk/artifacts/artifact.py#L124-L2658 >}}
Flexible and lightweight building block for dataset and model versioning.
```python
Artifact(
name: str,
type: str,
description: (str | None) = None,
metadata: (dict[str, Any] | None) = None,
incremental: bool = (False),
use_as: (str | None) = None
) -> None
```
Construct an empty W&B Artifact. Populate an artifacts contents with methods that
begin with `add`. Once the artifact has all the desired files, you can call
`wandb.log_artifact()` to log it.
| Args | |
| :--- | :--- |
| `name` | A human-readable name for the artifact. Use the name to identify a specific artifact in the W&B App UI or programmatically. You can interactively reference an artifact with the `use_artifact` Public API. A name can contain letters, numbers, underscores, hyphens, and dots. The name must be unique across a project. |
| `type` | The artifact's type. Use the type of an artifact to both organize and differentiate artifacts. You can use any string that contains letters, numbers, underscores, hyphens, and dots. Common types include `dataset` or `model`. Note: Some types are reserved for internal use and cannot be set by users. Such types include `job` and types that start with `wandb-`. |
| `description` | A description of the artifact. For Model or Dataset Artifacts, add documentation for your standardized team model or dataset card. View an artifact's description programmatically with the `Artifact.description` attribute or programmatically with the W&B App UI. W&B renders the description as markdown in the W&B App. |
| `metadata` | Additional information about an artifact. Specify metadata as a dictionary of key-value pairs. You can specify no more than 100 total keys. |
| `incremental` | Use `Artifact.new_draft()` method instead to modify an existing artifact. |
| `use_as` | Deprecated. |
| `is_link` | Boolean indication of if the artifact is a linked artifact(`True`) or source artifact(`False`). |
| Returns | |
| :--- | :--- |
| An `Artifact` object. |
| Attributes | |
| :--- | :--- |
| `aliases` | List of one or more semantically-friendly references or identifying "nicknames" assigned to an artifact version. Aliases are mutable references that you can programmatically reference. Change an artifact's alias with the W&B App UI or programmatically. See [Create new artifact versions](https://docs.wandb.ai/guides/artifacts/create-a-new-artifact-version) for more information. |
| `collection` | The collection this artifact was retrieved from. A collection is an ordered group of artifact versions. If this artifact was retrieved from a portfolio / linked collection, that collection will be returned rather than the collection that an artifact version originated from. The collection that an artifact originates from is known as the source sequence. |
| `commit_hash` | The hash returned when this artifact was committed. |
| `created_at` | Timestamp when the artifact was created. |
| `description` | A description of the artifact. |
| `digest` | The logical digest of the artifact. The digest is the checksum of the artifact's contents. If an artifact has the same digest as the current `latest` version, then `log_artifact` is a no-op. |
| `entity` | The name of the entity that the artifact collection belongs to. If the artifact is a link, the entity will be the entity of the linked artifact. |
| `file_count` | The number of files (including references). |
| `history_step` | The nearest step at which history metrics were logged for the source run of the artifact. |
| `id` | The artifact's ID. |
| `is_link` | Boolean flag indicating if the artifact is a link artifact. True: The artifact is a link artifact to a source artifact. False: The artifact is a source artifact. |
| `linked_artifacts` | Returns a list of all the linked artifacts of a source artifact. If the artifact is a link artifact (`artifact.is_link == True`), it will return an empty list. Limited to 500 results. |
| `manifest` | The artifact's manifest. The manifest lists all of its contents, and can't be changed once the artifact has been logged. |
| `metadata` | User-defined artifact metadata. Structured data associated with the artifact. |
| `name` | The artifact name and version of the artifact. A string with the format `{collection}:{alias}`. If fetched before an artifact is logged/saved, the name won't contain the alias. If the artifact is a link, the name will be the name of the linked artifact. |
| `project` | The name of the project that the artifact collection belongs to. If the artifact is a link, the project will be the project of the linked artifact. |
| `qualified_name` | The entity/project/name of the artifact. If the artifact is a link, the qualified name will be the qualified name of the linked artifact path. |
| `size` | The total size of the artifact in bytes. Includes any references tracked by this artifact. |
| `source_artifact` | Returns the source artifact. The source artifact is the original logged artifact. If the artifact itself is a source artifact (`artifact.is_link == False`), it will return itself. |
| `source_collection` | The artifact's source collection. The source collection is the collection that the artifact was logged from. |
| `source_entity` | The name of the entity of the source artifact. |
| `source_name` | The artifact name and version of the source artifact. A string with the format `{source_collection}:{alias}`. Before the artifact is saved, contains only the name since the version is not yet known. |
| `source_project` | The name of the project of the source artifact. |
| `source_qualified_name` | The source_entity/source_project/source_name of the source artifact. |
| `source_version` | The source artifact's version. A string with the format `v{number}`. |
| `state` | The status of the artifact. One of: "PENDING", "COMMITTED", or "DELETED". |
| `tags` | List of one or more tags assigned to this artifact version. |
| `ttl` | The time-to-live (TTL) policy of an artifact. Artifacts are deleted shortly after a TTL policy's duration passes. If set to `None`, the artifact deactivates TTL policies and will be not scheduled for deletion, even if there is a team default TTL. An artifact inherits a TTL policy from the team default if the team administrator defines a default TTL and there is no custom policy set on an artifact. |
| `type` | The artifact's type. Common types include `dataset` or `model`. |
| `updated_at` | The time when the artifact was last updated. |
| `url` | Constructs the URL of the artifact. |
| `use_as` | Deprecated. |
| `version` | The artifact's version. A string with the format `v{number}`. If the artifact is a link artifact, the version will be from the linked collection. |
## Methods
### `add`
[View source](https://www.github.com/wandb/wandb/tree/v0.20.1/wandb/sdk/artifacts/artifact.py#L1593-L1685)
```python
add(
obj: WBValue,
name: StrPath,
overwrite: bool = (False)
) -> ArtifactManifestEntry
```
Add wandb.WBValue `obj` to the artifact.
| Args | |
| :--- | :--- |
| `obj` | The object to add. Currently support one of Bokeh, JoinedTable, PartitionedTable, Table, Classes, ImageMask, BoundingBoxes2D, Audio, Image, Video, Html, Object3D |
| `name` | The path within the artifact to add the object. |
| `overwrite` | If True, overwrite existing objects with the same file path (if applicable). |
| Returns | |
| :--- | :--- |
| The added manifest entry |
| Raises | |
| :--- | :--- |
| `ArtifactFinalizedError` | You cannot make changes to the current artifact version because it is finalized. Log a new artifact version instead. |
### `add_dir`
[View source](https://www.github.com/wandb/wandb/tree/v0.20.1/wandb/sdk/artifacts/artifact.py#L1442-L1508)
```python
add_dir(
local_path: str,
name: (str | None) = None,
skip_cache: (bool | None) = (False),
policy: (Literal['mutable', 'immutable'] | None) = "mutable",
merge: bool = (False)
) -> None
```
Add a local directory to the artifact.
| Args | |
| :--- | :--- |
| `local_path` | The path of the local directory. |
| `name` | The subdirectory name within an artifact. The name you specify appears in the W&B App UI nested by artifact's `type`. Defaults to the root of the artifact. |
| `skip_cache` | If set to `True`, W&B will not copy/move files to the cache while uploading |
| `policy` | "mutable" | "immutable". By default, "mutable" "mutable": Create a temporary copy of the file to prevent corruption during upload. "immutable": Disable protection, rely on the user not to delete or change the file. |
| `merge` | If `False` (default), throws ValueError if a file was already added in a previous add_dir call and its content has changed. If `True`, overwrites existing files with changed content. Always adds new files and never removes files. To replace an entire directory, pass a name when adding the directory using `add_dir(local_path, name=my_prefix)` and call `remove(my_prefix)` to remove the directory, then add it again. |
| Raises | |
| :--- | :--- |
| `ArtifactFinalizedError` | You cannot make changes to the current artifact version because it is finalized. Log a new artifact version instead. |
| `ValueError` | Policy must be "mutable" or "immutable" |
### `add_file`
[View source](https://www.github.com/wandb/wandb/tree/v0.20.1/wandb/sdk/artifacts/artifact.py#L1389-L1440)
```python
add_file(
local_path: str,
name: (str | None) = None,
is_tmp: (bool | None) = (False),
skip_cache: (bool | None) = (False),
policy: (Literal['mutable', 'immutable'] | None) = "mutable",
overwrite: bool = (False)
) -> ArtifactManifestEntry
```
Add a local file to the artifact.
| Args | |
| :--- | :--- |
| `local_path` | The path to the file being added. |
| `name` | The path within the artifact to use for the file being added. Defaults to the basename of the file. |
| `is_tmp` | If true, then the file is renamed deterministically to avoid collisions. |
| `skip_cache` | If `True`, W&B will not copy files to the cache after uploading. |
| `policy` | By default, set to "mutable". If set to "mutable", create a temporary copy of the file to prevent corruption during upload. If set to "immutable", disable protection and rely on the user not to delete or change the file. |
| `overwrite` | If `True`, overwrite the file if it already exists. |
| Returns | |
| :--- | :--- |
| The added manifest entry. |
| Raises | |
| :--- | :--- |
| `ArtifactFinalizedError` | You cannot make changes to the current artifact version because it is finalized. Log a new artifact version instead. |
| `ValueError` | Policy must be "mutable" or "immutable" |
### `add_reference`
[View source](https://www.github.com/wandb/wandb/tree/v0.20.1/wandb/sdk/artifacts/artifact.py#L1510-L1591)
```python
add_reference(
uri: (ArtifactManifestEntry | str),
name: (StrPath | None) = None,
checksum: bool = (True),
max_objects: (int | None) = None
) -> Sequence[ArtifactManifestEntry]
```
Add a reference denoted by a URI to the artifact.
Unlike files or directories that you add to an artifact, references are not
uploaded to W&B. For more information,
see [Track external files](https://docs.wandb.ai/guides/artifacts/track-external-files).
By default, the following schemes are supported:
- http(s): The size and digest of the file will be inferred by the
`Content-Length` and the `ETag` response headers returned by the server.
- s3: The checksum and size are pulled from the object metadata. If bucket
versioning is enabled, then the version ID is also tracked.
- gs: The checksum and size are pulled from the object metadata. If bucket
versioning is enabled, then the version ID is also tracked.
- https, domain matching `*.blob.core.windows.net` (Azure): The checksum and size
are be pulled from the blob metadata. If storage account versioning is
enabled, then the version ID is also tracked.
- file: The checksum and size are pulled from the file system. This scheme
is useful if you have an NFS share or other externally mounted volume
containing files you wish to track but not necessarily upload.
For any other scheme, the digest is just a hash of the URI and the size is left
blank.
| Args | |
| :--- | :--- |
| `uri` | The URI path of the reference to add. The URI path can be an object returned from `Artifact.get_entry` to store a reference to another artifact's entry. |
| `name` | The path within the artifact to place the contents of this reference. |
| `checksum` | Whether or not to checksum the resource(s) located at the reference URI. Checksumming is strongly recommended as it enables automatic integrity validation. Disabling checksumming will speed up artifact creation but reference directories will not iterated through so the objects in the directory will not be saved to the artifact. We recommend setting `checksum=False` when adding reference objects, in which case a new version will only be created if the reference URI changes. |
| `max_objects` | The maximum number of objects to consider when adding a reference that points to directory or bucket store prefix. By default, the maximum number of objects allowed for Amazon S3, GCS, Azure, and local files is 10,000,000. Other URI schemas do not have a maximum. |
| Returns | |
| :--- | :--- |
| The added manifest entries. |
| Raises | |
| :--- | :--- |
| `ArtifactFinalizedError` | You cannot make changes to the current artifact version because it is finalized. Log a new artifact version instead. |
### `checkout`
[View source](https://www.github.com/wandb/wandb/tree/v0.20.1/wandb/sdk/artifacts/artifact.py#L2153-L2181)
```python
checkout(
root: (str | None) = None
) -> str
```
Replace the specified root directory with the contents of the artifact.
WARNING: This will delete all files in `root` that are not included in the
artifact.
| Args | |
| :--- | :--- |
| `root` | The directory to replace with this artifact's files. |
| Returns | |
| :--- | :--- |
| The path of the checked out contents. |
| Raises | |
| :--- | :--- |
| `ArtifactNotLoggedError` | If the artifact is not logged. |
### `delete`
[View source](https://www.github.com/wandb/wandb/tree/v0.20.1/wandb/sdk/artifacts/artifact.py#L2289-L2313)
```python
delete(
delete_aliases: bool = (False)
) -> None
```
Delete an artifact and its files.
If called on a linked artifact (i.e. a member of a portfolio collection): only the link is deleted, and the
source artifact is unaffected.
Use `artifact.unlink()` instead of `artifact.delete()` to remove a link between a source artifact and a linked artifact.
| Args | |
| :--- | :--- |
| `delete_aliases` | If set to `True`, deletes all aliases associated with the artifact. Otherwise, this raises an exception if the artifact has existing aliases. This parameter is ignored if the artifact is linked (i.e. a member of a portfolio collection). |
| Raises | |
| :--- | :--- |
| `ArtifactNotLoggedError` | If the artifact is not logged. |
### `download`
[View source](https://www.github.com/wandb/wandb/tree/v0.20.1/wandb/sdk/artifacts/artifact.py#L1863-L1915)
```python
download(
root: (StrPath | None) = None,
allow_missing_references: bool = (False),
skip_cache: (bool | None) = None,
path_prefix: (StrPath | None) = None,
multipart: (bool | None) = None
) -> FilePathStr
```
Download the contents of the artifact to the specified root directory.
Existing files located within `root` are not modified. Explicitly delete `root`
before you call `download` if you want the contents of `root` to exactly match
the artifact.
| Args | |
| :--- | :--- |
| `root` | The directory W&B stores the artifact's files. |
| `allow_missing_references` | If set to `True`, any invalid reference paths will be ignored while downloading referenced files. |
| `skip_cache` | If set to `True`, the artifact cache will be skipped when downloading and W&B will download each file into the default root or specified download directory. |
| `path_prefix` | If specified, only files with a path that starts with the given prefix will be downloaded. Uses unix format (forward slashes). |
| `multipart` | If set to `None` (default), the artifact will be downloaded in parallel using multipart download if individual file size is greater than 2GB. If set to `True` or `False`, the artifact will be downloaded in parallel or serially regardless of the file size. |
| Returns | |
| :--- | :--- |
| The path to the downloaded contents. |
| Raises | |
| :--- | :--- |
| `ArtifactNotLoggedError` | If the artifact is not logged. |
### `file`
[View source](https://www.github.com/wandb/wandb/tree/v0.20.1/wandb/sdk/artifacts/artifact.py#L2221-L2245)
```python
file(
root: (str | None) = None
) -> StrPath
```
Download a single file artifact to the directory you specify with `root`.
| Args | |
| :--- | :--- |
| `root` | The root directory to store the file. Defaults to './artifacts/self.name/'. |
| Returns | |
| :--- | :--- |
| The full path of the downloaded file. |
| Raises | |
| :--- | :--- |
| `ArtifactNotLoggedError` | If the artifact is not logged. |
| `ValueError` | If the artifact contains more than one file. |
### `files`
[View source](https://www.github.com/wandb/wandb/tree/v0.20.1/wandb/sdk/artifacts/artifact.py#L2247-L2264)
```python
files(
names: (list[str] | None) = None,
per_page: int = 50
) -> ArtifactFiles
```
Iterate over all files stored in this artifact.
| Args | |
| :--- | :--- |
| `names` | The filename paths relative to the root of the artifact you wish to list. |
| `per_page` | The number of files to return per request. |
| Returns | |
| :--- | :--- |
| An iterator containing `File` objects. |
| Raises | |
| :--- | :--- |
| `ArtifactNotLoggedError` | If the artifact is not logged. |
### `finalize`
[View source](https://www.github.com/wandb/wandb/tree/v0.20.1/wandb/sdk/artifacts/artifact.py#L1062-L1070)
```python
finalize() -> None
```
Finalize the artifact version.
You cannot modify an artifact version once it is finalized because the artifact
is logged as a specific artifact version. Create a new artifact version
to log more data to an artifact. An artifact is automatically finalized
when you log the artifact with `log_artifact`.
### `get`
[View source](https://www.github.com/wandb/wandb/tree/v0.20.1/wandb/sdk/artifacts/artifact.py#L1780-L1825)
```python
get(
name: str
) -> (WBValue | None)
```
Get the WBValue object located at the artifact relative `name`.
| Args | |
| :--- | :--- |
| `name` | The artifact relative name to retrieve. |
| Returns | |
| :--- | :--- |
| W&B object that can be logged with `wandb.log()` and visualized in the W&B UI. |
| Raises | |
| :--- | :--- |
| `ArtifactNotLoggedError` | if the artifact isn't logged or the run is offline |
### `get_added_local_path_name`
[View source](https://www.github.com/wandb/wandb/tree/v0.20.1/wandb/sdk/artifacts/artifact.py#L1827-L1839)
```python
get_added_local_path_name(
local_path: str
) -> (str | None)
```
Get the artifact relative name of a file added by a local filesystem path.
| Args | |
| :--- | :--- |
| `local_path` | The local path to resolve into an artifact relative name. |
| Returns | |
| :--- | :--- |
| The artifact relative name. |
### `get_entry`
[View source](https://www.github.com/wandb/wandb/tree/v0.20.1/wandb/sdk/artifacts/artifact.py#L1759-L1778)
```python
get_entry(
name: StrPath
) -> ArtifactManifestEntry
```
Get the entry with the given name.
| Args | |
| :--- | :--- |
| `name` | The artifact relative name to get |
| Returns | |
| :--- | :--- |
| A `W&B` object. |
| Raises | |
| :--- | :--- |
| `ArtifactNotLoggedError` | if the artifact isn't logged or the run is offline. |
| `KeyError` | if the artifact doesn't contain an entry with the given name. |
### `get_path`
[View source](https://www.github.com/wandb/wandb/tree/v0.20.1/wandb/sdk/artifacts/artifact.py#L1751-L1757)
```python
get_path(
name: StrPath
) -> ArtifactManifestEntry
```
Deprecated. Use `get_entry(name)`.
### `is_draft`
[View source](https://www.github.com/wandb/wandb/tree/v0.20.1/wandb/sdk/artifacts/artifact.py#L1072-L1077)
```python
is_draft() -> bool
```
Check if artifact is not saved.
Returns: Boolean. `False` if artifact is saved. `True` if artifact is not saved.
### `json_encode`
[View source](https://www.github.com/wandb/wandb/tree/v0.20.1/wandb/sdk/artifacts/artifact.py#L2520-L2527)
```python
json_encode() -> dict[str, Any]
```
Returns the artifact encoded to the JSON format.
| Returns | |
| :--- | :--- |
| A `dict` with `string` keys representing attributes of the artifact. |
### `link`
[View source](https://www.github.com/wandb/wandb/tree/v0.20.1/wandb/sdk/artifacts/artifact.py#L2340-L2382)
```python
link(
target_path: str,
aliases: (list[str] | None) = None
) -> (Artifact | None)
```
Link this artifact to a portfolio (a promoted collection of artifacts).
| Args | |
| :--- | :--- |
| `target_path` | The path to the portfolio inside a project. The target path must adhere to one of the following schemas `{portfolio}`, `{project}/{portfolio}` or `{entity}/{project}/{portfolio}`. To link the artifact to the Model Registry, rather than to a generic portfolio inside a project, set `target_path` to the following schema `{"model-registry"}/{Registered Model Name}` or `{entity}/{"model-registry"}/{Registered Model Name}`. |
| `aliases` | A list of strings that uniquely identifies the artifact inside the specified portfolio. |
| Raises | |
| :--- | :--- |
| `ArtifactNotLoggedError` | If the artifact is not logged. |
| Returns | |
| :--- | :--- |
| The linked artifact if linking was successful, otherwise None. |
### `logged_by`
[View source](https://www.github.com/wandb/wandb/tree/v0.20.1/wandb/sdk/artifacts/artifact.py#L2476-L2518)
```python
logged_by() -> (Run | None)
```
Get the W&B run that originally logged the artifact.
| Returns | |
| :--- | :--- |
| The name of the W&B run that originally logged the artifact. |
| Raises | |
| :--- | :--- |
| `ArtifactNotLoggedError` | If the artifact is not logged. |
### `new_draft`
[View source](https://www.github.com/wandb/wandb/tree/v0.20.1/wandb/sdk/artifacts/artifact.py#L473-L506)
```python
new_draft() -> Artifact
```
Create a new draft artifact with the same content as this committed artifact.
Modifying an existing artifact creates a new artifact version known
as an "incremental artifact". The artifact returned can be extended or
modified and logged as a new version.
| Returns | |
| :--- | :--- |
| An `Artifact` object. |
| Raises | |
| :--- | :--- |
| `ArtifactNotLoggedError` | If the artifact is not logged. |
### `new_file`
[View source](https://www.github.com/wandb/wandb/tree/v0.20.1/wandb/sdk/artifacts/artifact.py#L1346-L1387)
```python
@contextlib.contextmanager
new_file(
name: str,
mode: str = "x",
encoding: (str | None) = None
) -> Iterator[IO]
```
Open a new temporary file and add it to the artifact.
| Args | |
| :--- | :--- |
| `name` | The name of the new file to add to the artifact. |
| `mode` | The file access mode to use to open the new file. |
| `encoding` | The encoding used to open the new file. |
| Returns | |
| :--- | :--- |
| A new file object that can be written to. Upon closing, the file will be automatically added to the artifact. |
| Raises | |
| :--- | :--- |
| `ArtifactFinalizedError` | You cannot make changes to the current artifact version because it is finalized. Log a new artifact version instead. |
### `remove`
[View source](https://www.github.com/wandb/wandb/tree/v0.20.1/wandb/sdk/artifacts/artifact.py#L1721-L1749)
```python
remove(
item: (StrPath | ArtifactManifestEntry)
) -> None
```
Remove an item from the artifact.
| Args | |
| :--- | :--- |
| `item` | The item to remove. Can be a specific manifest entry or the name of an artifact-relative path. If the item matches a directory all items in that directory will be removed. |
| Raises | |
| :--- | :--- |
| `ArtifactFinalizedError` | You cannot make changes to the current artifact version because it is finalized. Log a new artifact version instead. |
| `FileNotFoundError` | If the item isn't found in the artifact. |
### `save`
[View source](https://www.github.com/wandb/wandb/tree/v0.20.1/wandb/sdk/artifacts/artifact.py#L1082-L1122)
```python
save(
project: (str | None) = None,
settings: (wandb.Settings | None) = None
) -> None
```
Persist any changes made to the artifact.
If currently in a run, that run will log this artifact. If not currently in a
run, a run of type "auto" is created to track this artifact.
| Args | |
| :--- | :--- |
| `project` | A project to use for the artifact in the case that a run is not already in context. |
| `settings` | A settings object to use when initializing an automatic run. Most commonly used in testing harness. |
### `unlink`
[View source](https://www.github.com/wandb/wandb/tree/v0.20.1/wandb/sdk/artifacts/artifact.py#L2384-L2399)
```python
unlink() -> None
```
Unlink this artifact if it is currently a member of a portfolio (a promoted collection of artifacts).
| Raises | |
| :--- | :--- |
| `ArtifactNotLoggedError` | If the artifact is not logged. |
| `ValueError` | If the artifact is not linked, i.e. it is not a member of a portfolio collection. |
### `used_by`
[View source](https://www.github.com/wandb/wandb/tree/v0.20.1/wandb/sdk/artifacts/artifact.py#L2430-L2474)
```python
used_by() -> list[Run]
```
Get a list of the runs that have used this artifact and its linked artifacts.
| Returns | |
| :--- | :--- |
| A list of `Run` objects. |
| Raises | |
| :--- | :--- |
| `ArtifactNotLoggedError` | If the artifact is not logged. |
### `verify`
[View source](https://www.github.com/wandb/wandb/tree/v0.20.1/wandb/sdk/artifacts/artifact.py#L2183-L2219)
```python
verify(
root: (str | None) = None
) -> None
```
Verify that the contents of an artifact match the manifest.
All files in the directory are checksummed and the checksums are then
cross-referenced against the artifact's manifest. References are not verified.
| Args | |
| :--- | :--- |
| `root` | The directory to verify. If None artifact will be downloaded to './artifacts/self.name/'. |
| Raises | |
| :--- | :--- |
| `ArtifactNotLoggedError` | If the artifact is not logged. |
| `ValueError` | If the verification fails. |
### `wait`
[View source](https://www.github.com/wandb/wandb/tree/v0.20.1/wandb/sdk/artifacts/artifact.py#L1132-L1156)
```python
wait(
timeout: (int | None) = None
) -> Artifact
```
If needed, wait for this artifact to finish logging.
| Args | |
| :--- | :--- |
| `timeout` | The time, in seconds, to wait. |
| Returns | |
| :--- | :--- |
| An `Artifact` object. |
### `__getitem__`
[View source](https://www.github.com/wandb/wandb/tree/v0.20.1/wandb/sdk/artifacts/artifact.py#L1316-L1328)
```python
__getitem__(
name: str
) -> (WBValue | None)
```
Get the WBValue object located at the artifact relative `name`.
| Args | |
| :--- | :--- |
| `name` | The artifact relative name to get. |
| Returns | |
| :--- | :--- |
| W&B object that can be logged with `wandb.log()` and visualized in the W&B UI. |
| Raises | |
| :--- | :--- |
| `ArtifactNotLoggedError` | If the artifact isn't logged or the run is offline. |
### `__setitem__`
[View source](https://www.github.com/wandb/wandb/tree/v0.20.1/wandb/sdk/artifacts/artifact.py#L1330-L1344)
```python
__setitem__(
name: str,
item: WBValue
) -> ArtifactManifestEntry
```
Add `item` to the artifact at path `name`.
| Args | |
| :--- | :--- |
| `name` | The path within the artifact to add the object. |
| `item` | The object to add. |
| Returns | |
| :--- | :--- |
| The added manifest entry |
| Raises | |
| :--- | :--- |
| `ArtifactFinalizedError` | You cannot make changes to the current artifact version because it is finalized. Log a new artifact version instead. |
# automations
## Classes
[`class Automation`](./automation.md): A local instance of a saved W&B automation.
[`class DoNothing`](./donothing.md): Defines an automation action that intentionally does nothing.
[`class MetricChangeFilter`](./metricchangefilter.md): Defines a filter that compares a change in a run metric against a user-defined threshold.
[`class MetricThresholdFilter`](./metricthresholdfilter.md): Defines a filter that compares a run metric against a user-defined threshold value.
[`class NewAutomation`](./newautomation.md): A new automation to be created.
[`class OnAddArtifactAlias`](./onaddartifactalias.md): A new alias is assigned to an artifact.
[`class OnCreateArtifact`](./oncreateartifact.md): A new artifact is created.
[`class OnLinkArtifact`](./onlinkartifact.md): A new artifact is linked to a collection.
[`class OnRunMetric`](./onrunmetric.md): A run metric satisfies a user-defined condition.
[`class SendNotification`](./sendnotification.md): Defines an automation action that sends a (Slack) notification.
[`class SendWebhook`](./sendwebhook.md): Defines an automation action that sends a webhook request.
# controller
{{< cta-button githubLink=https://www.github.com/wandb/wandb/tree/v0.20.1/wandb/sdk/wandb_sweep.py#L95-L119 >}}
Public sweep controller constructor.
```python
controller(
sweep_id_or_config: Optional[Union[str, Dict]] = None,
entity: Optional[str] = None,
project: Optional[str] = None
) -> "_WandbController"
```
#### Usage:
```python
import wandb
tuner = wandb.controller(...)
print(tuner.sweep_config)
print(tuner.sweep_id)
tuner.configure_search(...)
tuner.configure_stopping(...)
```
# Data Types
This module defines data types for logging rich, interactive visualizations to W&B.
Data types include common media types, like images, audio, and videos,
flexible containers for information, like tables and HTML, and more.
For more on logging media, see [our guide](https://docs.wandb.com/guides/track/log/media)
For more on logging structured data for interactive dataset and model analysis,
see [our guide to W&B Tables](https://docs.wandb.com/guides/models/tables/).
All of these special data types are subclasses of WBValue. All the data types
serialize to JSON, since that is what wandb uses to save the objects locally
and upload them to the W&B server.
## Classes
[`class Audio`](./audio.md): Wandb class for audio clips.
[`class BoundingBoxes2D`](./boundingboxes2d.md): Format images with 2D bounding box overlays for logging to W&B.
[`class Graph`](./graph.md): Wandb class for graphs.
[`class Histogram`](./histogram.md): wandb class for histograms.
[`class Html`](./html.md): A class for logging HTML content to W&B.
[`class Image`](./image.md): A class for logging images to W&B.
[`class ImageMask`](./imagemask.md): Format image masks or overlays for logging to W&B.
[`class Molecule`](./molecule.md): Wandb class for 3D Molecular data.
[`class Object3D`](./object3d.md): Wandb class for 3D point clouds.
[`class Plotly`](./plotly.md): Wandb class for plotly plots.
[`class Table`](./table.md): The Table class used to display and analyze tabular data.
[`class Video`](./video.md): A class for logging videos to W&B.
[`class WBTraceTree`](./wbtracetree.md): Media object for trace tree data.
# finish
{{< cta-button githubLink=https://www.github.com/wandb/wandb/tree/v0.20.1/wandb/sdk/wandb_run.py#L4153-L4174 >}}
Finish a run and upload any remaining data.
```python
finish(
exit_code: (int | None) = None,
quiet: (bool | None) = None
) -> None
```
Marks the completion of a W&B run and ensures all data is synced to the server.
The run's final state is determined by its exit conditions and sync status.
#### Run States:
- Running: Active run that is logging data and/or sending heartbeats.
- Crashed: Run that stopped sending heartbeats unexpectedly.
- Finished: Run completed successfully (`exit_code=0`) with all data synced.
- Failed: Run completed with errors (`exit_code!=0`).
| Args | |
| :--- | :--- |
| `exit_code` | Integer indicating the run's exit status. Use 0 for success, any other value marks the run as failed. |
| `quiet` | Deprecated. Configure logging verbosity using `wandb.Settings(quiet=...)`. |
# Import & Export API
## Classes
[`class Api`](./api.md): Used for querying the wandb server.
[`class File`](./file.md): File is a class associated with a file saved by wandb.
[`class Files`](./files.md): An iterable collection of `File` objects.
[`class Job`](./job.md)
[`class Project`](./project.md): A project is a namespace for runs.
[`class Projects`](./projects.md): An iterable collection of `Project` objects.
[`class QueuedRun`](./queuedrun.md): A single queued run associated with an entity and project. Call `run = queued_run.wait_until_running()` or `run = queued_run.wait_until_finished()` to access the run.
[`class Registry`](./registry.md): A single registry in the Registry.
[`class Run`](./run.md): A single run associated with an entity and project.
[`class RunQueue`](./runqueue.md)
[`class Runs`](./runs.md): An iterable collection of runs associated with a project and optional filter.
[`class Sweep`](./sweep.md): A set of runs associated with a sweep.
# init
{{< cta-button githubLink=https://www.github.com/wandb/wandb/tree/v0.20.1/wandb/sdk/wandb_init.py#L1250-L1624 >}}
Start a new run to track and log to W&B.
```python
init(
entity: (str | None) = None,
project: (str | None) = None,
dir: (StrPath | None) = None,
id: (str | None) = None,
name: (str | None) = None,
notes: (str | None) = None,
tags: (Sequence[str] | None) = None,
config: (dict[str, Any] | str | None) = None,
config_exclude_keys: (list[str] | None) = None,
config_include_keys: (list[str] | None) = None,
allow_val_change: (bool | None) = None,
group: (str | None) = None,
job_type: (str | None) = None,
mode: (Literal['online', 'offline', 'disabled'] | None) = None,
force: (bool | None) = None,
anonymous: (Literal['never', 'allow', 'must'] | None) = None,
reinit: (bool | Literal[None, 'default', 'return_previous', 'finish_previous',
'create_new']) = None,
resume: (bool | Literal['allow', 'never', 'must', 'auto'] | None) = None,
resume_from: (str | None) = None,
fork_from: (str | None) = None,
save_code: (bool | None) = None,
tensorboard: (bool | None) = None,
sync_tensorboard: (bool | None) = None,
monitor_gym: (bool | None) = None,
settings: (Settings | dict[str, Any] | None) = None
) -> Run
```
In an ML training pipeline, you could add `wandb.init()` to the beginning of
your training script as well as your evaluation script, and each piece would
be tracked as a run in W&B.
`wandb.init()` spawns a new background process to log data to a run, and it
also syncs data to https://wandb.ai by default, so you can see your results
in real-time.
Call `wandb.init()` to start a run before logging data with `wandb.log()`.
When you're done logging data, call `wandb.finish()` to end the run. If you
don't call `wandb.finish()`, the run will end when your script exits.
For more on using `wandb.init()`, including detailed examples, check out our
[guide and FAQs](https://docs.wandb.ai/guides/track/launch).
#### Examples:
### Explicitly set the entity and project and choose a name for the run:
```python
import wandb
run = wandb.init(
entity="geoff",
project="capsules",
name="experiment-2021-10-31",
)
# ... your training code here ...
run.finish()
```
### Add metadata about the run using the `config` argument:
```python
import wandb
config = {"lr": 0.01, "batch_size": 32}
with wandb.init(config=config) as run:
run.config.update({"architecture": "resnet", "depth": 34})
# ... your training code here ...
```
Note that you can use `wandb.init()` as a context manager to automatically
call `wandb.finish()` at the end of the block.
| Args | |
| :--- | :--- |
| `entity` | The username or team name under which the runs will be logged. The entity must already exist, so ensure you’ve created your account or team in the UI before starting to log runs. If not specified, the run will default your default entity. To change the default entity, go to [your settings](https://wandb.ai/settings) and update the "Default location to create new projects" under "Default team". |
| `project` | The name of the project under which this run will be logged. If not specified, we use a heuristic to infer the project name based on the system, such as checking the git root or the current program file. If we can't infer the project name, the project will default to `"uncategorized"`. |
| `dir` | The absolute path to the directory where experiment logs and metadata files are stored. If not specified, this defaults to the `./wandb` directory. Note that this does not affect the location where artifacts are stored when calling `download()`. |
| `id` | A unique identifier for this run, used for resuming. It must be unique within the project and cannot be reused once a run is deleted. The identifier must not contain any of the following special characters: `/ \ # ? % :`. For a short descriptive name, use the `name` field, or for saving hyperparameters to compare across runs, use `config`. |
| `name` | A short display name for this run, which appears in the UI to help you identify it. By default, we generate a random two-word name allowing easy cross-reference runs from table to charts. Keeping these run names brief enhances readability in chart legends and tables. For saving hyperparameters, we recommend using the `config` field. |
| `notes` | A detailed description of the run, similar to a commit message in Git. Use this argument to capture any context or details that may help you recall the purpose or setup of this run in the future. |
| `tags` | A list of tags to label this run in the UI. Tags are helpful for organizing runs or adding temporary identifiers like "baseline" or "production." You can easily add, remove tags, or filter by tags in the UI. If resuming a run, the tags provided here will replace any existing tags. To add tags to a resumed run without overwriting the current tags, use `run.tags += ["new_tag"]` after calling `run = wandb.init()`. |
| `config` | Sets `wandb.config`, a dictionary-like object for storing input parameters to your run, such as model hyperparameters or data preprocessing settings. The config appears in the UI in an overview page, allowing you to group, filter, and sort runs based on these parameters. Keys should not contain periods (`.`), and values should be smaller than 10 MB. If a dictionary, `argparse.Namespace`, or `absl.flags.FLAGS` is provided, the key-value pairs will be loaded directly into `wandb.config`. If a string is provided, it is interpreted as a path to a YAML file, from which configuration values will be loaded into `wandb.config`. |
| `config_exclude_keys` | A list of specific keys to exclude from `wandb.config`. |
| `config_include_keys` | A list of specific keys to include in `wandb.config`. |
| `allow_val_change` | Controls whether config values can be modified after their initial set. By default, an exception is raised if a config value is overwritten. For tracking variables that change during training, such as a learning rate, consider using `wandb.log()` instead. By default, this is `False` in scripts and `True` in Notebook environments. |
| `group` | Specify a group name to organize individual runs as part of a larger experiment. This is useful for cases like cross-validation or running multiple jobs that train and evaluate a model on different test sets. Grouping allows you to manage related runs collectively in the UI, making it easy to toggle and review results as a unified experiment. For more information, refer to our [guide to grouping runs](https://docs.wandb.com/guides/runs/grouping). |
| `job_type` | Specify the type of run, especially helpful when organizing runs within a group as part of a larger experiment. For example, in a group, you might label runs with job types such as "train" and "eval". Defining job types enables you to easily filter and group similar runs in the UI, facilitating direct comparisons. |
| `mode` | Specifies how run data is managed, with the following options: - `"online"` (default): Enables live syncing with W&B when a network connection is available, with real-time updates to visualizations. - `"offline"`: Suitable for air-gapped or offline environments; data is saved locally and can be synced later. Ensure the run folder is preserved to enable future syncing. - `"disabled"`: Disables all W&B functionality, making the run’s methods no-ops. Typically used in testing to bypass W&B operations. |
| `force` | Determines if a W&B login is required to run the script. If `True`, the user must be logged in to W&B; otherwise, the script will not proceed. If `False` (default), the script can proceed without a login, switching to offline mode if the user is not logged in. |
| `anonymous` | Specifies the level of control over anonymous data logging. Available options are: - `"never"` (default): Requires you to link your W&B account before tracking the run. This prevents unintentional creation of anonymous runs by ensuring each run is associated with an account. - `"allow"`: Enables a logged-in user to track runs with their account, but also allows someone running the script without a W&B account to view the charts and data in the UI. - `"must"`: Forces the run to be logged to an anonymous account, even if the user is logged in. |
| `reinit` | Shorthand for the "reinit" setting. Determines the behavior of `wandb.init()` when a run is active. |
| `resume` | Controls the behavior when resuming a run with the specified `id`. Available options are: - `"allow"`: If a run with the specified `id` exists, it will resume from the last step; otherwise, a new run will be created. - `"never"`: If a run with the specified `id` exists, an error will be raised. If no such run is found, a new run will be created. - `"must"`: If a run with the specified `id` exists, it will resume from the last step. If no run is found, an error will be raised. - `"auto"`: Automatically resumes the previous run if it crashed on this machine; otherwise, starts a new run. - `True`: Deprecated. Use `"auto"` instead. - `False`: Deprecated. Use the default behavior (leaving `resume` unset) to always start a new run. Note: If `resume` is set, `fork_from` and `resume_from` cannot be used. When `resume` is unset, the system will always start a new run. For more details, see our [guide to resuming runs](https://docs.wandb.com/guides/runs/resuming). |
| `resume_from` | Specifies a moment in a previous run to resume a run from, using the format `{run_id}?_step={step}`. This allows users to truncate the history logged to a run at an intermediate step and resume logging from that step. The target run must be in the same project. If an `id` argument is also provided, the `resume_from` argument will take precedence. `resume`, `resume_from` and `fork_from` cannot be used together, only one of them can be used at a time. Note: This feature is in beta and may change in the future. |
| `fork_from` | Specifies a point in a previous run from which to fork a new run, using the format `{id}?_step={step}`. This creates a new run that resumes logging from the specified step in the target run’s history. The target run must be part of the current project. If an `id` argument is also provided, it must be different from the `fork_from` argument, an error will be raised if they are the same. `resume`, `resume_from` and `fork_from` cannot be used together, only one of them can be used at a time. Note: This feature is in beta and may change in the future. |
| `save_code` | Enables saving the main script or notebook to W&B, aiding in experiment reproducibility and allowing code comparisons across runs in the UI. By default, this is disabled, but you can change the default to enable on your [settings page](https://wandb.ai/settings). |
| `tensorboard` | Deprecated. Use `sync_tensorboard` instead. |
| `sync_tensorboard` | Enables automatic syncing of W&B logs from TensorBoard or TensorBoardX, saving relevant event files for viewing in the W&B UI. saving relevant event files for viewing in the W&B UI. (Default: `False`) |
| `monitor_gym` | Enables automatic logging of videos of the environment when using OpenAI Gym. For additional details, see our [guide for gym integration](https://docs.wandb.com/guides/integrations/openai-gym). |
| `settings` | Specifies a dictionary or `wandb.Settings` object with advanced settings for the run. |
| Returns | |
| :--- | :--- |
| A `Run` object, which is a handle to the current run. Use this object to perform operations like logging data, saving files, and finishing the run. See the [Run API](https://docs.wandb.ai/ref/python/run) for more details. |
| Raises | |
| :--- | :--- |
| `Error` | If some unknown or internal error happened during the run initialization. |
| `AuthenticationError` | If the user failed to provide valid credentials. |
| `CommError` | If there was a problem communicating with the W&B server. |
| `UsageError` | If the user provided invalid arguments to the function. |
| `KeyboardInterrupt` | If the user interrupts the run initialization process. If the user interrupts the run initialization process. |
# Integrations
## Modules
[`keras`](./keras) module: Tools for integrating `wandb` with [`Keras`](https://keras.io/).
# log
{{< cta-button githubLink=https://www.github.com/wandb/wandb/tree/v0.20.1/wandb/sdk/wandb_run.py#L1731-L1982 >}}
Upload run data.
```python
log(
data: dict[str, Any],
step: (int | None) = None,
commit: (bool | None) = None
) -> None
```
Use `log` to log data from runs, such as scalars, images, video,
histograms, plots, and tables.
See our [guides to logging](https://docs.wandb.ai/guides/track/log) for
live examples, code snippets, best practices, and more.
The most basic usage is `run.log({"train-loss": 0.5, "accuracy": 0.9})`.
This will save the loss and accuracy to the run's history and update
the summary values for these metrics.
Visualize logged data in the workspace at [wandb.ai](https://wandb.ai),
or locally on a [self-hosted instance](https://docs.wandb.ai/guides/hosting)
of the W&B app, or export data to visualize and explore locally, e.g. in
Jupyter notebooks, with [our API](https://docs.wandb.ai/guides/track/public-api-guide).
Logged values don't have to be scalars. Logging any wandb object is supported.
For example `run.log({"example": wandb.Image("myimage.jpg")})` will log an
example image which will be displayed nicely in the W&B UI.
See the [reference documentation](https://docs.wandb.com/ref/python/data-types)
for all of the different supported types or check out our
[guides to logging](https://docs.wandb.ai/guides/track/log) for examples,
from 3D molecular structures and segmentation masks to PR curves and histograms.
You can use `wandb.Table` to log structured data. See our
[guide to logging tables](https://docs.wandb.ai/guides/models/tables/tables-walkthrough)
for details.
The W&B UI organizes metrics with a forward slash (`/`) in their name
into sections named using the text before the final slash. For example,
the following results in two sections named "train" and "validate":
```
run.log(
{
"train/accuracy": 0.9,
"train/loss": 30,
"validate/accuracy": 0.8,
"validate/loss": 20,
}
)
```
Only one level of nesting is supported; `run.log({"a/b/c": 1})`
produces a section named "a/b".
`run.log` is not intended to be called more than a few times per second.
For optimal performance, limit your logging to once every N iterations,
or collect data over multiple iterations and log it in a single step.
### The W&B step
With basic usage, each call to `log` creates a new "step".
The step must always increase, and it is not possible to log
to a previous step.
Note that you can use any metric as the X axis in charts.
In many cases, it is better to treat the W&B step like
you'd treat a timestamp rather than a training step.
```
# Example: log an "epoch" metric for use as an X axis.
run.log({"epoch": 40, "train-loss": 0.5})
```
See also [define_metric](https://docs.wandb.ai/ref/python/run#define_metric).
It is possible to use multiple `log` invocations to log to
the same step with the `step` and `commit` parameters.
The following are all equivalent:
```
# Normal usage:
run.log({"train-loss": 0.5, "accuracy": 0.8})
run.log({"train-loss": 0.4, "accuracy": 0.9})
# Implicit step without auto-incrementing:
run.log({"train-loss": 0.5}, commit=False)
run.log({"accuracy": 0.8})
run.log({"train-loss": 0.4}, commit=False)
run.log({"accuracy": 0.9})
# Explicit step:
run.log({"train-loss": 0.5}, step=current_step)
run.log({"accuracy": 0.8}, step=current_step)
current_step += 1
run.log({"train-loss": 0.4}, step=current_step)
run.log({"accuracy": 0.9}, step=current_step)
```
| Args | |
| :--- | :--- |
| `data` | A `dict` with `str` keys and values that are serializable Python objects including: `int`, `float` and `string`; any of the `wandb.data_types`; lists, tuples and NumPy arrays of serializable Python objects; other `dict`s of this structure. |
| `step` | The step number to log. If `None`, then an implicit auto-incrementing step is used. See the notes in the description. |
| `commit` | If true, finalize and upload the step. If false, then accumulate data for the step. See the notes in the description. If `step` is `None`, then the default is `commit=True`; otherwise, the default is `commit=False`. |
#### Examples:
For more and more detailed examples, see
[our guides to logging](https://docs.wandb.com/guides/track/log).
### Basic usage
```python
import wandb
run = wandb.init()
run.log({"accuracy": 0.9, "epoch": 5})
```
### Incremental logging
```python
import wandb
run = wandb.init()
run.log({"loss": 0.2}, commit=False)
# Somewhere else when I'm ready to report this step:
run.log({"accuracy": 0.8})
```
### Histogram
```python
import numpy as np
import wandb
# sample gradients at random from normal distribution
gradients = np.random.randn(100, 100)
run = wandb.init()
run.log({"gradients": wandb.Histogram(gradients)})
```
### Image from numpy
```python
import numpy as np
import wandb
run = wandb.init()
examples = []
for i in range(3):
pixels = np.random.randint(low=0, high=256, size=(100, 100, 3))
image = wandb.Image(pixels, caption=f"random field {i}")
examples.append(image)
run.log({"examples": examples})
```
### Image from PIL
```python
import numpy as np
from PIL import Image as PILImage
import wandb
run = wandb.init()
examples = []
for i in range(3):
pixels = np.random.randint(
low=0,
high=256,
size=(100, 100, 3),
dtype=np.uint8,
)
pil_image = PILImage.fromarray(pixels, mode="RGB")
image = wandb.Image(pil_image, caption=f"random field {i}")
examples.append(image)
run.log({"examples": examples})
```
### Video from numpy
```python
import numpy as np
import wandb
run = wandb.init()
# axes are (time, channel, height, width)
frames = np.random.randint(
low=0,
high=256,
size=(10, 3, 100, 100),
dtype=np.uint8,
)
run.log({"video": wandb.Video(frames, fps=4)})
```
### Matplotlib Plot
```python
from matplotlib import pyplot as plt
import numpy as np
import wandb
run = wandb.init()
fig, ax = plt.subplots()
x = np.linspace(0, 10)
y = x * x
ax.plot(x, y) # plot y = x^2
run.log({"chart": fig})
```
### PR Curve
```python
import wandb
run = wandb.init()
run.log({"pr": wandb.plot.pr_curve(y_test, y_probas, labels)})
```
### 3D Object
```python
import wandb
run = wandb.init()
run.log(
{
"generated_samples": [
wandb.Object3D(open("sample.obj")),
wandb.Object3D(open("sample.gltf")),
wandb.Object3D(open("sample.glb")),
]
}
)
```
| Raises | |
| :--- | :--- |
| `wandb.Error` | if called before `wandb.init` |
| `ValueError` | if invalid data is passed |
# login
{{< cta-button githubLink=https://www.github.com/wandb/wandb/tree/v0.20.1/wandb/sdk/wandb_login.py#L41-L88 >}}
Set up W&B login credentials.
```python
login(
anonymous: Optional[Literal['must', 'allow', 'never']] = None,
key: Optional[str] = None,
relogin: Optional[bool] = None,
host: Optional[str] = None,
force: Optional[bool] = None,
timeout: Optional[int] = None,
verify: bool = (False),
referrer: Optional[str] = None
) -> bool
```
By default, this will only store credentials locally without
verifying them with the W&B server. To verify credentials, pass
`verify=True`.
| Args | |
| :--- | :--- |
| `anonymous` | (string, optional) Can be "must", "allow", or "never". If set to "must", always log a user in anonymously. If set to "allow", only create an anonymous user if the user isn't already logged in. If set to "never", never log a user anonymously. Default set to "never". |
| `key` | (string, optional) The API key to use. |
| `relogin` | (bool, optional) If true, will re-prompt for API key. |
| `host` | (string, optional) The host to connect to. |
| `force` | (bool, optional) If true, will force a relogin. |
| `timeout` | (int, optional) Number of seconds to wait for user input. |
| `verify` | (bool) Verify the credentials with the W&B server. |
| `referrer` | (string, optional) The referrer to use in the URL login request. |
| Returns | |
| :--- | :--- |
| `bool` | if key is configured |
| Raises | |
| :--- | :--- |
| AuthenticationError - if api_key fails verification with the server UsageError - if api_key cannot be configured and no tty |
# Run
{{< cta-button githubLink=https://www.github.com/wandb/wandb/tree/v0.20.1/wandb/sdk/wandb_run.py#L469-L4086 >}}
A unit of computation logged by wandb. Typically, this is an ML experiment.
```python
Run(
settings: Settings,
config: (dict[str, Any] | None) = None,
sweep_config: (dict[str, Any] | None) = None,
launch_config: (dict[str, Any] | None) = None
) -> None
```
Create a run with `wandb.init()`:
```python
import wandb
run = wandb.init()
```
There is only ever at most one active `wandb.Run` in any process,
and it is accessible as `wandb.run`:
```python
import wandb
assert wandb.run is None
wandb.init()
assert wandb.run is not None
```
anything you log with `wandb.log` will be sent to that run.
If you want to start more runs in the same script or notebook, you'll need to
finish the run that is in-flight. Runs can be finished with `wandb.finish` or
by using them in a `with` block:
```python
import wandb
wandb.init()
wandb.finish()
assert wandb.run is None
with wandb.init() as run:
pass # log data here
assert wandb.run is None
```
See the documentation for `wandb.init` for more on creating runs, or check out
[our guide to `wandb.init`](https://docs.wandb.ai/guides/track/launch).
In distributed training, you can either create a single run in the rank 0 process
and then log information only from that process, or you can create a run in each process,
logging from each separately, and group the results together with the `group` argument
to `wandb.init`. For more details on distributed training with W&B, check out
[our guide](https://docs.wandb.ai/guides/track/log/distributed-training).
Currently, there is a parallel `Run` object in the `wandb.Api`. Eventually these
two objects will be merged.
| Attributes | |
| :--- | :--- |
| `summary` | (Summary) Single values set for each `wandb.log()` key. By default, summary is set to the last value logged. You can manually set summary to the best value, like max accuracy, instead of the final value. |
| `config` | Config object associated with this run. |
| `dir` | The directory where files associated with the run are saved. |
| `entity` | The name of the W&B entity associated with the run. Entity can be a username or the name of a team or organization. |
| `group` | Name of the group associated with the run. Setting a group helps the W&B UI organize runs in a sensible way. If you are doing a distributed training you should give all of the runs in the training the same group. If you are doing cross-validation you should give all the cross-validation folds the same group. |
| `id` | Identifier for this run. |
| `name` | Display name of the run. Display names are not guaranteed to be unique and may be descriptive. By default, they are randomly generated. |
| `notes` | Notes associated with the run, if there are any. Notes can be a multiline string and can also use markdown and latex equations inside `$$`, like `$x + 3$`. |
| `path` | Path to the run. Run paths include entity, project, and run ID, in the format `entity/project/run_id`. |
| `project` | Name of the W&B project associated with the run. |
| `project_url` | URL of the W&B project associated with the run, if there is one. Offline runs do not have a project URL. |
| `resumed` | True if the run was resumed, False otherwise. |
| `settings` | A frozen copy of run's Settings object. |
| `start_time` | Unix timestamp (in seconds) of when the run started. |
| `starting_step` | The first step of the run. |
| `step` | Current value of the step. This counter is incremented by `wandb.log`. |
| `sweep_id` | Identifier for the sweep associated with the run, if there is one. |
| `sweep_url` | URL of the sweep associated with the run, if there is one. Offline runs do not have a sweep URL. |
| `tags` | Tags associated with the run, if there are any. |
| `url` | The url for the W&B run, if there is one. Offline runs will not have a url. |
## Methods
### `alert`
[View source](https://www.github.com/wandb/wandb/tree/v0.20.1/wandb/sdk/wandb_run.py#L3628-L3662)
```python
alert(
title: str,
text: str,
level: (str | AlertLevel | None) = None,
wait_duration: (int | float | timedelta | None) = None
) -> None
```
Launch an alert with the given title and text.
| Args | |
| :--- | :--- |
| `title` | (str) The title of the alert, must be less than 64 characters long. |
| `text` | (str) The text body of the alert. |
| `level` | (str or AlertLevel, optional) The alert level to use, either: `INFO`, `WARN`, or `ERROR`. |
| `wait_duration` | (int, float, or timedelta, optional) The time to wait (in seconds) before sending another alert with this title. |
### `define_metric`
[View source](https://www.github.com/wandb/wandb/tree/v0.20.1/wandb/sdk/wandb_run.py#L2732-L2794)
```python
define_metric(
name: str,
step_metric: (str | wandb_metric.Metric | None) = None,
step_sync: (bool | None) = None,
hidden: (bool | None) = None,
summary: (str | None) = None,
goal: (str | None) = None,
overwrite: (bool | None) = None
) -> wandb_metric.Metric
```
Customize metrics logged with `wandb.log()`.
| Args | |
| :--- | :--- |
| `name` | The name of the metric to customize. |
| `step_metric` | The name of another metric to serve as the X-axis for this metric in automatically generated charts. |
| `step_sync` | Automatically insert the last value of step_metric into `run.log()` if it is not provided explicitly. Defaults to True if step_metric is specified. |
| `hidden` | Hide this metric from automatic plots. |
| `summary` | Specify aggregate metrics added to summary. Supported aggregations include "min", "max", "mean", "last", "best", "copy" and "none". "best" is used together with the goal parameter. "none" prevents a summary from being generated. "copy" is deprecated and should not be used. |
| `goal` | Specify how to interpret the "best" summary type. Supported options are "minimize" and "maximize". |
| `overwrite` | If false, then this call is merged with previous `define_metric` calls for the same metric by using their values for any unspecified parameters. If true, then unspecified parameters overwrite values specified by previous calls. |
| Returns | |
| :--- | :--- |
| An object that represents this call but can otherwise be discarded. |
### `detach`
[View source](https://www.github.com/wandb/wandb/tree/v0.20.1/wandb/sdk/wandb_run.py#L2925-L2926)
```python
detach() -> None
```
### `display`
[View source](https://www.github.com/wandb/wandb/tree/v0.20.1/wandb/sdk/wandb_run.py#L1314-L1331)
```python
display(
height: int = 420,
hidden: bool = (False)
) -> bool
```
Display this run in jupyter.
### `finish`
[View source](https://www.github.com/wandb/wandb/tree/v0.20.1/wandb/sdk/wandb_run.py#L2175-L2207)
```python
finish(
exit_code: (int | None) = None,
quiet: (bool | None) = None
) -> None
```
Finish a run and upload any remaining data.
Marks the completion of a W&B run and ensures all data is synced to the server.
The run's final state is determined by its exit conditions and sync status.
#### Run States:
- Running: Active run that is logging data and/or sending heartbeats.
- Crashed: Run that stopped sending heartbeats unexpectedly.
- Finished: Run completed successfully (`exit_code=0`) with all data synced.
- Failed: Run completed with errors (`exit_code!=0`).
| Args | |
| :--- | :--- |
| `exit_code` | Integer indicating the run's exit status. Use 0 for success, any other value marks the run as failed. |
| `quiet` | Deprecated. Configure logging verbosity using `wandb.Settings(quiet=...)`. |
### `finish_artifact`
[View source](https://www.github.com/wandb/wandb/tree/v0.20.1/wandb/sdk/wandb_run.py#L3208-L3261)
```python
finish_artifact(
artifact_or_path: (Artifact | str),
name: (str | None) = None,
type: (str | None) = None,
aliases: (list[str] | None) = None,
distributed_id: (str | None) = None
) -> Artifact
```
Finishes a non-finalized artifact as output of a run.
Subsequent "upserts" with the same distributed ID will result in a new version.
| Args | |
| :--- | :--- |
| `artifact_or_path` | (str or Artifact) A path to the contents of this artifact, can be in the following forms: - `/local/directory` - `/local/directory/file.txt` - `s3://bucket/path` You can also pass an Artifact object created by calling `wandb.Artifact`. |
| `name` | (str, optional) An artifact name. May be prefixed with entity/project. Valid names can be in the following forms: - name:version - name:alias - digest This will default to the basename of the path prepended with the current run id if not specified. |
| `type` | (str) The type of artifact to log, examples include `dataset`, `model` |
| `aliases` | (list, optional) Aliases to apply to this artifact, defaults to `["latest"]` |
| `distributed_id` | (string, optional) Unique string that all distributed jobs share. If None, defaults to the run's group name. |
| Returns | |
| :--- | :--- |
| An `Artifact` object. |
### `get_project_url`
[View source](https://www.github.com/wandb/wandb/tree/v0.20.1/wandb/sdk/wandb_run.py#L1031-L1047)
```python
get_project_url() -> (str | None)
```
URL of the W&B project associated with the run, if there is one.
Offline runs do not have a project URL.
Note: this method is deprecated and will be removed in a future release.
Please use `run.project_url` instead.
### `get_sweep_url`
[View source](https://www.github.com/wandb/wandb/tree/v0.20.1/wandb/sdk/wandb_run.py#L1157-L1173)
```python
get_sweep_url() -> (str | None)
```
The URL of the sweep associated with the run, if there is one.
Offline runs do not have a sweep URL.
Note: this method is deprecated and will be removed in a future release.
Please use `run.sweep_url` instead.
### `get_url`
[View source](https://www.github.com/wandb/wandb/tree/v0.20.1/wandb/sdk/wandb_run.py#L1187-L1203)
```python
get_url() -> (str | None)
```
URL of the W&B run, if there is one.
Offline runs do not have a URL.
Note: this method is deprecated and will be removed in a future release.
Please use `run.url` instead.
### `link_artifact`
[View source](https://www.github.com/wandb/wandb/tree/v0.20.1/wandb/sdk/wandb_run.py#L2928-L3012)
```python
link_artifact(
artifact: Artifact,
target_path: str,
aliases: (list[str] | None) = None
) -> (Artifact | None)
```
Link the given artifact to a portfolio (a promoted collection of artifacts).
The linked artifact will be visible in the UI for the specified portfolio.
| Args | |
| :--- | :--- |
| `artifact` | the (public or local) artifact which will be linked |
| `target_path` | `str` - takes the following forms: `{portfolio}`, `{project}/{portfolio}`, or `{entity}/{project}/{portfolio}` |
| `aliases` | `List[str]` - optional alias(es) that will only be applied on this linked artifact inside the portfolio. The alias "latest" will always be applied to the latest version of an artifact that is linked. |
| Returns | |
| :--- | :--- |
| The linked artifact if linking was successful, otherwise None. |
### `link_model`
[View source](https://www.github.com/wandb/wandb/tree/v0.20.1/wandb/sdk/wandb_run.py#L3524-L3626)
```python
link_model(
path: StrPath,
registered_model_name: str,
name: (str | None) = None,
aliases: (list[str] | None) = None
) -> (Artifact | None)
```
Log a model artifact version and link it to a registered model in the model registry.
The linked model version will be visible in the UI for the specified registered model.
#### Steps:
- Check if 'name' model artifact has been logged. If so, use the artifact version that matches the files
located at 'path' or log a new version. Otherwise log files under 'path' as a new model artifact, 'name'
of type 'model'.
- Check if registered model with name 'registered_model_name' exists in the 'model-registry' project.
If not, create a new registered model with name 'registered_model_name'.
- Link version of model artifact 'name' to registered model, 'registered_model_name'.
- Attach aliases from 'aliases' list to the newly linked model artifact version.
| Args | |
| :--- | :--- |
| `path` | (str) A path to the contents of this model, can be in the following forms: - `/local/directory` - `/local/directory/file.txt` - `s3://bucket/path` |
| `registered_model_name` | (str) - the name of the registered model that the model is to be linked to. A registered model is a collection of model versions linked to the model registry, typically representing a team's specific ML Task. The entity that this registered model belongs to will be derived from the run |
| `name` | (str, optional) - the name of the model artifact that files in 'path' will be logged to. This will default to the basename of the path prepended with the current run id if not specified. |
| `aliases` | (List[str], optional) - alias(es) that will only be applied on this linked artifact inside the registered model. The alias "latest" will always be applied to the latest version of an artifact that is linked. |
#### Examples:
```python
run.link_model(
path="/local/directory",
registered_model_name="my_reg_model",
name="my_model_artifact",
aliases=["production"],
)
```
Invalid usage
```python
run.link_model(
path="/local/directory",
registered_model_name="my_entity/my_project/my_reg_model",
name="my_model_artifact",
aliases=["production"],
)
run.link_model(
path="/local/directory",
registered_model_name="my_reg_model",
name="my_entity/my_project/my_model_artifact",
aliases=["production"],
)
```
| Raises | |
| :--- | :--- |
| `AssertionError` | if registered_model_name is a path or if model artifact 'name' is of a type that does not contain the substring 'model' |
| `ValueError` | if name has invalid special characters |
| Returns | |
| :--- | :--- |
| The linked artifact if linking was successful, otherwise None. |
### `log`
[View source](https://www.github.com/wandb/wandb/tree/v0.20.1/wandb/sdk/wandb_run.py#L1731-L1982)
```python
log(
data: dict[str, Any],
step: (int | None) = None,
commit: (bool | None) = None
) -> None
```
Upload run data.
Use `log` to log data from runs, such as scalars, images, video,
histograms, plots, and tables.
See our [guides to logging](https://docs.wandb.ai/guides/track/log) for
live examples, code snippets, best practices, and more.
The most basic usage is `run.log({"train-loss": 0.5, "accuracy": 0.9})`.
This will save the loss and accuracy to the run's history and update
the summary values for these metrics.
Visualize logged data in the workspace at [wandb.ai](https://wandb.ai),
or locally on a [self-hosted instance](https://docs.wandb.ai/guides/hosting)
of the W&B app, or export data to visualize and explore locally, e.g. in
Jupyter notebooks, with [our API](https://docs.wandb.ai/guides/track/public-api-guide).
Logged values don't have to be scalars. Logging any wandb object is supported.
For example `run.log({"example": wandb.Image("myimage.jpg")})` will log an
example image which will be displayed nicely in the W&B UI.
See the [reference documentation](https://docs.wandb.com/ref/python/data-types)
for all of the different supported types or check out our
[guides to logging](https://docs.wandb.ai/guides/track/log) for examples,
from 3D molecular structures and segmentation masks to PR curves and histograms.
You can use `wandb.Table` to log structured data. See our
[guide to logging tables](https://docs.wandb.ai/guides/models/tables/tables-walkthrough)
for details.
The W&B UI organizes metrics with a forward slash (`/`) in their name
into sections named using the text before the final slash. For example,
the following results in two sections named "train" and "validate":
```
run.log(
{
"train/accuracy": 0.9,
"train/loss": 30,
"validate/accuracy": 0.8,
"validate/loss": 20,
}
)
```
Only one level of nesting is supported; `run.log({"a/b/c": 1})`
produces a section named "a/b".
`run.log` is not intended to be called more than a few times per second.
For optimal performance, limit your logging to once every N iterations,
or collect data over multiple iterations and log it in a single step.
### The W&B step
With basic usage, each call to `log` creates a new "step".
The step must always increase, and it is not possible to log
to a previous step.
Note that you can use any metric as the X axis in charts.
In many cases, it is better to treat the W&B step like
you'd treat a timestamp rather than a training step.
```
# Example: log an "epoch" metric for use as an X axis.
run.log({"epoch": 40, "train-loss": 0.5})
```
See also [define_metric](https://docs.wandb.ai/ref/python/run#define_metric).
It is possible to use multiple `log` invocations to log to
the same step with the `step` and `commit` parameters.
The following are all equivalent:
```
# Normal usage:
run.log({"train-loss": 0.5, "accuracy": 0.8})
run.log({"train-loss": 0.4, "accuracy": 0.9})
# Implicit step without auto-incrementing:
run.log({"train-loss": 0.5}, commit=False)
run.log({"accuracy": 0.8})
run.log({"train-loss": 0.4}, commit=False)
run.log({"accuracy": 0.9})
# Explicit step:
run.log({"train-loss": 0.5}, step=current_step)
run.log({"accuracy": 0.8}, step=current_step)
current_step += 1
run.log({"train-loss": 0.4}, step=current_step)
run.log({"accuracy": 0.9}, step=current_step)
```
| Args | |
| :--- | :--- |
| `data` | A `dict` with `str` keys and values that are serializable Python objects including: `int`, `float` and `string`; any of the `wandb.data_types`; lists, tuples and NumPy arrays of serializable Python objects; other `dict`s of this structure. |
| `step` | The step number to log. If `None`, then an implicit auto-incrementing step is used. See the notes in the description. |
| `commit` | If true, finalize and upload the step. If false, then accumulate data for the step. See the notes in the description. If `step` is `None`, then the default is `commit=True`; otherwise, the default is `commit=False`. |
#### Examples:
For more and more detailed examples, see
[our guides to logging](https://docs.wandb.com/guides/track/log).
### Basic usage
```python
import wandb
run = wandb.init()
run.log({"accuracy": 0.9, "epoch": 5})
```
### Incremental logging
```python
import wandb
run = wandb.init()
run.log({"loss": 0.2}, commit=False)
# Somewhere else when I'm ready to report this step:
run.log({"accuracy": 0.8})
```
### Histogram
```python
import numpy as np
import wandb
# sample gradients at random from normal distribution
gradients = np.random.randn(100, 100)
run = wandb.init()
run.log({"gradients": wandb.Histogram(gradients)})
```
### Image from numpy
```python
import numpy as np
import wandb
run = wandb.init()
examples = []
for i in range(3):
pixels = np.random.randint(low=0, high=256, size=(100, 100, 3))
image = wandb.Image(pixels, caption=f"random field {i}")
examples.append(image)
run.log({"examples": examples})
```
### Image from PIL
```python
import numpy as np
from PIL import Image as PILImage
import wandb
run = wandb.init()
examples = []
for i in range(3):
pixels = np.random.randint(
low=0,
high=256,
size=(100, 100, 3),
dtype=np.uint8,
)
pil_image = PILImage.fromarray(pixels, mode="RGB")
image = wandb.Image(pil_image, caption=f"random field {i}")
examples.append(image)
run.log({"examples": examples})
```
### Video from numpy
```python
import numpy as np
import wandb
run = wandb.init()
# axes are (time, channel, height, width)
frames = np.random.randint(
low=0,
high=256,
size=(10, 3, 100, 100),
dtype=np.uint8,
)
run.log({"video": wandb.Video(frames, fps=4)})
```
### Matplotlib Plot
```python
from matplotlib import pyplot as plt
import numpy as np
import wandb
run = wandb.init()
fig, ax = plt.subplots()
x = np.linspace(0, 10)
y = x * x
ax.plot(x, y) # plot y = x^2
run.log({"chart": fig})
```
### PR Curve
```python
import wandb
run = wandb.init()
run.log({"pr": wandb.plot.pr_curve(y_test, y_probas, labels)})
```
### 3D Object
```python
import wandb
run = wandb.init()
run.log(
{
"generated_samples": [
wandb.Object3D(open("sample.obj")),
wandb.Object3D(open("sample.gltf")),
wandb.Object3D(open("sample.glb")),
]
}
)
```
| Raises | |
| :--- | :--- |
| `wandb.Error` | if called before `wandb.init` |
| `ValueError` | if invalid data is passed |
### `log_artifact`
[View source](https://www.github.com/wandb/wandb/tree/v0.20.1/wandb/sdk/wandb_run.py#L3110-L3151)
```python
log_artifact(
artifact_or_path: (Artifact | StrPath),
name: (str | None) = None,
type: (str | None) = None,
aliases: (list[str] | None) = None,
tags: (list[str] | None) = None
) -> Artifact
```
Declare an artifact as an output of a run.
| Args | |
| :--- | :--- |
| `artifact_or_path` | (str or Artifact) A path to the contents of this artifact, can be in the following forms: - `/local/directory` - `/local/directory/file.txt` - `s3://bucket/path` You can also pass an Artifact object created by calling `wandb.Artifact`. |
| `name` | (str, optional) An artifact name. Valid names can be in the following forms: - name:version - name:alias - digest This will default to the basename of the path prepended with the current run id if not specified. |
| `type` | (str) The type of artifact to log, examples include `dataset`, `model` |
| `aliases` | (list, optional) Aliases to apply to this artifact, defaults to `["latest"]` |
| `tags` | (list, optional) Tags to apply to this artifact, if any. |
| Returns | |
| :--- | :--- |
| An `Artifact` object. |
### `log_code`
[View source](https://www.github.com/wandb/wandb/tree/v0.20.1/wandb/sdk/wandb_run.py#L1062-L1155)
```python
log_code(
root: (str | None) = ".",
name: (str | None) = None,
include_fn: (Callable[[str, str], bool] | Callable[[str], bool]) = _is_py_requirements_or_dockerfile,
exclude_fn: (Callable[[str, str], bool] | Callable[[str], bool]) = filenames.exclude_wandb_fn
) -> (Artifact | None)
```
Save the current state of your code to a W&B Artifact.
By default, it walks the current directory and logs all files that end with `.py`.
| Args | |
| :--- | :--- |
| `root` | The relative (to `os.getcwd()`) or absolute path to recursively find code from. |
| `name` | (str, optional) The name of our code artifact. By default, we'll name the artifact `source-$PROJECT_ID-$ENTRYPOINT_RELPATH`. There may be scenarios where you want many runs to share the same artifact. Specifying name allows you to achieve that. |
| `include_fn` | A callable that accepts a file path and (optionally) root path and returns True when it should be included and False otherwise. This defaults to: `lambda path, root: path.endswith(".py")` |
| `exclude_fn` | A callable that accepts a file path and (optionally) root path and returns `True` when it should be excluded and `False` otherwise. This defaults to a function that excludes all files within `/.wandb/` and `/wandb/` directories. |
#### Examples:
Basic usage
```python
run.log_code()
```
Advanced usage
```python
run.log_code(
"../",
include_fn=lambda path: path.endswith(".py") or path.endswith(".ipynb"),
exclude_fn=lambda path, root: os.path.relpath(path, root).startswith(
"cache/"
),
)
```
| Returns | |
| :--- | :--- |
| An `Artifact` object if code was logged |
### `log_model`
[View source](https://www.github.com/wandb/wandb/tree/v0.20.1/wandb/sdk/wandb_run.py#L3410-L3460)
```python
log_model(
path: StrPath,
name: (str | None) = None,
aliases: (list[str] | None) = None
) -> None
```
Logs a model artifact containing the contents inside the 'path' to a run and marks it as an output to this run.
| Args | |
| :--- | :--- |
| `path` | (str) A path to the contents of this model, can be in the following forms: - `/local/directory` - `/local/directory/file.txt` - `s3://bucket/path` |
| `name` | (str, optional) A name to assign to the model artifact that the file contents will be added to. The string must contain only the following alphanumeric characters: dashes, underscores, and dots. This will default to the basename of the path prepended with the current run id if not specified. |
| `aliases` | (list, optional) Aliases to apply to the created model artifact, defaults to `["latest"]` |
#### Examples:
```python
run.log_model(
path="/local/directory",
name="my_model_artifact",
aliases=["production"],
)
```
Invalid usage
```python
run.log_model(
path="/local/directory",
name="my_entity/my_project/my_model_artifact",
aliases=["production"],
)
```
| Raises | |
| :--- | :--- |
| `ValueError` | if name has invalid special characters |
| Returns | |
| :--- | :--- |
| None |
### `mark_preempting`
[View source](https://www.github.com/wandb/wandb/tree/v0.20.1/wandb/sdk/wandb_run.py#L3680-L3689)
```python
mark_preempting() -> None
```
Mark this run as preempting.
Also tells the internal process to immediately report this to server.
### `project_name`
[View source](https://www.github.com/wandb/wandb/tree/v0.20.1/wandb/sdk/wandb_run.py#L1008-L1021)
```python
project_name() -> str
```
Name of the W&B project associated with the run.
Note: this method is deprecated and will be removed in a future release.
Please use `run.project` instead.
### `restore`
[View source](https://www.github.com/wandb/wandb/tree/v0.20.1/wandb/sdk/wandb_run.py#L2159-L2173)
```python
restore(
name: str,
run_path: (str | None) = None,
replace: bool = (False),
root: (str | None) = None
) -> (None | TextIO)
```
Download the specified file from cloud storage.
File is placed into the current directory or run directory.
By default, will only download the file if it doesn't already exist.
| Args | |
| :--- | :--- |
| `name` | the name of the file |
| `run_path` | optional path to a run to pull files from, i.e. `username/project_name/run_id` if wandb.init has not been called, this is required. |
| `replace` | whether to download the file even if it already exists locally |
| `root` | the directory to download the file to. Defaults to the current directory or the run directory if wandb.init was called. |
| Returns | |
| :--- | :--- |
| None if it can't find the file, otherwise a file object open for reading |
| Raises | |
| :--- | :--- |
| `wandb.CommError` | if we can't connect to the wandb backend |
| `ValueError` | if the file is not found or can't find run_path |
### `save`
[View source](https://www.github.com/wandb/wandb/tree/v0.20.1/wandb/sdk/wandb_run.py#L1984-L2078)
```python
save(
glob_str: (str | os.PathLike),
base_path: (str | os.PathLike | None) = None,
policy: PolicyName = "live"
) -> (bool | list[str])
```
Sync one or more files to W&B.
Relative paths are relative to the current working directory.
A Unix glob, such as "myfiles/*", is expanded at the time `save` is
called regardless of the `policy`. In particular, new files are not
picked up automatically.
A `base_path` may be provided to control the directory structure of
uploaded files. It should be a prefix of `glob_str`, and the directory
structure beneath it is preserved. It's best understood through
examples:
```
wandb.save("these/are/myfiles/*")
# => Saves files in a "these/are/myfiles/" folder in the run.
wandb.save("these/are/myfiles/*", base_path="these")
# => Saves files in an "are/myfiles/" folder in the run.
wandb.save("/User/username/Documents/run123/*.txt")
# => Saves files in a "run123/" folder in the run. See note below.
wandb.save("/User/username/Documents/run123/*.txt", base_path="/User")
# => Saves files in a "username/Documents/run123/" folder in the run.
wandb.save("files/*/saveme.txt")
# => Saves each "saveme.txt" file in an appropriate subdirectory
# of "files/".
```
Note: when given an absolute path or glob and no `base_path`, one
directory level is preserved as in the example above.
| Args | |
| :--- | :--- |
| `glob_str` | A relative or absolute path or Unix glob. |
| `base_path` | A path to use to infer a directory structure; see examples. |
| `policy` | One of `live`, `now`, or `end`. * live: upload the file as it changes, overwriting the previous version * now: upload the file once now * end: upload file when the run ends |
| Returns | |
| :--- | :--- |
| Paths to the symlinks created for the matched files. For historical reasons, this may return a boolean in legacy code. |
### `status`
[View source](https://www.github.com/wandb/wandb/tree/v0.20.1/wandb/sdk/wandb_run.py#L2256-L2279)
```python
status() -> RunStatus
```
Get sync info from the internal backend, about the current run's sync status.
### `to_html`
[View source](https://www.github.com/wandb/wandb/tree/v0.20.1/wandb/sdk/wandb_run.py#L1333-L1343)
```python
to_html(
height: int = 420,
hidden: bool = (False)
) -> str
```
Generate HTML containing an iframe displaying the current run.
### `unwatch`
[View source](https://www.github.com/wandb/wandb/tree/v0.20.1/wandb/sdk/wandb_run.py#L2912-L2923)
```python
unwatch(
models: (torch.nn.Module | Sequence[torch.nn.Module] | None) = None
) -> None
```
Remove pytorch model topology, gradient and parameter hooks.
| Args | |
| :--- | :--- |
| models (torch.nn.Module | Sequence[torch.nn.Module]): Optional list of pytorch models that have had watch called on them |
### `upsert_artifact`
[View source](https://www.github.com/wandb/wandb/tree/v0.20.1/wandb/sdk/wandb_run.py#L3153-L3206)
```python
upsert_artifact(
artifact_or_path: (Artifact | str),
name: (str | None) = None,
type: (str | None) = None,
aliases: (list[str] | None) = None,
distributed_id: (str | None) = None
) -> Artifact
```
Declare (or append to) a non-finalized artifact as output of a run.
Note that you must call run.finish_artifact() to finalize the artifact.
This is useful when distributed jobs need to all contribute to the same artifact.
| Args | |
| :--- | :--- |
| `artifact_or_path` | (str or Artifact) A path to the contents of this artifact, can be in the following forms: - `/local/directory` - `/local/directory/file.txt` - `s3://bucket/path` You can also pass an Artifact object created by calling `wandb.Artifact`. |
| `name` | (str, optional) An artifact name. May be prefixed with entity/project. Valid names can be in the following forms: - name:version - name:alias - digest This will default to the basename of the path prepended with the current run id if not specified. |
| `type` | (str) The type of artifact to log, examples include `dataset`, `model` |
| `aliases` | (list, optional) Aliases to apply to this artifact, defaults to `["latest"]` |
| `distributed_id` | (string, optional) Unique string that all distributed jobs share. If None, defaults to the run's group name. |
| Returns | |
| :--- | :--- |
| An `Artifact` object. |
### `use_artifact`
[View source](https://www.github.com/wandb/wandb/tree/v0.20.1/wandb/sdk/wandb_run.py#L3014-L3108)
```python
use_artifact(
artifact_or_name: (str | Artifact),
type: (str | None) = None,
aliases: (list[str] | None) = None,
use_as: (str | None) = None
) -> Artifact
```
Declare an artifact as an input to a run.
Call `download` or `file` on the returned object to get the contents locally.
| Args | |
| :--- | :--- |
| `artifact_or_name` | (str or Artifact) An artifact name. May be prefixed with project/ or entity/project/. If no entity is specified in the name, the Run or API setting's entity is used. Valid names can be in the following forms: - name:version - name:alias You can also pass an Artifact object created by calling `wandb.Artifact` |
| `type` | (str, optional) The type of artifact to use. |
| `aliases` | (list, optional) Aliases to apply to this artifact |
| `use_as` | This argument is deprecated and does nothing. |
| Returns | |
| :--- | :--- |
| An `Artifact` object. |
### `use_model`
[View source](https://www.github.com/wandb/wandb/tree/v0.20.1/wandb/sdk/wandb_run.py#L3462-L3522)
```python
use_model(
name: str
) -> FilePathStr
```
Download the files logged in a model artifact 'name'.
| Args | |
| :--- | :--- |
| `name` | (str) A model artifact name. 'name' must match the name of an existing logged model artifact. May be prefixed with entity/project/. Valid names can be in the following forms: - model_artifact_name:version - model_artifact_name:alias |
#### Examples:
```python
run.use_model(
name="my_model_artifact:latest",
)
run.use_model(
name="my_project/my_model_artifact:v0",
)
run.use_model(
name="my_entity/my_project/my_model_artifact:",
)
```
Invalid usage
```python
run.use_model(
name="my_entity/my_project/my_model_artifact",
)
```
| Raises | |
| :--- | :--- |
| `AssertionError` | if model artifact 'name' is of a type that does not contain the substring 'model'. |
| Returns | |
| :--- | :--- |
| `path` | (str) path to downloaded model artifact file(s). |
### `watch`
[View source](https://www.github.com/wandb/wandb/tree/v0.20.1/wandb/sdk/wandb_run.py#L2874-L2910)
```python
watch(
models: (torch.nn.Module | Sequence[torch.nn.Module]),
criterion: (torch.F | None) = None,
log: (Literal['gradients', 'parameters', 'all'] | None) = "gradients",
log_freq: int = 1000,
idx: (int | None) = None,
log_graph: bool = (False)
) -> None
```
Hooks into the given PyTorch model(s) to monitor gradients and the model's computational graph.
This function can track parameters, gradients, or both during training. It should be
extended to support arbitrary machine learning models in the future.
| Args | |
| :--- | :--- |
| models (Union[torch.nn.Module, Sequence[torch.nn.Module]]): A single model or a sequence of models to be monitored. criterion (Optional[torch.F]): The loss function being optimized (optional). log (Optional[Literal["gradients", "parameters", "all"]]): Specifies whether to log "gradients", "parameters", or "all". Set to None to disable logging. (default="gradients") log_freq (int): Frequency (in batches) to log gradients and parameters. (default=1000) idx (Optional[int]): Index used when tracking multiple models with `wandb.watch`. (default=None) log_graph (bool): Whether to log the model's computational graph. (default=False) |
| Raises | |
| :--- | :--- |
| `ValueError` | If `wandb.init` has not been called or if any of the models are not instances of `torch.nn.Module`. |
### `__enter__`
[View source](https://www.github.com/wandb/wandb/tree/v0.20.1/wandb/sdk/wandb_run.py#L3664-L3665)
```python
__enter__() -> Run
```
### `__exit__`
[View source](https://www.github.com/wandb/wandb/tree/v0.20.1/wandb/sdk/wandb_run.py#L3667-L3678)
```python
__exit__(
exc_type: type[BaseException],
exc_val: BaseException,
exc_tb: TracebackType
) -> bool
```
# save
{{< cta-button githubLink=https://www.github.com/wandb/wandb/tree/v0.20.1/wandb/sdk/wandb_run.py#L1984-L2078 >}}
Sync one or more files to W&B.
```python
save(
glob_str: (str | os.PathLike),
base_path: (str | os.PathLike | None) = None,
policy: PolicyName = "live"
) -> (bool | list[str])
```
Relative paths are relative to the current working directory.
A Unix glob, such as "myfiles/*", is expanded at the time `save` is
called regardless of the `policy`. In particular, new files are not
picked up automatically.
A `base_path` may be provided to control the directory structure of
uploaded files. It should be a prefix of `glob_str`, and the directory
structure beneath it is preserved. It's best understood through
examples:
```
wandb.save("these/are/myfiles/*")
# => Saves files in a "these/are/myfiles/" folder in the run.
wandb.save("these/are/myfiles/*", base_path="these")
# => Saves files in an "are/myfiles/" folder in the run.
wandb.save("/User/username/Documents/run123/*.txt")
# => Saves files in a "run123/" folder in the run. See note below.
wandb.save("/User/username/Documents/run123/*.txt", base_path="/User")
# => Saves files in a "username/Documents/run123/" folder in the run.
wandb.save("files/*/saveme.txt")
# => Saves each "saveme.txt" file in an appropriate subdirectory
# of "files/".
```
Note: when given an absolute path or glob and no `base_path`, one
directory level is preserved as in the example above.
| Args | |
| :--- | :--- |
| `glob_str` | A relative or absolute path or Unix glob. |
| `base_path` | A path to use to infer a directory structure; see examples. |
| `policy` | One of `live`, `now`, or `end`. * live: upload the file as it changes, overwriting the previous version * now: upload the file once now * end: upload file when the run ends |
| Returns | |
| :--- | :--- |
| Paths to the symlinks created for the matched files. For historical reasons, this may return a boolean in legacy code. |
# sweep
{{< cta-button githubLink=https://www.github.com/wandb/wandb/tree/v0.20.1/wandb/sdk/wandb_sweep.py#L34-L92 >}}
Initialize a hyperparameter sweep.
```python
sweep(
sweep: Union[dict, Callable],
entity: Optional[str] = None,
project: Optional[str] = None,
prior_runs: Optional[List[str]] = None
) -> str
```
Search for hyperparameters that optimizes a cost function
of a machine learning model by testing various combinations.
Make note the unique identifier, `sweep_id`, that is returned.
At a later step provide the `sweep_id` to a sweep agent.
| Args | |
| :--- | :--- |
| `sweep` | The configuration of a hyperparameter search. (or configuration generator). See [Sweep configuration structure](https://docs.wandb.ai/guides/sweeps/define-sweep-configuration) for information on how to define your sweep. If you provide a callable, ensure that the callable does not take arguments and that it returns a dictionary that conforms to the W&B sweep config spec. |
| `entity` | The username or team name where you want to send W&B runs created by the sweep to. Ensure that the entity you specify already exists. If you don't specify an entity, the run will be sent to your default entity, which is usually your username. |
| `project` | The name of the project where W&B runs created from the sweep are sent to. If the project is not specified, the run is sent to a project labeled 'Uncategorized'. |
| `prior_runs` | The run IDs of existing runs to add to this sweep. |
| Returns | |
| :--- | :--- |
| `sweep_id` | str. A unique identifier for the sweep. |
# wandb_workspaces
{{< cta-button githubLink="https://github.com/wandb/wandb-workspaces/blob/main/wandb_workspaces/" >}}
## Classes
[`class reports`](./reports.md): Python library for programmatically working with W&B Reports API.
[`class workspaces`](./workspaces.md): Python library for programmatically working with W&B Workspace API.
# watch
{{< cta-button githubLink=https://www.github.com/wandb/wandb/tree/v0.20.1/wandb/sdk/wandb_run.py#L2874-L2910 >}}
Hooks into the given PyTorch model(s) to monitor gradients and the model's computational graph.
```python
watch(
models: (torch.nn.Module | Sequence[torch.nn.Module]),
criterion: (torch.F | None) = None,
log: (Literal['gradients', 'parameters', 'all'] | None) = "gradients",
log_freq: int = 1000,
idx: (int | None) = None,
log_graph: bool = (False)
) -> None
```
This function can track parameters, gradients, or both during training. It should be
extended to support arbitrary machine learning models in the future.
| Args | |
| :--- | :--- |
| models (Union[torch.nn.Module, Sequence[torch.nn.Module]]): A single model or a sequence of models to be monitored. criterion (Optional[torch.F]): The loss function being optimized (optional). log (Optional[Literal["gradients", "parameters", "all"]]): Specifies whether to log "gradients", "parameters", or "all". Set to None to disable logging. (default="gradients") log_freq (int): Frequency (in batches) to log gradients and parameters. (default=1000) idx (Optional[int]): Index used when tracking multiple models with `wandb.watch`. (default=None) log_graph (bool): Whether to log the model's computational graph. (default=False) |
| Raises | |
| :--- | :--- |
| `ValueError` | If `wandb.init` has not been called or if any of the models are not instances of `torch.nn.Module`. |
# Query Expression Language
Use the query expressions to select and aggregate data across runs and projects.
Learn more about [query panels]({{< relref "/guides/models/app/features/panels/query-panels/" >}}).
## Data Types
* [artifact](./artifact.md)
* [artifactType](./artifact-type.md)
* [artifactVersion](./artifact-version.md)
* [audio-file](./audio-file.md)
* [bokeh-file](./bokeh-file.md)
* [boolean](./boolean.md)
* [entity](./entity.md)
* [file](./file.md)
* [float](./float.md)
* [html-file](./html-file.md)
* [image-file](./image-file.md)
* [int](./int.md)
* [joined-table](./joined-table.md)
* [molecule-file](./molecule-file.md)
* [number](./number.md)
* [object3D-file](./object-3-d-file.md)
* [partitioned-table](./partitioned-table.md)
* [project](./project.md)
* [pytorch-model-file](./pytorch-model-file.md)
* [run](./run.md)
* [string](./string.md)
* [table](./table.md)
* [user](./user.md)
* [video-file](./video-file.md)
# artifact
## Chainable Ops
artifact-link
Returns the url for an [artifact](artifact.md)
| Argument | |
| :--- | :--- |
| `artifact` | An [artifact](artifact.md) |
#### Return Value
The url for an [artifact](artifact.md)
artifact-name
Returns the name of the [artifact](artifact.md)
| Argument | |
| :--- | :--- |
| `artifact` | An [artifact](artifact.md) |
#### Return Value
The name of the [artifact](artifact.md)
artifact-versions
Returns the versions of the [artifact](artifact.md)
| Argument | |
| :--- | :--- |
| `artifact` | An [artifact](artifact.md) |
#### Return Value
The versions of the [artifact](artifact.md)
## List Ops
artifact-link
Returns the url for an [artifact](artifact.md)
| Argument | |
| :--- | :--- |
| `artifact` | An [artifact](artifact.md) |
#### Return Value
The url for an [artifact](artifact.md)
artifact-name
Returns the name of the [artifact](artifact.md)
| Argument | |
| :--- | :--- |
| `artifact` | An [artifact](artifact.md) |
#### Return Value
The name of the [artifact](artifact.md)
artifact-versions
Returns the versions of the [artifact](artifact.md)
| Argument | |
| :--- | :--- |
| `artifact` | An [artifact](artifact.md) |
#### Return Value
The versions of the [artifact](artifact.md)
# artifactType
## Chainable Ops
artifactType-artifactVersions
Returns the [artifactVersions]( artifact-version.md) of all [artifacts]( artifact.md) of the [artifactType]( artifact-type.md)
| Argument | |
| :--- | :--- |
| `artifactType` | A [artifactType]( artifact-type.md) |
#### Return Value
The [artifactVersions](artifact-version.md) of all [artifacts](artifact.md) of the [artifactType](artifact-type.md)
artifactType-artifacts
Returns the [artifacts]( artifact.md) of the [artifactType](artifact-type.md)
| Argument | |
| :--- | :--- |
| `artifactType` | An [artifactType](artifact-type.md) |
#### Return Value
The [artifacts]( artifact.md) of the [artifactType](artifact-type.md)
artifactType-name
Returns the name of the [artifactType](artifact-type.md)
| Argument | |
| :--- | :--- |
| `artifactType` | A [artifactType]( artifact-type.md) |
#### Return Value
The name of the [artifactType]( artifact-type.md)
## List Ops
artifactType-artifactVersions
Returns the [artifactVersions]( artifact-version.md) of all [artifacts]( artifact.md) of the [artifactType]( artifact-type.md)
| Argument | |
| :--- | :--- |
| `artifactType` | A [artifactType]( artifact-type.md) |
#### Return Value
The [artifactVersions]( artifact-version.md) of all [artifacts]( artifact.md) of the [artifactType]( artifact-type.md)
artifactType-artifacts
Returns the [artifacts]( artifact.md) of the [artifactType]( artifact-type.md)
| Argument | |
| :--- | :--- |
| `artifactType` | A [artifactType]( artifact-type.md) |
#### Return Value
The [artifacts]( artifact.md) of the [artifactType]( artifact-type.md)
artifactType-name
Returns the name of the [artifactType]( artifact-type.md)
| Argument | |
| :--- | :--- |
| `artifactType` | A [artifactType]( artifact-type.md) |
#### Return Value
The name of the [artifactType]( artifact-type.md)
# artifactVersion
## Chainable Ops
artifactVersion-aliases
Returns the aliases for an [artifactVersion](artifact-version.md)
| Argument | |
| :--- | :--- |
| `artifactVersion` | An [artifactVersion](artifact-version.md) |
#### Return Value
The aliases for an [artifactVersion](artifact-version.md)
artifactVersion-createdAt
Returns the datetime at which the [artifactVersion](artifact-version.md) was created
| Argument | |
| :--- | :--- |
| `artifactVersion` | An [artifactVersion](artifact-version.md) |
#### Return Value
The datetime at which the [artifactVersion](artifact-version.md) was created
artifactVersion-file
Returns the _file_ of the [artifactVersion](artifact-version.md) for the given path
| Argument | |
| :--- | :--- |
| `artifactVersion` | An [artifactVersion](artifact-version.md) |
| `path` | The path of the _file_ |
#### Return Value
The _file_ of the [artifactVersion](artifact-version.md) for the given path
artifactVersion-files
Returns the _list_ of _files_ of the [artifactVersion](artifact-version.md)
| Argument | |
| :--- | :--- |
| `artifactVersion` | An [artifactVersion](artifact-version.md) |
#### Return Value
The _list_ of _files_ of the [artifactVersion](artifact-version.md)
artifactVersion-link
Returns the url for an [artifactVersion](artifact-version.md)
| Argument | |
| :--- | :--- |
| `artifactVersion` | An [artifactVersion](artifact-version.md) |
#### Return Value
The url for an [artifactVersion](artifact-version.md)
artifactVersion-metadata
Returns the [artifactVersion](artifact-version.md) metadata dictionary
| Argument | |
| :--- | :--- |
| `artifactVersion` | An [artifactVersion](artifact-version.md) |
#### Return Value
The [artifactVersion](artifact-version.md) metadata dictionary
artifactVersion-name
Returns the name of the [artifactVersion](artifact-version.md)
| Argument | |
| :--- | :--- |
| `artifactVersion` | An [artifactVersion](artifact-version.md) |
#### Return Value
The name of the [artifactVersion](artifact-version.md)
artifactVersion-size
Returns the size of the [artifactVersion](artifact-version.md)
| Argument | |
| :--- | :--- |
| `artifactVersion` | An [artifactVersion](artifact-version.md) |
#### Return Value
The size of the [artifactVersion](artifact-version.md)
artifactVersion-usedBy
Returns the [runs](run.md) that use the [artifactVersion](artifact-version.md)
| Argument | |
| :--- | :--- |
| `artifactVersion` | An [artifactVersion](artifact-version.md) |
#### Return Value
The [runs](run.md) that use the [artifactVersion](artifact-version.md)
artifactVersion-versionId
Returns the versionId of the [artifactVersion](artifact-version.md)
| Argument | |
| :--- | :--- |
| `artifactVersion` | An [artifactVersion](artifact-version.md) |
#### Return Value
The versionId of the [artifactVersion](artifact-version.md)
## List Ops
artifactVersion-aliases
Returns the aliases for an [artifactVersion](artifact-version.md)
| Argument | |
| :--- | :--- |
| `artifactVersion` | An [artifactVersion](artifact-version.md) |
#### Return Value
The aliases for an [artifactVersion](artifact-version.md)
artifactVersion-createdAt
Returns the datetime at which the [artifactVersion](artifact-version.md) was created
| Argument | |
| :--- | :--- |
| `artifactVersion` | An [artifactVersion](artifact-version.md) |
#### Return Value
The datetime at which the [artifactVersion](artifact-version.md) was created
artifactVersion-file
Returns the _file_ of the [artifactVersion](artifact-version.md) for the given path
| Argument | |
| :--- | :--- |
| `artifactVersion` | An [artifactVersion](artifact-version.md) |
| `path` | The path of the _file_ |
#### Return Value
The _file_ of the [artifactVersion](artifact-version.md) for the given path
artifactVersion-files
Returns the _list_ of _files_ of the [artifactVersion](artifact-version.md)
| Argument | |
| :--- | :--- |
| `artifactVersion` | An [artifactVersion](artifact-version.md) |
#### Return Value
The _list_ of _files_ of the [artifactVersion](artifact-version.md)
artifactVersion-link
Returns the url for an [artifactVersion](artifact-version.md)
| Argument | |
| :--- | :--- |
| `artifactVersion` | An [artifactVersion](artifact-version.md) |
#### Return Value
The url for an [artifactVersion](artifact-version.md)
artifactVersion-metadata
Returns the [artifactVersion](artifact-version.md) metadata dictionary
| Argument | |
| :--- | :--- |
| `artifactVersion` | An [artifactVersion](artifact-version.md) |
#### Return Value
The [artifactVersion](artifact-version.md) metadata dictionary
artifactVersion-name
Returns the name of the [artifactVersion](artifact-version.md)
| Argument | |
| :--- | :--- |
| `artifactVersion` | An [artifactVersion](artifact-version.md) |
#### Return Value
The name of the [artifactVersion](artifact-version.md)
artifactVersion-size
Returns the size of the [artifactVersion](artifact-version.md)
| Argument | |
| :--- | :--- |
| `artifactVersion` | An [artifactVersion](artifact-version.md) |
#### Return Value
The size of the [artifactVersion](artifact-version.md)
artifactVersion-usedBy
Returns the [runs](run.md) that use the [artifactVersion](artifact-version.md)
| Argument | |
| :--- | :--- |
| `artifactVersion` | An [artifactVersion](artifact-version.md) |
#### Return Value
The [runs](run.md) that use the [artifactVersion](artifact-version.md)
artifactVersion-versionId
Returns the versionId of the [artifactVersion](artifact-version.md)
| Argument | |
| :--- | :--- |
| `artifactVersion` | An [artifactVersion](artifact-version.md) |
#### Return Value
The versionId of the [artifactVersion](artifact-version.md)
# audio-file
## Chainable Ops
asset-file
Returns the _file_ of the asset
| Argument | |
| :--- | :--- |
| `asset` | The asset |
#### Return Value
The _file_ of the asset
## List Ops
asset-file
Returns the _file_ of the asset
| Argument | |
| :--- | :--- |
| `asset` | The asset |
#### Return Value
The _file_ of the asset
# bokeh-file
## Chainable Ops
asset-file
Returns the _file_ of the asset
| Argument | |
| :--- | :--- |
| `asset` | The asset |
#### Return Value
The _file_ of the asset
## List Ops
asset-file
Returns the _file_ of the asset
| Argument | |
| :--- | :--- |
| `asset` | The asset |
#### Return Value
The _file_ of the asset
# boolean
## Chainable Ops
and
Returns the logical `and` of the two values
| Argument | |
| :--- | :--- |
| `lhs` | First binary value |
| `rhs` | Second binary value |
#### Return Value
The logical `and` of the two values
or
Returns the logical `or` of the two values
| Argument | |
| :--- | :--- |
| `lhs` | First binary value |
| `rhs` | Second binary value |
#### Return Value
The logical `or` of the two values
boolean-not
Returns the logical inverse of the value
| Argument | |
| :--- | :--- |
| `bool` | The boolean value |
#### Return Value
The logical inverse of the value
boolean-not
Returns the logical inverse of the value
| Argument | |
| :--- | :--- |
| `bool` | The boolean value |
#### Return Value
The logical inverse of the value
## List Ops
and
Returns the logical `and` of the two values
| Argument | |
| :--- | :--- |
| `lhs` | First binary value |
| `rhs` | Second binary value |
#### Return Value
The logical `and` of the two values
or
Returns the logical `or` of the two values
| Argument | |
| :--- | :--- |
| `lhs` | First binary value |
| `rhs` | Second binary value |
#### Return Value
The logical `or` of the two values
boolean-not
Returns the logical inverse of the value
| Argument | |
| :--- | :--- |
| `bool` | The boolean value |
#### Return Value
The logical inverse of the value
boolean-not
Returns the logical inverse of the value
| Argument | |
| :--- | :--- |
| `bool` | The boolean value |
#### Return Value
The logical inverse of the value
# entity
## Chainable Ops
entity-link
Returns the link of the [entity](entity.md)
| Argument | |
| :--- | :--- |
| `entity` | A [entity](entity.md) |
#### Return Value
The link of the [entity](entity.md)
entity-name
Returns the name of the [entity](entity.md)
| Argument | |
| :--- | :--- |
| `entity` | A [entity](entity.md) |
#### Return Value
The name of the [entity](entity.md)
## List Ops
entity-link
Returns the link of the [entity](entity.md)
| Argument | |
| :--- | :--- |
| `entity` | A [entity](entity.md) |
#### Return Value
The link of the [entity](entity.md)
entity-name
Returns the name of the [entity](entity.md)
| Argument | |
| :--- | :--- |
| `entity` | A [entity](entity.md) |
#### Return Value
The name of the [entity](entity.md)
# file
## Chainable Ops
file-contents
Returns the contents of the _file_
| Argument | |
| :--- | :--- |
| `file` | A _file_ |
#### Return Value
The contents of the _file_
file-digest
Returns the digest of the _file_
| Argument | |
| :--- | :--- |
| `file` | A _file_ |
#### Return Value
The digest of the _file_
file-size
Returns the size of the _file_
| Argument | |
| :--- | :--- |
| `file` | A _file_ |
#### Return Value
The size of the _file_
file-table
Returns the contents of the _file_ as a _table_
| Argument | |
| :--- | :--- |
| `file` | A _file_ |
#### Return Value
The contents of the _file_ as a _table_
## List Ops
file-contents
Returns the contents of the _file_
| Argument | |
| :--- | :--- |
| `file` | A _file_ |
#### Return Value
The contents of the _file_
file-digest
Returns the digest of the _file_
| Argument | |
| :--- | :--- |
| `file` | A _file_ |
#### Return Value
The digest of the _file_
file-size
Returns the size of the _file_
| Argument | |
| :--- | :--- |
| `file` | A _file_ |
#### Return Value
The size of the _file_
file-table
Returns the contents of the _file_ as a _table_
| Argument | |
| :--- | :--- |
| `file` | A _file_ |
#### Return Value
The contents of the _file_ as a _table_
# float
## Chainable Ops
number-notEqual
Determines inequality of two values.
| Argument | |
| :--- | :--- |
| `lhs` | The first value to compare. |
| `rhs` | The second value to compare. |
#### Return Value
Whether the two values are not equal.
number-modulo
Divide a [number](number.md) by another and return remainder
| Argument | |
| :--- | :--- |
| `lhs` | [number](number.md) to divide |
| `rhs` | [number](number.md) to divide by |
#### Return Value
Modulo of two [numbers](number.md)
number-mult
Multiply two [numbers](number.md)
| Argument | |
| :--- | :--- |
| `lhs` | First [number](number.md) |
| `rhs` | Second [number](number.md) |
#### Return Value
Product of two [numbers](number.md)
number-powBinary
Raise a [number](number.md) to an exponent
| Argument | |
| :--- | :--- |
| `lhs` | Base [number](number.md) |
| `rhs` | Exponent [number](number.md) |
#### Return Value
The base [numbers](number.md) raised to nth power
number-add
Add two [numbers](number.md)
| Argument | |
| :--- | :--- |
| `lhs` | First [number](number.md) |
| `rhs` | Second [number](number.md) |
#### Return Value
Sum of two [numbers](number.md)
number-sub
Subtract a [number](number.md) from another
| Argument | |
| :--- | :--- |
| `lhs` | [number](number.md) to subtract from |
| `rhs` | [number](number.md) to subtract |
#### Return Value
Difference of two [numbers](number.md)
number-div
Divide a [number](number.md) by another
| Argument | |
| :--- | :--- |
| `lhs` | [number](number.md) to divide |
| `rhs` | [number](number.md) to divide by |
#### Return Value
Quotient of two [numbers](number.md)
number-less
Check if a [number](number.md) is less than another
| Argument | |
| :--- | :--- |
| `lhs` | [number](number.md) to compare |
| `rhs` | [number](number.md) to compare to |
#### Return Value
Whether the first [number](number.md) is less than the second
number-lessEqual
Check if a [number](number.md) is less than or equal to another
| Argument | |
| :--- | :--- |
| `lhs` | [number](number.md) to compare |
| `rhs` | [number](number.md) to compare to |
#### Return Value
Whether the first [number](number.md) is less than or equal to the second
number-equal
Determines equality of two values.
| Argument | |
| :--- | :--- |
| `lhs` | The first value to compare. |
| `rhs` | The second value to compare. |
#### Return Value
Whether the two values are equal.
number-greater
Check if a [number](number.md) is greater than another
| Argument | |
| :--- | :--- |
| `lhs` | [number](number.md) to compare |
| `rhs` | [number](number.md) to compare to |
#### Return Value
Whether the first [number](number.md) is greater than the second
number-greaterEqual
Check if a [number](number.md) is greater than or equal to another
| Argument | |
| :--- | :--- |
| `lhs` | [number](number.md) to compare |
| `rhs` | [number](number.md) to compare to |
#### Return Value
Whether the first [number](number.md) is greater than or equal to the second
number-negate
Negate a [number](number.md)
| Argument | |
| :--- | :--- |
| `val` | Number to negate |
#### Return Value
A [number](number.md)
number-toString
Convert a [number](number.md) to a string
| Argument | |
| :--- | :--- |
| `in` | Number to convert |
#### Return Value
String representation of the [number](number.md)
number-toTimestamp
Converts a [number](number.md) to a _timestamp_. Values less than 31536000000 will be converted to seconds, values less than 31536000000000 will be converted to milliseconds, values less than 31536000000000000 will be converted to microseconds, and values less than 31536000000000000000 will be converted to nanoseconds.
| Argument | |
| :--- | :--- |
| `val` | Number to convert to a timestamp |
#### Return Value
Timestamp
number-abs
Calculates the absolute value of a [number](number.md)
| Argument | |
| :--- | :--- |
| `n` | A [number](number.md) |
#### Return Value
The absolute value of the [number](number.md)
## List Ops
number-notEqual
Determines inequality of two values.
| Argument | |
| :--- | :--- |
| `lhs` | The first value to compare. |
| `rhs` | The second value to compare. |
#### Return Value
Whether the two values are not equal.
number-modulo
Divide a [number](number.md) by another and return remainder
| Argument | |
| :--- | :--- |
| `lhs` | [number](number.md) to divide |
| `rhs` | [number](number.md) to divide by |
#### Return Value
Modulo of two [numbers](number.md)
number-mult
Multiply two [numbers](number.md)
| Argument | |
| :--- | :--- |
| `lhs` | First [number](number.md) |
| `rhs` | Second [number](number.md) |
#### Return Value
Product of two [numbers](number.md)
number-powBinary
Raise a [number](number.md) to an exponent
| Argument | |
| :--- | :--- |
| `lhs` | Base [number](number.md) |
| `rhs` | Exponent [number](number.md) |
#### Return Value
The base [numbers](number.md) raised to nth power
number-add
Add two [numbers](number.md)
| Argument | |
| :--- | :--- |
| `lhs` | First [number](number.md) |
| `rhs` | Second [number](number.md) |
#### Return Value
Sum of two [numbers](number.md)
number-sub
Subtract a [number](number.md) from another
| Argument | |
| :--- | :--- |
| `lhs` | [number](number.md) to subtract from |
| `rhs` | [number](number.md) to subtract |
#### Return Value
Difference of two [numbers](number.md)
number-div
Divide a [number](number.md) by another
| Argument | |
| :--- | :--- |
| `lhs` | [number](number.md) to divide |
| `rhs` | [number](number.md) to divide by |
#### Return Value
Quotient of two [numbers](number.md)
number-less
Check if a [number](number.md) is less than another
| Argument | |
| :--- | :--- |
| `lhs` | [number](number.md) to compare |
| `rhs` | [number](number.md) to compare to |
#### Return Value
Whether the first [number](number.md) is less than the second
number-lessEqual
Check if a [number](number.md) is less than or equal to another
| Argument | |
| :--- | :--- |
| `lhs` | [number](number.md) to compare |
| `rhs` | [number](number.md) to compare to |
#### Return Value
Whether the first [number](number.md) is less than or equal to the second
number-equal
Determines equality of two values.
| Argument | |
| :--- | :--- |
| `lhs` | The first value to compare. |
| `rhs` | The second value to compare. |
#### Return Value
Whether the two values are equal.
number-greater
Check if a [number](number.md) is greater than another
| Argument | |
| :--- | :--- |
| `lhs` | [number](number.md) to compare |
| `rhs` | [number](number.md) to compare to |
#### Return Value
Whether the first [number](number.md) is greater than the second
number-greaterEqual
Check if a [number](number.md) is greater than or equal to another
| Argument | |
| :--- | :--- |
| `lhs` | [number](number.md) to compare |
| `rhs` | [number](number.md) to compare to |
#### Return Value
Whether the first [number](number.md) is greater than or equal to the second
number-negate
Negate a [number](number.md)
| Argument | |
| :--- | :--- |
| `val` | Number to negate |
#### Return Value
A [number](number.md)
numbers-argmax
Finds the index of maximum [number](number.md)
| Argument | |
| :--- | :--- |
| `numbers` | _list_ of [numbers](number.md) to find the index of maximum [number](number.md) |
#### Return Value
Index of maximum [number](number.md)
numbers-argmin
Finds the index of minimum [number](number.md)
| Argument | |
| :--- | :--- |
| `numbers` | _list_ of [numbers](number.md) to find the index of minimum [number](number.md) |
#### Return Value
Index of minimum [number](number.md)
numbers-avg
Average of [numbers](number.md)
| Argument | |
| :--- | :--- |
| `numbers` | _list_ of [numbers](number.md) to average |
#### Return Value
Average of [numbers](number.md)
numbers-max
Maximum number
| Argument | |
| :--- | :--- |
| `numbers` | _list_ of [numbers](number.md) to find the maximum [number](number.md) |
#### Return Value
Maximum [number](number.md)
numbers-min
Minimum number
| Argument | |
| :--- | :--- |
| `numbers` | _list_ of [numbers](number.md) to find the minimum [number](number.md) |
#### Return Value
Minimum [number](number.md)
numbers-stddev
Standard deviation of [numbers](number.md)
| Argument | |
| :--- | :--- |
| `numbers` | _list_ of [numbers](number.md) to calculate the standard deviation |
#### Return Value
Standard deviation of [numbers](number.md)
numbers-sum
Sum of [numbers](number.md)
| Argument | |
| :--- | :--- |
| `numbers` | _list_ of [numbers](number.md) to sum |
#### Return Value
Sum of [numbers](number.md)
number-toString
Convert a [number](number.md) to a string
| Argument | |
| :--- | :--- |
| `in` | Number to convert |
#### Return Value
String representation of the [number](number.md)
number-toTimestamp
Converts a [number](number.md) to a _timestamp_. Values less than 31536000000 will be converted to seconds, values less than 31536000000000 will be converted to milliseconds, values less than 31536000000000000 will be converted to microseconds, and values less than 31536000000000000000 will be converted to nanoseconds.
| Argument | |
| :--- | :--- |
| `val` | Number to convert to a timestamp |
#### Return Value
Timestamp
number-abs
Calculates the absolute value of a [number](number.md)
| Argument | |
| :--- | :--- |
| `n` | A [number](number.md) |
#### Return Value
The absolute value of the [number](number.md)
# html-file
## Chainable Ops
asset-file
Returns the _file_ of the asset
| Argument | |
| :--- | :--- |
| `asset` | The asset |
#### Return Value
The _file_ of the asset
## List Ops
asset-file
Returns the _file_ of the asset
| Argument | |
| :--- | :--- |
| `asset` | The asset |
#### Return Value
The _file_ of the asset
# image-file
## Chainable Ops
asset-file
Returns the _file_ of the asset
| Argument | |
| :--- | :--- |
| `asset` | The asset |
#### Return Value
The _file_ of the asset
## List Ops
asset-file
Returns the _file_ of the asset
| Argument | |
| :--- | :--- |
| `asset` | The asset |
#### Return Value
The _file_ of the asset
# int
## Chainable Ops
number-notEqual
Determines inequality of two values.
| Argument | |
| :--- | :--- |
| `lhs` | The first value to compare. |
| `rhs` | The second value to compare. |
#### Return Value
Whether the two values are not equal.
number-modulo
Divide a [number](number.md) by another and return remainder
| Argument | |
| :--- | :--- |
| `lhs` | [number](number.md) to divide |
| `rhs` | [number](number.md) to divide by |
#### Return Value
Modulo of two [numbers](number.md)
number-mult
Multiply two [numbers](number.md)
| Argument | |
| :--- | :--- |
| `lhs` | First [number](number.md) |
| `rhs` | Second [number](number.md) |
#### Return Value
Product of two [numbers](number.md)
number-powBinary
Raise a [number](number.md) to an exponent
| Argument | |
| :--- | :--- |
| `lhs` | Base [number](number.md) |
| `rhs` | Exponent [number](number.md) |
#### Return Value
The base [numbers](number.md) raised to nth power
number-add
Add two [numbers](number.md)
| Argument | |
| :--- | :--- |
| `lhs` | First [number](number.md) |
| `rhs` | Second [number](number.md) |
#### Return Value
Sum of two [numbers](number.md)
number-sub
Subtract a [number](number.md) from another
| Argument | |
| :--- | :--- |
| `lhs` | [number](number.md) to subtract from |
| `rhs` | [number](number.md) to subtract |
#### Return Value
Difference of two [numbers](number.md)
number-div
Divide a [number](number.md) by another
| Argument | |
| :--- | :--- |
| `lhs` | [number](number.md) to divide |
| `rhs` | [number](number.md) to divide by |
#### Return Value
Quotient of two [numbers](number.md)
number-less
Check if a [number](number.md) is less than another
| Argument | |
| :--- | :--- |
| `lhs` | [number](number.md) to compare |
| `rhs` | [number](number.md) to compare to |
#### Return Value
Whether the first [number](number.md) is less than the second
number-lessEqual
Check if a [number](number.md) is less than or equal to another
| Argument | |
| :--- | :--- |
| `lhs` | [number](number.md) to compare |
| `rhs` | [number](number.md) to compare to |
#### Return Value
Whether the first [number](number.md) is less than or equal to the second
number-equal
Determines equality of two values.
| Argument | |
| :--- | :--- |
| `lhs` | The first value to compare. |
| `rhs` | The second value to compare. |
#### Return Value
Whether the two values are equal.
number-greater
Check if a [number](number.md) is greater than another
| Argument | |
| :--- | :--- |
| `lhs` | [number](number.md) to compare |
| `rhs` | [number](number.md) to compare to |
#### Return Value
Whether the first [number](number.md) is greater than the second
number-greaterEqual
Check if a [number](number.md) is greater than or equal to another
| Argument | |
| :--- | :--- |
| `lhs` | [number](number.md) to compare |
| `rhs` | [number](number.md) to compare to |
#### Return Value
Whether the first [number](number.md) is greater than or equal to the second
number-negate
Negate a [number](number.md)
| Argument | |
| :--- | :--- |
| `val` | Number to negate |
#### Return Value
A [number](number.md)
number-toString
Convert a [number](number.md) to a string
| Argument | |
| :--- | :--- |
| `in` | Number to convert |
#### Return Value
String representation of the [number](number.md)
number-toTimestamp
Converts a [number](number.md) to a _timestamp_. Values less than 31536000000 will be converted to seconds, values less than 31536000000000 will be converted to milliseconds, values less than 31536000000000000 will be converted to microseconds, and values less than 31536000000000000000 will be converted to nanoseconds.
| Argument | |
| :--- | :--- |
| `val` | Number to convert to a timestamp |
#### Return Value
Timestamp
number-abs
Calculates the absolute value of a [number](number.md)
| Argument | |
| :--- | :--- |
| `n` | A [number](number.md) |
#### Return Value
The absolute value of the [number](number.md)
## List Ops
number-notEqual
Determines inequality of two values.
| Argument | |
| :--- | :--- |
| `lhs` | The first value to compare. |
| `rhs` | The second value to compare. |
#### Return Value
Whether the two values are not equal.
number-modulo
Divide a [number](number.md) by another and return remainder
| Argument | |
| :--- | :--- |
| `lhs` | [number](number.md) to divide |
| `rhs` | [number](number.md) to divide by |
#### Return Value
Modulo of two [numbers](number.md)
number-mult
Multiply two [numbers](number.md)
| Argument | |
| :--- | :--- |
| `lhs` | First [number](number.md) |
| `rhs` | Second [number](number.md) |
#### Return Value
Product of two [numbers](number.md)
number-powBinary
Raise a [number](number.md) to an exponent
| Argument | |
| :--- | :--- |
| `lhs` | Base [number](number.md) |
| `rhs` | Exponent [number](number.md) |
#### Return Value
The base [numbers](number.md) raised to nth power
number-add
Add two [numbers](number.md)
| Argument | |
| :--- | :--- |
| `lhs` | First [number](number.md) |
| `rhs` | Second [number](number.md) |
#### Return Value
Sum of two [numbers](number.md)
number-sub
Subtract a [number](number.md) from another
| Argument | |
| :--- | :--- |
| `lhs` | [number](number.md) to subtract from |
| `rhs` | [number](number.md) to subtract |
#### Return Value
Difference of two [numbers](number.md)
number-div
Divide a [number](number.md) by another
| Argument | |
| :--- | :--- |
| `lhs` | [number](number.md) to divide |
| `rhs` | [number](number.md) to divide by |
#### Return Value
Quotient of two [numbers](number.md)
number-less
Check if a [number](number.md) is less than another
| Argument | |
| :--- | :--- |
| `lhs` | [number](number.md) to compare |
| `rhs` | [number](number.md) to compare to |
#### Return Value
Whether the first [number](number.md) is less than the second
number-lessEqual
Check if a [number](number.md) is less than or equal to another
| Argument | |
| :--- | :--- |
| `lhs` | [number](number.md) to compare |
| `rhs` | [number](number.md) to compare to |
#### Return Value
Whether the first [number](number.md) is less than or equal to the second
number-equal
Determines equality of two values.
| Argument | |
| :--- | :--- |
| `lhs` | The first value to compare. |
| `rhs` | The second value to compare. |
#### Return Value
Whether the two values are equal.
number-greater
Check if a [number](number.md) is greater than another
| Argument | |
| :--- | :--- |
| `lhs` | [number](number.md) to compare |
| `rhs` | [number](number.md) to compare to |
#### Return Value
Whether the first [number](number.md) is greater than the second
number-greaterEqual
Check if a [number](number.md) is greater than or equal to another
| Argument | |
| :--- | :--- |
| `lhs` | [number](number.md) to compare |
| `rhs` | [number](number.md) to compare to |
#### Return Value
Whether the first [number](number.md) is greater than or equal to the second
number-negate
Negate a [number](number.md)
| Argument | |
| :--- | :--- |
| `val` | Number to negate |
#### Return Value
A [number](number.md)
numbers-argmax
Finds the index of maximum [number](number.md)
| Argument | |
| :--- | :--- |
| `numbers` | _list_ of [numbers](number.md) to find the index of maximum [number](number.md) |
#### Return Value
Index of maximum [number](number.md)
numbers-argmin
Finds the index of minimum [number](number.md)
| Argument | |
| :--- | :--- |
| `numbers` | _list_ of [numbers](number.md) to find the index of minimum [number](number.md) |
#### Return Value
Index of minimum [number](number.md)
numbers-avg
Average of [numbers](number.md)
| Argument | |
| :--- | :--- |
| `numbers` | _list_ of [numbers](number.md) to average |
#### Return Value
Average of [numbers](number.md)
numbers-max
Maximum number
| Argument | |
| :--- | :--- |
| `numbers` | _list_ of [numbers](number.md) to find the maximum [number](number.md) |
#### Return Value
Maximum [number](number.md)
numbers-min
Minimum number
| Argument | |
| :--- | :--- |
| `numbers` | _list_ of [numbers](number.md) to find the minimum [number](number.md) |
#### Return Value
Minimum [number](number.md)
numbers-stddev
Standard deviation of [numbers](number.md)
| Argument | |
| :--- | :--- |
| `numbers` | _list_ of [numbers](number.md) to calculate the standard deviation |
#### Return Value
Standard deviation of [numbers](number.md)
numbers-sum
Sum of [numbers](number.md)
| Argument | |
| :--- | :--- |
| `numbers` | _list_ of [numbers](number.md) to sum |
#### Return Value
Sum of [numbers](number.md)
number-toString
Convert a [number](number.md) to a string
| Argument | |
| :--- | :--- |
| `in` | Number to convert |
#### Return Value
String representation of the [number](number.md)
number-toTimestamp
Converts a [number](number.md) to a _timestamp_. Values less than 31536000000 will be converted to seconds, values less than 31536000000000 will be converted to milliseconds, values less than 31536000000000000 will be converted to microseconds, and values less than 31536000000000000000 will be converted to nanoseconds.
| Argument | |
| :--- | :--- |
| `val` | Number to convert to a timestamp |
#### Return Value
Timestamp
number-abs
Calculates the absolute value of a [number](number.md)
| Argument | |
| :--- | :--- |
| `n` | A [number](number.md) |
#### Return Value
The absolute value of the [number](number.md)
# joined-table
## Chainable Ops
asset-file
Returns the _file_ of the asset
| Argument | |
| :--- | :--- |
| `asset` | The asset |
#### Return Value
The _file_ of the asset
joinedtable-file
Returns the _file_ of a _joined-table_
| Argument | |
| :--- | :--- |
| `joinedTable` | The _joined-table_ |
#### Return Value
The _file_ of a _joined-table_
joinedtable-rows
Returns the rows of a _joined-table_
| Argument | |
| :--- | :--- |
| `joinedTable` | The _joined-table_ |
| `leftOuter` | Whether to include rows from the left table that do not have a matching row in the right table |
| `rightOuter` | Whether to include rows from the right table that do not have a matching row in the left table |
#### Return Value
The rows of the _joined-table_
## List Ops
asset-file
Returns the _file_ of the asset
| Argument | |
| :--- | :--- |
| `asset` | The asset |
#### Return Value
The _file_ of the asset
# molecule-file
## Chainable Ops
asset-file
Returns the _file_ of the asset
| Argument | |
| :--- | :--- |
| `asset` | The asset |
#### Return Value
The _file_ of the asset
## List Ops
asset-file
Returns the _file_ of the asset
| Argument | |
| :--- | :--- |
| `asset` | The asset |
#### Return Value
The _file_ of the asset
# number
## Chainable Ops
number-notEqual
Determines inequality of two values.
| Argument | |
| :--- | :--- |
| `lhs` | The first value to compare. |
| `rhs` | The second value to compare. |
#### Return Value
Whether the two values are not equal.
number-modulo
Divide a [number](number.md) by another and return remainder
| Argument | |
| :--- | :--- |
| `lhs` | [number](number.md) to divide |
| `rhs` | [number](number.md) to divide by |
#### Return Value
Modulo of two [numbers](number.md)
number-mult
Multiply two [numbers](number.md)
| Argument | |
| :--- | :--- |
| `lhs` | First [number](number.md) |
| `rhs` | Second [number](number.md) |
#### Return Value
Product of two [numbers](number.md)
number-powBinary
Raise a [number](number.md) to an exponent
| Argument | |
| :--- | :--- |
| `lhs` | Base [number](number.md) |
| `rhs` | Exponent [number](number.md) |
#### Return Value
The base [numbers](number.md) raised to nth power
number-add
Add two [numbers](number.md)
| Argument | |
| :--- | :--- |
| `lhs` | First [number](number.md) |
| `rhs` | Second [number](number.md) |
#### Return Value
Sum of two [numbers](number.md)
number-sub
Subtract a [number](number.md) from another
| Argument | |
| :--- | :--- |
| `lhs` | [number](number.md) to subtract from |
| `rhs` | [number](number.md) to subtract |
#### Return Value
Difference of two [numbers](number.md)
number-div
Divide a [number](number.md) by another
| Argument | |
| :--- | :--- |
| `lhs` | [number](number.md) to divide |
| `rhs` | [number](number.md) to divide by |
#### Return Value
Quotient of two [numbers](number.md)
number-less
Check if a [number](number.md) is less than another
| Argument | |
| :--- | :--- |
| `lhs` | [number](number.md) to compare |
| `rhs` | [number](number.md) to compare to |
#### Return Value
Whether the first [number](number.md) is less than the second
number-lessEqual
Check if a [number](number.md) is less than or equal to another
| Argument | |
| :--- | :--- |
| `lhs` | [number](number.md) to compare |
| `rhs` | [number](number.md) to compare to |
#### Return Value
Whether the first [number](number.md) is less than or equal to the second
number-equal
Determines equality of two values.
| Argument | |
| :--- | :--- |
| `lhs` | The first value to compare. |
| `rhs` | The second value to compare. |
#### Return Value
Whether the two values are equal.
number-greater
Check if a [number](number.md) is greater than another
| Argument | |
| :--- | :--- |
| `lhs` | [number](number.md) to compare |
| `rhs` | [number](number.md) to compare to |
#### Return Value
Whether the first [number](number.md) is greater than the second
number-greaterEqual
Check if a [number](number.md) is greater than or equal to another
| Argument | |
| :--- | :--- |
| `lhs` | [number](number.md) to compare |
| `rhs` | [number](number.md) to compare to |
#### Return Value
Whether the first [number](number.md) is greater than or equal to the second
number-negate
Negate a [number](number.md)
| Argument | |
| :--- | :--- |
| `val` | Number to negate |
#### Return Value
A [number](number.md)
number-toString
Convert a [number](number.md) to a string
| Argument | |
| :--- | :--- |
| `in` | Number to convert |
#### Return Value
String representation of the [number](number.md)
number-toTimestamp
Converts a [number](number.md) to a _timestamp_. Values less than 31536000000 will be converted to seconds, values less than 31536000000000 will be converted to milliseconds, values less than 31536000000000000 will be converted to microseconds, and values less than 31536000000000000000 will be converted to nanoseconds.
| Argument | |
| :--- | :--- |
| `val` | Number to convert to a timestamp |
#### Return Value
Timestamp
number-abs
Calculates the absolute value of a [number](number.md)
| Argument | |
| :--- | :--- |
| `n` | A [number](number.md) |
#### Return Value
The absolute value of the [number](number.md)
## List Ops
number-notEqual
Determines inequality of two values.
| Argument | |
| :--- | :--- |
| `lhs` | The first value to compare. |
| `rhs` | The second value to compare. |
#### Return Value
Whether the two values are not equal.
number-modulo
Divide a [number](number.md) by another and return remainder
| Argument | |
| :--- | :--- |
| `lhs` | [number](number.md) to divide |
| `rhs` | [number](number.md) to divide by |
#### Return Value
Modulo of two [numbers](number.md)
number-mult
Multiply two [numbers](number.md)
| Argument | |
| :--- | :--- |
| `lhs` | First [number](number.md) |
| `rhs` | Second [number](number.md) |
#### Return Value
Product of two [numbers](number.md)
number-powBinary
Raise a [number](number.md) to an exponent
| Argument | |
| :--- | :--- |
| `lhs` | Base [number](number.md) |
| `rhs` | Exponent [number](number.md) |
#### Return Value
The base [numbers](number.md) raised to nth power
number-add
Add two [numbers](number.md)
| Argument | |
| :--- | :--- |
| `lhs` | First [number](number.md) |
| `rhs` | Second [number](number.md) |
#### Return Value
Sum of two [numbers](number.md)
number-sub
Subtract a [number](number.md) from another
| Argument | |
| :--- | :--- |
| `lhs` | [number](number.md) to subtract from |
| `rhs` | [number](number.md) to subtract |
#### Return Value
Difference of two [numbers](number.md)
number-div
Divide a [number](number.md) by another
| Argument | |
| :--- | :--- |
| `lhs` | [number](number.md) to divide |
| `rhs` | [number](number.md) to divide by |
#### Return Value
Quotient of two [numbers](number.md)
number-less
Check if a [number](number.md) is less than another
| Argument | |
| :--- | :--- |
| `lhs` | [number](number.md) to compare |
| `rhs` | [number](number.md) to compare to |
#### Return Value
Whether the first [number](number.md) is less than the second
number-lessEqual
Check if a [number](number.md) is less than or equal to another
| Argument | |
| :--- | :--- |
| `lhs` | [number](number.md) to compare |
| `rhs` | [number](number.md) to compare to |
#### Return Value
Whether the first [number](number.md) is less than or equal to the second
number-equal
Determines equality of two values.
| Argument | |
| :--- | :--- |
| `lhs` | The first value to compare. |
| `rhs` | The second value to compare. |
#### Return Value
Whether the two values are equal.
number-greater
Check if a [number](number.md) is greater than another
| Argument | |
| :--- | :--- |
| `lhs` | [number](number.md) to compare |
| `rhs` | [number](number.md) to compare to |
#### Return Value
Whether the first [number](number.md) is greater than the second
number-greaterEqual
Check if a [number](number.md) is greater than or equal to another
| Argument | |
| :--- | :--- |
| `lhs` | [number](number.md) to compare |
| `rhs` | [number](number.md) to compare to |
#### Return Value
Whether the first [number](number.md) is greater than or equal to the second
number-negate
Negate a [number](number.md)
| Argument | |
| :--- | :--- |
| `val` | Number to negate |
#### Return Value
A [number](number.md)
numbers-argmax
Finds the index of maximum [number](number.md)
| Argument | |
| :--- | :--- |
| `numbers` | _list_ of [numbers](number.md) to find the index of maximum [number](number.md) |
#### Return Value
Index of maximum [number](number.md)
numbers-argmin
Finds the index of minimum [number](number.md)
| Argument | |
| :--- | :--- |
| `numbers` | _list_ of [numbers](number.md) to find the index of minimum [number](number.md) |
#### Return Value
Index of minimum [number](number.md)
numbers-avg
Average of [numbers](number.md)
| Argument | |
| :--- | :--- |
| `numbers` | _list_ of [numbers](number.md) to average |
#### Return Value
Average of [numbers](number.md)
numbers-max
Maximum number
| Argument | |
| :--- | :--- |
| `numbers` | _list_ of [numbers](number.md) to find the maximum [number](number.md) |
#### Return Value
Maximum [number](number.md)
numbers-min
Minimum number
| Argument | |
| :--- | :--- |
| `numbers` | _list_ of [numbers](number.md) to find the minimum [number](number.md) |
#### Return Value
Minimum [number](number.md)
numbers-stddev
Standard deviation of [numbers](number.md)
| Argument | |
| :--- | :--- |
| `numbers` | _list_ of [numbers](number.md) to calculate the standard deviation |
#### Return Value
Standard deviation of [numbers](number.md)
numbers-sum
Sum of [numbers](number.md)
| Argument | |
| :--- | :--- |
| `numbers` | _list_ of [numbers](number.md) to sum |
#### Return Value
Sum of [numbers](number.md)
number-toString
Convert a [number](number.md) to a string
| Argument | |
| :--- | :--- |
| `in` | Number to convert |
#### Return Value
String representation of the [number](number.md)
number-toTimestamp
Converts a [number](number.md) to a _timestamp_. Values less than 31536000000 will be converted to seconds, values less than 31536000000000 will be converted to milliseconds, values less than 31536000000000000 will be converted to microseconds, and values less than 31536000000000000000 will be converted to nanoseconds.
| Argument | |
| :--- | :--- |
| `val` | Number to convert to a timestamp |
#### Return Value
Timestamp
number-abs
Calculates the absolute value of a [number](number.md)
| Argument | |
| :--- | :--- |
| `n` | A [number](number.md) |
#### Return Value
The absolute value of the [number](number.md)
# object3D-file
## Chainable Ops
asset-file
Returns the _file_ of the asset
| Argument | |
| :--- | :--- |
| `asset` | The asset |
#### Return Value
The _file_ of the asset
## List Ops
asset-file
Returns the _file_ of the asset
| Argument | |
| :--- | :--- |
| `asset` | The asset |
#### Return Value
The _file_ of the asset
# partitioned-table
## Chainable Ops
asset-file
Returns the _file_ of the asset
| Argument | |
| :--- | :--- |
| `asset` | The asset |
#### Return Value
The _file_ of the asset
partitionedtable-file
Returns the _file_ of a _partitioned-table_
| Argument | |
| :--- | :--- |
| `partitionedTable` | The _partitioned-table_ |
#### Return Value
_file_ of the _partitioned-table_
partitionedtable-rows
Returns the rows of a _partitioned-table_
| Argument | |
| :--- | :--- |
| `partitionedTable` | The _partitioned-table_ to get rows from |
#### Return Value
Rows of the _partitioned-table_
## List Ops
asset-file
Returns the _file_ of the asset
| Argument | |
| :--- | :--- |
| `asset` | The asset |
#### Return Value
The _file_ of the asset
# project
## Chainable Ops
project-artifact
Returns the [artifact](artifact.md) for a given name within a [project](project.md)
| Argument | |
| :--- | :--- |
| `project` | A [project](project.md) |
| `artifactName` | The name of the [artifact](artifact.md) |
#### Return Value
The [artifact](artifact.md) for a given name within a [project](project.md)
project-artifactType
Returns the [artifactType](artifact-type.md for a given name within a [project](project.md)
| Argument | |
| :--- | :--- |
| `project` | A [project](project.md) |
| `artifactType` | The name of the [artifactType](artifact-type.md |
#### Return Value
The [artifactType](artifact-type.md for a given name within a [project](project.md)
project-artifactTypes
Returns the [artifactTypes](artifact-type.md for a [project](project.md)
| Argument | |
| :--- | :--- |
| `project` | A [project](project.md) |
#### Return Value
The [artifactTypes](artifact-type.md for a [project](project.md)
project-artifactVersion
Returns the [artifactVersion](artifact-version.md for a given name and version within a [project](project.md)
| Argument | |
| :--- | :--- |
| `project` | A [project](project.md) |
| `artifactName` | The name of the [artifactVersion](artifact-version.md |
| `artifactVersionAlias` | The version alias of the [artifactVersion](artifact-version.md |
#### Return Value
The [artifactVersion](artifact-version.md for a given name and version within a [project](project.md)
project-createdAt
Returns the creation time of the [project](project.md)
| Argument | |
| :--- | :--- |
| `project` | A [project](project.md) |
#### Return Value
The creation time of the [project](project.md)
project-name
Returns the name of the [project](project.md)
| Argument | |
| :--- | :--- |
| `project` | A [project](project.md) |
#### Return Value
The name of the [project](project.md)
project-runs
Returns the [runs](run.md) from a [project](project.md)
| Argument | |
| :--- | :--- |
| `project` | A [project](project.md) |
#### Return Value
The [runs](run.md) from a [project](project.md)
## List Ops
project-artifact
Returns the [artifact](artifact.md) for a given name within a [project](project.md)
| Argument | |
| :--- | :--- |
| `project` | A [project](project.md) |
| `artifactName` | The name of the [artifact](artifact.md) |
#### Return Value
The [artifact](artifact.md) for a given name within a [project](project.md)
project-artifactType
Returns the [artifactType](artifact-type.md for a given name within a [project](project.md)
| Argument | |
| :--- | :--- |
| `project` | A [project](project.md) |
| `artifactType` | The name of the [artifactType](artifact-type.md |
#### Return Value
The [artifactType](artifact-type.md for a given name within a [project](project.md)
project-artifactTypes
Returns the [artifactTypes](artifact-type.md for a [project](project.md)
| Argument | |
| :--- | :--- |
| `project` | A [project](project.md) |
#### Return Value
The [artifactTypes](artifact-type.md for a [project](project.md)
project-artifactVersion
Returns the [artifactVersion](artifact-version.md for a given name and version within a [project](project.md)
| Argument | |
| :--- | :--- |
| `project` | A [project](project.md) |
| `artifactName` | The name of the [artifactVersion](artifact-version.md |
| `artifactVersionAlias` | The version alias of the [artifactVersion](artifact-version.md |
#### Return Value
The [artifactVersion](artifact-version.md for a given name and version within a [project](project.md)
project-createdAt
Returns the creation time of the [project](project.md)
| Argument | |
| :--- | :--- |
| `project` | A [project](project.md) |
#### Return Value
The creation time of the [project](project.md)
project-name
Returns the name of the [project](project.md)
| Argument | |
| :--- | :--- |
| `project` | A [project](project.md) |
#### Return Value
The name of the [project](project.md)
project-runs
Returns the [runs](run.md) from a [project](project.md)
| Argument | |
| :--- | :--- |
| `project` | A [project](project.md) |
#### Return Value
The [runs](run.md) from a [project](project.md)
# pytorch-model-file
## Chainable Ops
asset-file
Returns the _file_ of the asset
| Argument | |
| :--- | :--- |
| `asset` | The asset |
#### Return Value
The _file_ of the asset
## List Ops
asset-file
Returns the _file_ of the asset
| Argument | |
| :--- | :--- |
| `asset` | The asset |
#### Return Value
The _file_ of the asset
# run
## Chainable Ops
run-config
Returns the config _typedDict_ of the [run](run.md)
| Argument | |
| :--- | :--- |
| `run` | A [run](run.md) |
#### Return Value
The config _typedDict_ of the [run](run.md)
run-createdAt
Returns the created at datetime of the [run](run.md)
| Argument | |
| :--- | :--- |
| `run` | A [run](run.md) |
#### Return Value
The created at datetime of the [run](run.md)
run-heartbeatAt
Returns the last heartbeat datetime of the [run](run.md)
| Argument | |
| :--- | :--- |
| `run` | A [run](run.md) |
#### Return Value
The last heartbeat datetime of the [run](run.md)
run-history
Returns the log history of the [run](run.md)
| Argument | |
| :--- | :--- |
| `run` | A [run](run.md) |
#### Return Value
The log history of the [run](run.md)
run-jobType
Returns the job type of the [run](run.md)
| Argument | |
| :--- | :--- |
| `run` | A [run](run.md) |
#### Return Value
The job type of the [run](run.md)
run-loggedArtifactVersion
Returns the [artifactVersion](artifact-version.md) logged by the [run](run.md) for a given name and alias
| Argument | |
| :--- | :--- |
| `run` | A [run](run.md) |
| `artifactVersionName` | The name:alias of the [artifactVersion](artifact-version.md) |
#### Return Value
The [artifactVersion](artifact-version.md) logged by the [run](run.md) for a given name and alias
run-loggedArtifactVersions
Returns all of the [artifactVersions](artifact-version.md) logged by the [run](run.md)
| Argument | |
| :--- | :--- |
| `run` | A [run](run.md) |
#### Return Value
The [artifactVersions](artifact-version.md) logged by the [run](run.md)
run-name
Returns the name of the [run](run.md)
| Argument | |
| :--- | :--- |
| `run` | A [run](run.md) |
#### Return Value
The name of the [run](run.md)
run-runtime
Returns the runtime in seconds of the [run](run.md)
| Argument | |
| :--- | :--- |
| `run` | A [run](run.md) |
#### Return Value
The runtime in seconds of the [run](run.md)
run-summary
Returns the summary _typedDict_ of the [run](run.md)
| Argument | |
| :--- | :--- |
| `run` | A [run](run.md) |
#### Return Value
The summary _typedDict_ of the [run](run.md)
run-usedArtifactVersions
Returns all of the [artifactVersions](artifact-version.md) used by the [run](run.md)
| Argument | |
| :--- | :--- |
| `run` | A [run](run.md) |
#### Return Value
The [artifactVersions](artifact-version.md) used by the [run](run.md)
run-user
Returns the [user](user.md) of the [run](run.md)
| Argument | |
| :--- | :--- |
| `run` | A [run](run.md) |
#### Return Value
The [user](user.md) of the [run](run.md)
## List Ops
run-config
Returns the config _typedDict_ of the [run](run.md)
| Argument | |
| :--- | :--- |
| `run` | A [run](run.md) |
#### Return Value
The config _typedDict_ of the [run](run.md)
run-createdAt
Returns the created at datetime of the [run](run.md)
| Argument | |
| :--- | :--- |
| `run` | A [run](run.md) |
#### Return Value
The created at datetime of the [run](run.md)
run-heartbeatAt
Returns the last heartbeat datetime of the [run](run.md)
| Argument | |
| :--- | :--- |
| `run` | A [run](run.md) |
#### Return Value
The last heartbeat datetime of the [run](run.md)
run-history
Returns the log history of the [run](run.md)
| Argument | |
| :--- | :--- |
| `run` | A [run](run.md) |
#### Return Value
The log history of the [run](run.md)
run-jobType
Returns the job type of the [run](run.md)
| Argument | |
| :--- | :--- |
| `run` | A [run](run.md) |
#### Return Value
The job type of the [run](run.md)
run-loggedArtifactVersion
Returns the [artifactVersion](artifact-version.md) logged by the [run](run.md) for a given name and alias
| Argument | |
| :--- | :--- |
| `run` | A [run](run.md) |
| `artifactVersionName` | The name:alias of the [artifactVersion](artifact-version.md) |
#### Return Value
The [artifactVersion](artifact-version.md) logged by the [run](run.md) for a given name and alias
run-loggedArtifactVersions
Returns all of the [artifactVersions](artifact-version.md) logged by the [run](run.md)
| Argument | |
| :--- | :--- |
| `run` | A [run](run.md) |
#### Return Value
The [artifactVersions](artifact-version.md) logged by the [run](run.md)
run-name
Returns the name of the [run](run.md)
| Argument | |
| :--- | :--- |
| `run` | A [run](run.md) |
#### Return Value
The name of the [run](run.md)
run-runtime
Returns the runtime in seconds of the [run](run.md)
| Argument | |
| :--- | :--- |
| `run` | A [run](run.md) |
#### Return Value
The runtime in seconds of the [run](run.md)
run-summary
Returns the summary _typedDict_ of the [run](run.md)
| Argument | |
| :--- | :--- |
| `run` | A [run](run.md) |
#### Return Value
The summary _typedDict_ of the [run](run.md)
run-usedArtifactVersions
Returns all of the [artifactVersions](artifact-version.md) used by the [run](run.md)
| Argument | |
| :--- | :--- |
| `run` | A [run](run.md) |
#### Return Value
The [artifactVersions](artifact-version.md) used by the [run](run.md)
# string
## Chainable Ops
string-notEqual
Determines inequality of two values.
| Argument | |
| :--- | :--- |
| `lhs` | The first value to compare. |
| `rhs` | The second value to compare. |
#### Return Value
Whether the two values are not equal.
string-add
Concatenates two [strings](string.md)
| Argument | |
| :--- | :--- |
| `lhs` | The first [string](string.md) |
| `rhs` | The second [string](string.md) |
#### Return Value
The concatenated [string](string.md)
string-equal
Determines equality of two values.
| Argument | |
| :--- | :--- |
| `lhs` | The first value to compare. |
| `rhs` | The second value to compare. |
#### Return Value
Whether the two values are equal.
string-append
Appends a suffix to a [string](string.md)
| Argument | |
| :--- | :--- |
| `str` | The [string](string.md) to append to |
| `suffix` | The suffix to append |
#### Return Value
The [string](string.md) with the suffix appended
string-contains
Checks if a [string](string.md) contains a substring
| Argument | |
| :--- | :--- |
| `str` | The [string](string.md) to check |
| `sub` | The substring to check for |
#### Return Value
Whether the [string](string.md) contains the substring
string-endsWith
Checks if a [string](string.md) ends with a suffix
| Argument | |
| :--- | :--- |
| `str` | The [string](string.md) to check |
| `suffix` | The suffix to check for |
#### Return Value
Whether the [string](string.md) ends with the suffix
string-findAll
Finds all occurrences of a substring in a [string](string.md)
| Argument | |
| :--- | :--- |
| `str` | The [string](string.md) to find occurrences of the substring in |
| `sub` | The substring to find |
#### Return Value
The _list_ of indices of the substring in the [string](string.md)
string-isAlnum
Checks if a [string](string.md) is alphanumeric
| Argument | |
| :--- | :--- |
| `str` | The [string](string.md) to check |
#### Return Value
Whether the [string](string.md) is alphanumeric
string-isAlpha
Checks if a [string](string.md) is alphabetic
| Argument | |
| :--- | :--- |
| `str` | The [string](string.md) to check |
#### Return Value
Whether the [string](string.md) is alphabetic
string-isNumeric
Checks if a [string](string.md) is numeric
| Argument | |
| :--- | :--- |
| `str` | The [string](string.md) to check |
#### Return Value
Whether the [string](string.md) is numeric
string-lStrip
Strip leading whitespace
| Argument | |
| :--- | :--- |
| `str` | The [string](string.md) to strip. |
#### Return Value
The stripped [string](string.md).
string-len
Returns the length of a [string](string.md)
| Argument | |
| :--- | :--- |
| `str` | The [string](string.md) to check |
#### Return Value
The length of the [string](string.md)
string-lower
Converts a [string](string.md) to lowercase
| Argument | |
| :--- | :--- |
| `str` | The [string](string.md) to convert to lowercase |
#### Return Value
The lowercase [string](string.md)
string-partition
Partitions a [string](string.md) into a _list_ of the [strings](string.md)
| Argument | |
| :--- | :--- |
| `str` | The [string](string.md) to split |
| `sep` | The separator to split on |
#### Return Value
A _list_ of [strings](string.md): the [string](string.md) before the separator, the separator, and the [string](string.md) after the separator
string-prepend
Prepends a prefix to a [string](string.md)
| Argument | |
| :--- | :--- |
| `str` | The [string](string.md) to prepend to |
| `prefix` | The prefix to prepend |
#### Return Value
The [string](string.md) with the prefix prepended
string-rStrip
Strip trailing whitespace
| Argument | |
| :--- | :--- |
| `str` | The [string](string.md) to strip. |
#### Return Value
The stripped [string](string.md).
string-replace
Replaces all occurrences of a substring in a [string](string.md)
| Argument | |
| :--- | :--- |
| `str` | The [string](string.md) to replace contents of |
| `sub` | The substring to replace |
| `newSub` | The substring to replace the old substring with |
#### Return Value
The [string](string.md) with the replacements
string-slice
Slices a [string](string.md) into a substring based on beginning and end indices
| Argument | |
| :--- | :--- |
| `str` | The [string](string.md) to slice |
| `begin` | The beginning index of the substring |
| `end` | The ending index of the substring |
#### Return Value
The substring
string-split
Splits a [string](string.md) into a _list_ of [strings](string.md)
| Argument | |
| :--- | :--- |
| `str` | The [string](string.md) to split |
| `sep` | The separator to split on |
#### Return Value
The _list_ of [strings](string.md)
string-startsWith
Checks if a [string](string.md) starts with a prefix
| Argument | |
| :--- | :--- |
| `str` | The [string](string.md) to check |
| `prefix` | The prefix to check for |
#### Return Value
Whether the [string](string.md) starts with the prefix
string-strip
Strip whitespace from both ends of a [string](string.md).
| Argument | |
| :--- | :--- |
| `str` | The [string](string.md) to strip. |
#### Return Value
The stripped [string](string.md).
string-upper
Converts a [string](string.md) to uppercase
| Argument | |
| :--- | :--- |
| `str` | The [string](string.md) to convert to uppercase |
#### Return Value
The uppercase [string](string.md)
string-levenshtein
Calculates the Levenshtein distance between two [strings](string.md).
| Argument | |
| :--- | :--- |
| `str1` | The first [string](string.md). |
| `str2` | The second [string](string.md). |
#### Return Value
The Levenshtein distance between the two [strings](string.md).
## List Ops
string-notEqual
Determines inequality of two values.
| Argument | |
| :--- | :--- |
| `lhs` | The first value to compare. |
| `rhs` | The second value to compare. |
#### Return Value
Whether the two values are not equal.
string-add
Concatenates two [strings](string.md)
| Argument | |
| :--- | :--- |
| `lhs` | The first [string](string.md) |
| `rhs` | The second [string](string.md) |
#### Return Value
The concatenated [string](string.md)
string-equal
Determines equality of two values.
| Argument | |
| :--- | :--- |
| `lhs` | The first value to compare. |
| `rhs` | The second value to compare. |
#### Return Value
Whether the two values are equal.
string-append
Appends a suffix to a [string](string.md)
| Argument | |
| :--- | :--- |
| `str` | The [string](string.md) to append to |
| `suffix` | The suffix to append |
#### Return Value
The [string](string.md) with the suffix appended
string-contains
Checks if a [string](string.md) contains a substring
| Argument | |
| :--- | :--- |
| `str` | The [string](string.md) to check |
| `sub` | The substring to check for |
#### Return Value
Whether the [string](string.md) contains the substring
string-endsWith
Checks if a [string](string.md) ends with a suffix
| Argument | |
| :--- | :--- |
| `str` | The [string](string.md) to check |
| `suffix` | The suffix to check for |
#### Return Value
Whether the [string](string.md) ends with the suffix
string-findAll
Finds all occurrences of a substring in a [string](string.md)
| Argument | |
| :--- | :--- |
| `str` | The [string](string.md) to find occurrences of the substring in |
| `sub` | The substring to find |
#### Return Value
The _list_ of indices of the substring in the [string](string.md)
string-isAlnum
Checks if a [string](string.md) is alphanumeric
| Argument | |
| :--- | :--- |
| `str` | The [string](string.md) to check |
#### Return Value
Whether the [string](string.md) is alphanumeric
string-isAlpha
Checks if a [string](string.md) is alphabetic
| Argument | |
| :--- | :--- |
| `str` | The [string](string.md) to check |
#### Return Value
Whether the [string](string.md) is alphabetic
string-isNumeric
Checks if a [string](string.md) is numeric
| Argument | |
| :--- | :--- |
| `str` | The [string](string.md) to check |
#### Return Value
Whether the [string](string.md) is numeric
string-lStrip
Strip leading whitespace
| Argument | |
| :--- | :--- |
| `str` | The [string](string.md) to strip. |
#### Return Value
The stripped [string](string.md).
string-len
Returns the length of a [string](string.md)
| Argument | |
| :--- | :--- |
| `str` | The [string](string.md) to check |
#### Return Value
The length of the [string](string.md)
string-lower
Converts a [string](string.md) to lowercase
| Argument | |
| :--- | :--- |
| `str` | The [string](string.md) to convert to lowercase |
#### Return Value
The lowercase [string](string.md)
string-partition
Partitions a [string](string.md) into a _list_ of the [strings](string.md)
| Argument | |
| :--- | :--- |
| `str` | The [string](string.md) to split |
| `sep` | The separator to split on |
#### Return Value
A _list_ of [strings](string.md): the [string](string.md) before the separator, the separator, and the [string](string.md) after the separator
string-prepend
Prepends a prefix to a [string](string.md)
| Argument | |
| :--- | :--- |
| `str` | The [string](string.md) to prepend to |
| `prefix` | The prefix to prepend |
#### Return Value
The [string](string.md) with the prefix prepended
string-rStrip
Strip trailing whitespace
| Argument | |
| :--- | :--- |
| `str` | The [string](string.md) to strip. |
#### Return Value
The stripped [string](string.md).
string-replace
Replaces all occurrences of a substring in a [string](string.md)
| Argument | |
| :--- | :--- |
| `str` | The [string](string.md) to replace contents of |
| `sub` | The substring to replace |
| `newSub` | The substring to replace the old substring with |
#### Return Value
The [string](string.md) with the replacements
string-slice
Slices a [string](string.md) into a substring based on beginning and end indices
| Argument | |
| :--- | :--- |
| `str` | The [string](string.md) to slice |
| `begin` | The beginning index of the substring |
| `end` | The ending index of the substring |
#### Return Value
The substring
string-split
Splits a [string](string.md) into a _list_ of [strings](string.md)
| Argument | |
| :--- | :--- |
| `str` | The [string](string.md) to split |
| `sep` | The separator to split on |
#### Return Value
The _list_ of [strings](string.md)
string-startsWith
Checks if a [string](string.md) starts with a prefix
| Argument | |
| :--- | :--- |
| `str` | The [string](string.md) to check |
| `prefix` | The prefix to check for |
#### Return Value
Whether the [string](string.md) starts with the prefix
string-strip
Strip whitespace from both ends of a [string](string.md).
| Argument | |
| :--- | :--- |
| `str` | The [string](string.md) to strip. |
#### Return Value
The stripped [string](string.md).
string-upper
Converts a [string](string.md) to uppercase
| Argument | |
| :--- | :--- |
| `str` | The [string](string.md) to convert to uppercase |
#### Return Value
The uppercase [string](string.md)
string-levenshtein
Calculates the Levenshtein distance between two [strings](string.md).
| Argument | |
| :--- | :--- |
| `str1` | The first [string](string.md). |
| `str2` | The second [string](string.md). |
#### Return Value
The Levenshtein distance between the two [strings](string.md).
# table
## Chainable Ops
asset-file
Returns the _file_ of the asset
| Argument | |
| :--- | :--- |
| `asset` | The asset |
#### Return Value
The _file_ of the asset
table-rows
Returns the rows of a _table_
| Argument | |
| :--- | :--- |
| `table` | A _table_ |
#### Return Value
The rows of the _table_
## List Ops
asset-file
Returns the _file_ of the asset
| Argument | |
| :--- | :--- |
| `asset` | The asset |
#### Return Value
The _file_ of the asset
table-rows
Returns the rows of a _table_
| Argument | |
| :--- | :--- |
| `table` | A _table_ |
#### Return Value
The rows of the _table_
# user
## Chainable Ops
user-username
Returns the username of the [user](user.md)
| Argument | |
| :--- | :--- |
| `user` | A [user](user.md) |
#### Return Value
The username of the [user](user.md)
## List Ops
user-username
Returns the username of the [user](user.md)
| Argument | |
| :--- | :--- |
| `user` | A [user](user.md) |
#### Return Value
The username of the [user](user.md)
# video-file
## Chainable Ops
asset-file
Returns the _file_ of the asset
| Argument | |
| :--- | :--- |
| `asset` | The asset |
#### Return Value
The _file_ of the asset
## List Ops
asset-file
Returns the _file_ of the asset
| Argument | |
| :--- | :--- |
| `asset` | The asset |
#### Return Value
The _file_ of the asset
# Tutorials
> Get started using Weights & Biases with interactive tutorials.
## Fundamentals
The following tutorials take you through the fundamentals of W&B for machine learning experiment tracking, model evaluation, hyperparameter tuning, model and dataset versioning, and more.
{{< cardpane >}}
{{< card >}}
Use W&B Sweeps to create an organized way to automatically search through combinations of hyperparameter values such as the learning rate, batch size, number of hidden layers, and more.
Track your ML experiment pipelines using W&B Artifacts.
{{< /card >}}
{{< /cardpane >}}
## Popular ML framework tutorials
See the following tutorials for step by step information on how to use popular ML frameworks and libraries with W&B:
{{< cardpane >}}
{{< card >}}
Use W&B and XGBoost for machine learning experiment tracking, dataset versioning, and project collaboration.
{{< /card >}}
{{< /cardpane >}}
## Other resources
Visit the W&B AI Academy to learn how to train, fine-tune and use LLMs in your applications. Implement MLOps and LLMOps solutions. Tackle real-world ML challenges with W&B courses.
- Large Language Models (LLMs)
- [LLM Engineering: Structured Outputs](https://www.wandb.courses/courses/steering-language-models?utm_source=wandb_docs&utm_medium=code&utm_campaign=tutorials)
- [Building LLM-Powered Apps](https://www.wandb.courses/courses/building-llm-powered-apps?utm_source=wandb_docs&utm_medium=code&utm_campaign=tutorials)
- [Training and Fine-tuning Large Language Models](https://www.wandb.courses/courses/training-fine-tuning-LLMs?utm_source=wandb_docs&utm_medium=code&utm_campaign=tutorials)
- Effective MLOps
- [Model CI/CD](https://www.wandb.courses/courses/enterprise-model-management?utm_source=wandb_docs&utm_medium=code&utm_campaign=tutorials)
- [Effective MLOps: Model Development](https://www.wandb.courses/courses/effective-mlops-model-development?utm_source=wandb_docs&utm_medium=code&utm_campaign=tutorials)
- [CI/CD for Machine Learning (GitOps)](https://www.wandb.courses/courses/ci-cd-for-machine-learning?utm_source=wandb_docs&utm_medium=code&utm_campaign=tutorials)
- [Data Validation in Production ML Pipelines](https://www.wandb.courses/courses/data-validation-for-machine-learning?utm_source=wandb_docs&utm_medium=code&utm_campaign=tutorials)
- [Machine Learning for Business Decision Optimization](https://www.wandb.courses/courses/decision-optimization?utm_source=wandb_docs&utm_medium=code&utm_campaign=tutorials)
- W&B Models
- [W&B 101](https://wandb.ai/site/courses/101/?utm_source=wandb_docs&utm_medium=code&utm_campaign=tutorials)
- [W&B 201: Model Registry](https://www.wandb.courses/courses/201-model-registry?utm_source=wandb_docs&utm_medium=code&utm_campaign=tutorials)
# Track experiments
{{< cta-button
colabLink="https://colab.research.google.com/github/wandb/examples/blob/master/colabs/intro/Intro_to_Weights_&_Biases.ipynb"
>}}
Use [W&B](https://wandb.ai/site) for machine learning experiment tracking, model checkpointing, collaboration with your team and more.
In this notebook, you will create and track a machine learning experiment using a simple PyTorch model. By the end of the notebook, you will have an interactive project dashboard that you can share and customize with other members of your team. [View an example dashboard here](https://wandb.ai/wandb/wandb_example).
## Prerequisites
Install the W&B Python SDK and log in:
```shell
!pip install wandb -qU
```
```python
# Log in to your W&B account
import wandb
import random
import math
# Use wandb-core, temporary for wandb's new backend
wandb.require("core")
```
```python
wandb.login()
```
## Simulate and track a machine learning experiment with W&B
Create, track, and visualize a machine learning experiment. To do this:
1. Initialize a [W&B run]({{< relref "/guides/models/track/runs/" >}}) and pass in the hyperparameters you want to track.
2. Within your training loop, log metrics such as the accuruacy and loss.
```
import random
import math
# Launch 5 simulated experiments
total_runs = 5
for run in range(total_runs):
# 1️. Start a new run to track this script
wandb.init(
# Set the project where this run will be logged
project="basic-intro",
# We pass a run name (otherwise it’ll be randomly assigned, like sunshine-lollypop-10)
name=f"experiment_{run}",
# Track hyperparameters and run metadata
config={
"learning_rate": 0.02,
"architecture": "CNN",
"dataset": "CIFAR-100",
"epochs": 10,
})
# This simple block simulates a training loop logging metrics
epochs = 10
offset = random.random() / 5
for epoch in range(2, epochs):
acc = 1 - 2 ** -epoch - random.random() / epoch - offset
loss = 2 ** -epoch + random.random() / epoch + offset
# 2️. Log metrics from your script to W&B
wandb.log({"acc": acc, "loss": loss})
# Mark the run as finished
wandb.finish()
```
View how your machine learning peformed in your W&B project. Copy and paste the URL link that is printed from the previous cell. The URL will redirect you to a W&B project that contains a dashboard showing graphs the show how
The following image shows what a dashboard can look like:
{{< img src="/images/tutorials/experiments-1.png" alt="" >}}
Now that we know how to integrate W&B into a psuedo machine learning training loop, let's track a machine learning experiment using a basic PyTorch neural network. The following code will also upload model checkpoints to W&B that you can then share with other teams in your organization.
## Track a machine learning experiment using Pytorch
The following code cell defines and trains a simple MNIST classifier. During training, you will see W&B prints out URLs. Click on the project page link to see your results stream in live to a W&B project.
W&B runs automatically log [metrics]({{< relref "/guides/models/track/runs/#workspace-tab" >}}),
system information,
[hyperparameters]({{< relref "/guides/models/track/runs/#overview-tab" >}}),
[terminal output]({{< relref "/guides/models/track/runs/#logs-tab" >}}) and
you'll see an [interactive table]({{< relref "/guides/models/tables/" >}})
with model inputs and outputs.
### Set up PyTorch Dataloader
The following cell defines some useful functions that we will need to train our machine learning model. The functions themselves are not unique to W&B so we'll not cover them in detail here. See the PyTorch documentation for more information on how to define [forward and backward training loop](https://pytorch.org/tutorials/beginner/nn_tutorial.html), how to use [PyTorch DataLoaders](https://pytorch.org/tutorials/beginner/basics/data_tutorial.html) to load data in for training, and how define PyTorch models using the [`torch.nn.Sequential` Class](https://pytorch.org/docs/stable/generated/torch.nn.Sequential.html).
```python
# @title
import torch, torchvision
import torch.nn as nn
from torchvision.datasets import MNIST
import torchvision.transforms as T
MNIST.mirrors = [
mirror for mirror in MNIST.mirrors if "http://yann.lecun.com/" not in mirror
]
device = "cuda:0" if torch.cuda.is_available() else "cpu"
def get_dataloader(is_train, batch_size, slice=5):
"Get a training dataloader"
full_dataset = MNIST(
root=".", train=is_train, transform=T.ToTensor(), download=True
)
sub_dataset = torch.utils.data.Subset(
full_dataset, indices=range(0, len(full_dataset), slice)
)
loader = torch.utils.data.DataLoader(
dataset=sub_dataset,
batch_size=batch_size,
shuffle=True if is_train else False,
pin_memory=True,
num_workers=2,
)
return loader
def get_model(dropout):
"A simple model"
model = nn.Sequential(
nn.Flatten(),
nn.Linear(28 * 28, 256),
nn.BatchNorm1d(256),
nn.ReLU(),
nn.Dropout(dropout),
nn.Linear(256, 10),
).to(device)
return model
def validate_model(model, valid_dl, loss_func, log_images=False, batch_idx=0):
"Compute performance of the model on the validation dataset and log a wandb.Table"
model.eval()
val_loss = 0.0
with torch.inference_mode():
correct = 0
for i, (images, labels) in enumerate(valid_dl):
images, labels = images.to(device), labels.to(device)
# Forward pass ➡
outputs = model(images)
val_loss += loss_func(outputs, labels) * labels.size(0)
# Compute accuracy and accumulate
_, predicted = torch.max(outputs.data, 1)
correct += (predicted == labels).sum().item()
# Log one batch of images to the dashboard, always same batch_idx.
if i == batch_idx and log_images:
log_image_table(images, predicted, labels, outputs.softmax(dim=1))
return val_loss / len(valid_dl.dataset), correct / len(valid_dl.dataset)
```
### Create a teble to compare the predicted values versus the true value
The following cell is unique to W&B, so let's go over it.
In the cell we define a function called `log_image_table`. Though technically, optional, this function creates a W&B Table object. We will use the table object to create a table that shows what the model predicted for each image.
More specifically, each row will conists of the image fed to the model, along with predicted value and the actual value (label).
```python
def log_image_table(images, predicted, labels, probs):
"Log a wandb.Table with (img, pred, target, scores)"
# Create a wandb Table to log images, labels and predictions to
table = wandb.Table(
columns=["image", "pred", "target"] + [f"score_{i}" for i in range(10)]
)
for img, pred, targ, prob in zip(
images.to("cpu"), predicted.to("cpu"), labels.to("cpu"), probs.to("cpu")
):
table.add_data(wandb.Image(img[0].numpy() * 255), pred, targ, *prob.numpy())
wandb.log({"predictions_table": table}, commit=False)
```
### Train your model and upload checkpoints
The following code trains and saves model checkpoints to your project. Use model checkpoints like you normally would to assess how the model performed during training.
W&B also makes it easy to share your saved models and model checkpoints with other members of your team or organization. To learn how to share your model and model checkpoints with members outside of your team, see [W&B Registry]({{< relref "/guides/core/registry/" >}}).
```python
# Launch 3 experiments, trying different dropout rates
for _ in range(3):
# initialise a wandb run
wandb.init(
project="pytorch-intro",
config={
"epochs": 5,
"batch_size": 128,
"lr": 1e-3,
"dropout": random.uniform(0.01, 0.80),
},
)
# Copy your config
config = wandb.config
# Get the data
train_dl = get_dataloader(is_train=True, batch_size=config.batch_size)
valid_dl = get_dataloader(is_train=False, batch_size=2 * config.batch_size)
n_steps_per_epoch = math.ceil(len(train_dl.dataset) / config.batch_size)
# A simple MLP model
model = get_model(config.dropout)
# Make the loss and optimizer
loss_func = nn.CrossEntropyLoss()
optimizer = torch.optim.Adam(model.parameters(), lr=config.lr)
# Training
example_ct = 0
step_ct = 0
for epoch in range(config.epochs):
model.train()
for step, (images, labels) in enumerate(train_dl):
images, labels = images.to(device), labels.to(device)
outputs = model(images)
train_loss = loss_func(outputs, labels)
optimizer.zero_grad()
train_loss.backward()
optimizer.step()
example_ct += len(images)
metrics = {
"train/train_loss": train_loss,
"train/epoch": (step + 1 + (n_steps_per_epoch * epoch))
/ n_steps_per_epoch,
"train/example_ct": example_ct,
}
if step + 1 < n_steps_per_epoch:
# Log train metrics to wandb
wandb.log(metrics)
step_ct += 1
val_loss, accuracy = validate_model(
model, valid_dl, loss_func, log_images=(epoch == (config.epochs - 1))
)
# Log train and validation metrics to wandb
val_metrics = {"val/val_loss": val_loss, "val/val_accuracy": accuracy}
wandb.log({**metrics, **val_metrics})
# Save the model checkpoint to wandb
torch.save(model, "my_model.pt")
wandb.log_model(
"./my_model.pt",
"my_mnist_model",
aliases=[f"epoch-{epoch+1}_dropout-{round(wandb.config.dropout, 4)}"],
)
print(
f"Epoch: {epoch+1}, Train Loss: {train_loss:.3f}, Valid Loss: {val_loss:3f}, Accuracy: {accuracy:.2f}"
)
# If you had a test set, this is how you could log it as a Summary metric
wandb.summary["test_accuracy"] = 0.8
# Close your wandb run
wandb.finish()
```
You have now trained your first model using W&B. Click on one of the links above to see your metrics and see your saved model checkpoints in the Artifacts tab in the W&B App UI
## (Optional) Set up a W&B Alert
Create a [W&B Alerts]({{< relref "/guides/models/track/runs/alert/" >}}) to send alerts to your Slack or email from your Python code.
There are 2 steps to follow the first time you'd like to send a Slack or email alert, triggered from your code:
1) Turn on Alerts in your W&B [User Settings](https://wandb.ai/settings)
2) Add `wandb.alert()` to your code. For example:
```python
wandb.alert(title="Low accuracy", text=f"Accuracy is below the acceptable threshold")
```
The following cell shows a minimal example below to see how to use `wandb.alert`
```python
# Start a wandb run
wandb.init(project="pytorch-intro")
# Simulating a model training loop
acc_threshold = 0.3
for training_step in range(1000):
# Generate a random number for accuracy
accuracy = round(random.random() + random.random(), 3)
print(f"Accuracy is: {accuracy}, {acc_threshold}")
# Log accuracy to wandb
wandb.log({"Accuracy": accuracy})
# If the accuracy is below the threshold, fire a W&B Alert and stop the run
if accuracy <= acc_threshold:
# Send the wandb Alert
wandb.alert(
title="Low Accuracy",
text=f"Accuracy {accuracy} at step {training_step} is below the acceptable theshold, {acc_threshold}",
)
print("Alert triggered")
break
# Mark the run as finished (useful in Jupyter notebooks)
wandb.finish()
```
You can find the full docs for [W&B Alerts here]({{< relref "/guides/models/track/runs/alert" >}}).
## Next steps
The next tutorial you will learn how to do hyperparameter optimization using W&B Sweeps:
[Hyperparameters sweeps using PyTorch](https://colab.research.google.com/github/wandb/examples/blob/master/colabs/pytorch/Organizing_Hyperparameter_Sweeps_in_PyTorch_with_W%26B.ipynb)
# Visualize predictions with tables
{{< cta-button colabLink="https://colab.research.google.com/github/wandb/examples/blob/master/colabs/datasets-predictions/W&B_Tables_Quickstart.ipynb" >}}
This covers how to track, visualize, and compare model predictions over the course of training, using PyTorch on MNIST data.
You will learn how to:
1. Log metrics, images, text, etc. to a `wandb.Table()` during model training or evaluation
2. View, sort, filter, group, join, interactively query, and explore these tables
3. Compare model predictions or results: dynamically across specific images, hyperparameters/model versions, or time steps.
## Examples
### Compare predicted scores for specific images
[Live example: compare predictions after 1 vs 5 epochs of training →](https://wandb.ai/stacey/table-quickstart/reports/CNN-2-Progress-over-Training-Time--Vmlldzo3NDY5ODU#compare-predictions-after-1-vs-5-epochs)
{{< img src="/images/tutorials/tables-1.png" alt="1 epoch vs 5 epochs of training" >}}
The histograms compare per-class scores between the two models. The top green bar in each histogram represents model "CNN-2, 1 epoch" (id 0), which only trained for 1 epoch. The bottom purple bar represents model "CNN-2, 5 epochs" (id 1), which trained for 5 epochs. The images are filtered to cases where the models disagree. For example, in the first row, the "4" gets high scores across all the possible digits after 1 epoch, but after 5 epochs it scores highest on the correct label and very low on the rest.
### Focus on top errors over time
[Live example →](https://wandb.ai/stacey/table-quickstart/reports/CNN-2-Progress-over-Training-Time--Vmlldzo3NDY5ODU#top-errors-over-time)
See incorrect predictions (filter to rows where "guess" != "truth") on the full test data. Note that there are 229 wrong guesses after 1 training epoch, but only 98 after 5 epochs.
{{< img src="/images/tutorials/tables-2.png" alt="side by side, 1 vs 5 epochs of training" >}}
### Compare model performance and find patterns
[See full detail in a live example →](https://wandb.ai/stacey/table-quickstart/reports/CNN-2-Progress-over-Training-Time--Vmlldzo3NDY5ODU#false-positives-grouped-by-guess)
Filter out correct answers, then group by the guess to see examples of misclassified images and the underlying distribution of true labels—for two models side-by-side. A model variant with 2X the layer sizes and learning rate is on the left, and the baseline is on the right. Note that the baseline makes slightly more mistakes for each guessed class.
{{< img src="/images/tutorials/tables-3.png" alt="grouped errors for baseline vs double variant" >}}
## Sign up or login
[Sign up or login](https://wandb.ai/login) to W&B to see and interact with your experiments in the browser.
In this example we're using Google Colab as a convenient hosted environment, but you can run your own training scripts from anywhere and visualize metrics with W&B's experiment tracking tool.
```python
!pip install wandb -qqq
```
log to your account
```python
import wandb
wandb.login()
WANDB_PROJECT = "mnist-viz"
```
## 0. Setup
Install dependencies, download MNIST, and create train and test datasets using PyTorch.
```python
import torch
import torch.nn as nn
import torchvision
import torchvision.transforms as T
import torch.nn.functional as F
device = "cuda:0" if torch.cuda.is_available() else "cpu"
# create train and test dataloaders
def get_dataloader(is_train, batch_size, slice=5):
"Get a training dataloader"
ds = torchvision.datasets.MNIST(root=".", train=is_train, transform=T.ToTensor(), download=True)
loader = torch.utils.data.DataLoader(dataset=ds,
batch_size=batch_size,
shuffle=True if is_train else False,
pin_memory=True, num_workers=2)
return loader
```
## 1. Define the model and training schedule
* Set the number of epochs to run, where each epoch consists of a training step and a validation (test) step. Optionally configure the amount of data to log per test step. Here the number of batches and number of images per batch to visualize are set low to simplify the demo.
* Define a simple convolutional neural net (following [pytorch-tutorial](https://github.com/yunjey/pytorch-tutorial) code).
* Load in train and test sets using PyTorch
```python
# Number of epochs to run
# Each epoch includes a training step and a test step, so this sets
# the number of tables of test predictions to log
EPOCHS = 1
# Number of batches to log from the test data for each test step
# (default set low to simplify demo)
NUM_BATCHES_TO_LOG = 10 #79
# Number of images to log per test batch
# (default set low to simplify demo)
NUM_IMAGES_PER_BATCH = 32 #128
# training configuration and hyperparameters
NUM_CLASSES = 10
BATCH_SIZE = 32
LEARNING_RATE = 0.001
L1_SIZE = 32
L2_SIZE = 64
# changing this may require changing the shape of adjacent layers
CONV_KERNEL_SIZE = 5
# define a two-layer convolutional neural network
class ConvNet(nn.Module):
def __init__(self, num_classes=10):
super(ConvNet, self).__init__()
self.layer1 = nn.Sequential(
nn.Conv2d(1, L1_SIZE, CONV_KERNEL_SIZE, stride=1, padding=2),
nn.BatchNorm2d(L1_SIZE),
nn.ReLU(),
nn.MaxPool2d(kernel_size=2, stride=2))
self.layer2 = nn.Sequential(
nn.Conv2d(L1_SIZE, L2_SIZE, CONV_KERNEL_SIZE, stride=1, padding=2),
nn.BatchNorm2d(L2_SIZE),
nn.ReLU(),
nn.MaxPool2d(kernel_size=2, stride=2))
self.fc = nn.Linear(7*7*L2_SIZE, NUM_CLASSES)
self.softmax = nn.Softmax(NUM_CLASSES)
def forward(self, x):
# uncomment to see the shape of a given layer:
#print("x: ", x.size())
out = self.layer1(x)
out = self.layer2(out)
out = out.reshape(out.size(0), -1)
out = self.fc(out)
return out
train_loader = get_dataloader(is_train=True, batch_size=BATCH_SIZE)
test_loader = get_dataloader(is_train=False, batch_size=2*BATCH_SIZE)
device = torch.device("cuda:0" if torch.cuda.is_available() else "cpu")
```
## 2. Run training and log test predictions
For every epoch, run a training step and a test step. For each test step, create a `wandb.Table()` in which to store test predictions. These can be visualized, dynamically queried, and compared side by side in your browser.
```python
# W&B: Initialize a new run to track this model's training
wandb.init(project="table-quickstart")
# W&B: Log hyperparameters using config
cfg = wandb.config
cfg.update({"epochs" : EPOCHS, "batch_size": BATCH_SIZE, "lr" : LEARNING_RATE,
"l1_size" : L1_SIZE, "l2_size": L2_SIZE,
"conv_kernel" : CONV_KERNEL_SIZE,
"img_count" : min(10000, NUM_IMAGES_PER_BATCH*NUM_BATCHES_TO_LOG)})
# define model, loss, and optimizer
model = ConvNet(NUM_CLASSES).to(device)
criterion = nn.CrossEntropyLoss()
optimizer = torch.optim.Adam(model.parameters(), lr=LEARNING_RATE)
# convenience funtion to log predictions for a batch of test images
def log_test_predictions(images, labels, outputs, predicted, test_table, log_counter):
# obtain confidence scores for all classes
scores = F.softmax(outputs.data, dim=1)
log_scores = scores.cpu().numpy()
log_images = images.cpu().numpy()
log_labels = labels.cpu().numpy()
log_preds = predicted.cpu().numpy()
# adding ids based on the order of the images
_id = 0
for i, l, p, s in zip(log_images, log_labels, log_preds, log_scores):
# add required info to data table:
# id, image pixels, model's guess, true label, scores for all classes
img_id = str(_id) + "_" + str(log_counter)
test_table.add_data(img_id, wandb.Image(i), p, l, *s)
_id += 1
if _id == NUM_IMAGES_PER_BATCH:
break
# train the model
total_step = len(train_loader)
for epoch in range(EPOCHS):
# training step
for i, (images, labels) in enumerate(train_loader):
images = images.to(device)
labels = labels.to(device)
# forward pass
outputs = model(images)
loss = criterion(outputs, labels)
# backward and optimize
optimizer.zero_grad()
loss.backward()
optimizer.step()
# W&B: Log loss over training steps, visualized in the UI live
wandb.log({"loss" : loss})
if (i+1) % 100 == 0:
print ('Epoch [{}/{}], Step [{}/{}], Loss: {:.4f}'
.format(epoch+1, EPOCHS, i+1, total_step, loss.item()))
# W&B: Create a Table to store predictions for each test step
columns=["id", "image", "guess", "truth"]
for digit in range(10):
columns.append("score_" + str(digit))
test_table = wandb.Table(columns=columns)
# test the model
model.eval()
log_counter = 0
with torch.no_grad():
correct = 0
total = 0
for images, labels in test_loader:
images = images.to(device)
labels = labels.to(device)
outputs = model(images)
_, predicted = torch.max(outputs.data, 1)
if log_counter < NUM_BATCHES_TO_LOG:
log_test_predictions(images, labels, outputs, predicted, test_table, log_counter)
log_counter += 1
total += labels.size(0)
correct += (predicted == labels).sum().item()
acc = 100 * correct / total
# W&B: Log accuracy across training epochs, to visualize in the UI
wandb.log({"epoch" : epoch, "acc" : acc})
print('Test Accuracy of the model on the 10000 test images: {} %'.format(acc))
# W&B: Log predictions table to wandb
wandb.log({"test_predictions" : test_table})
# W&B: Mark the run as complete (useful for multi-cell notebook)
wandb.finish()
```
## What's next?
The next tutorial, you will learn [how to optimize hyperparameters using W&B Sweeps]({{< relref "sweeps.md" >}}).
# Tune hyperparameters with sweeps
{{< cta-button colabLink="https://colab.research.google.com/github/wandb/examples/blob/master/colabs/pytorch/Organizing_Hyperparameter_Sweeps_in_PyTorch_with_W&B.ipynb" >}}
Finding a machine learning model that meets your desired metric (such as model accuracy) is normally a redundant task that can take multiple iterations. To make matters worse, it might be unclear which hyperparameter combinations to use for a given training run.
Use W&B Sweeps to create an organized and efficient way to automatically search through combinations of hyperparameter values such as the learning rate, batch size, number of hidden layers, optimizer type and more to find values that optimize your model based on your desired metric.
In this tutorial you will create a hyperparameter search with W&B PyTorch integration. Follow along with a [video tutorial](http://wandb.me/sweeps-video).
{{< img src="/images/tutorials/sweeps-1.png" alt="" >}}
## Sweeps: An Overview
Running a hyperparameter sweep with Weights & Biases is very easy. There are just 3 simple steps:
1. **Define the sweep:** we do this by creating a dictionary or a [YAML file]({{< relref "/guides/models/sweeps/define-sweep-configuration" >}}) that specifies the parameters to search through, the search strategy, the optimization metric et all.
2. **Initialize the sweep:** with one line of code we initialize the sweep and pass in the dictionary of sweep configurations:
`sweep_id = wandb.sweep(sweep_config)`
3. **Run the sweep agent:** also accomplished with one line of code, we call `wandb.agent()` and pass the `sweep_id` to run, along with a function that defines your model architecture and trains it:
`wandb.agent(sweep_id, function=train)`
## Before you get started
Install W&B and import the W&B Python SDK into your notebook:
1. Install with `!pip install`:
```
!pip install wandb -Uq
```
2. Import W&B:
```
import wandb
```
3. Log in to W&B and provide your API key when prompted:
```
wandb.login()
```
## Step 1️: Define a sweep
A W&B Sweep combines a strategy for trying numerous hyperparameter values with the code that evaluates them.
Before you start a sweep, you must define your sweep strategy with a _sweep configuration_.
{{% alert %}}
The sweep configuration you create for a sweep must be in a nested dictionary if you start a sweep in a Jupyter Notebook.
If you run a sweep within the command line, you must specify your sweep config with a [YAML file]({{< relref "/guides/models/sweeps/define-sweep-configuration" >}}).
{{% /alert %}}
### Pick a search method
First, specify a hyperparameter search method within your configuration dictionary. [There are three hyperparameter search strategies to choose from: grid, random, and Bayesian search]({{< relref "/guides/models/sweeps/define-sweep-configuration/sweep-config-keys/#method" >}}).
For this tutorial, you will use a random search. Within your notebook, create a dictionary and specify `random` for the `method` key.
```
sweep_config = {
'method': 'random'
}
```
Specify a metric that you want to optimize for. You do not need to specify the metric and goal for sweeps that use random search method. However, it is good practice to keep track of your sweep goals because you can refer to it at a later time.
```
metric = {
'name': 'loss',
'goal': 'minimize'
}
sweep_config['metric'] = metric
```
### Specify hyperparameters to search through
Now that you have a search method specified in your sweep configuration, specify the hyperparameters you want to search over.
To do this, specify one or more hyperparameter names to the `parameter` key and specify one or more hyperparameter values for the `value` key.
The values you search through for a given hyperparamter depend on the type of hyperparameter you are investigating.
For example, if you choose a machine learning optimizer, you must specify one or more finite optimizer names such as the Adam optimizer and stochastic gradient dissent.
```
parameters_dict = {
'optimizer': {
'values': ['adam', 'sgd']
},
'fc_layer_size': {
'values': [128, 256, 512]
},
'dropout': {
'values': [0.3, 0.4, 0.5]
},
}
sweep_config['parameters'] = parameters_dict
```
Sometimes you want to track a hyperparameter, but not vary its value. In this case, add the hyperparameter to your sweep configuration and specify the exact value that you want to use. For example, in the following code cell, `epochs` is set to 1.
```
parameters_dict.update({
'epochs': {
'value': 1}
})
```
For a `random` search,
all the `values` of a parameter are equally likely to be chosen on a given run.
Alternatively,
you can specify a named `distribution`,
plus its parameters, like the mean `mu`
and standard deviation `sigma` of a `normal` distribution.
```
parameters_dict.update({
'learning_rate': {
# a flat distribution between 0 and 0.1
'distribution': 'uniform',
'min': 0,
'max': 0.1
},
'batch_size': {
# integers between 32 and 256
# with evenly-distributed logarithms
'distribution': 'q_log_uniform_values',
'q': 8,
'min': 32,
'max': 256,
}
})
```
When we're finished, `sweep_config` is a nested dictionary
that specifies exactly which `parameters` we're interested in trying
and the `method` we're going to use to try them.
Let's see how the sweep configuration looks like:
```
import pprint
pprint.pprint(sweep_config)
```
For a full list of configuration options, see [Sweep configuration options]({{< relref "/guides/models/sweeps/define-sweep-configuration/sweep-config-keys/" >}}).
{{% alert %}}
For hyperparameters that have potentially infinite options,
it usually makes sense to try out
a few select `values`. For example, the preceding sweep configuration has a list of finite values specified for the `layer_size` and `dropout` parameter keys.
{{% /alert %}}
## Step 2️: Initialize the Sweep
Once you've defined the search strategy, it's time to set up something to implement it.
W&B uses a Sweep Controller to manage sweeps on the cloud or locally across one or more machines. For this tutorial, you will use a sweep controller managed by W&B.
While sweep controllers manage sweeps, the component that actually executes a sweep is known as a _sweep agent_.
{{% alert %}}
By default, sweep controllers components are initiated on W&B's servers and sweep agents, the component that creates sweeps, are activated on your local machine.
{{% /alert %}}
Within your notebook, you can activate a sweep controller with the `wandb.sweep` method. Pass your sweep configuration dictionary you defined earlier to the `sweep_config` field:
```
sweep_id = wandb.sweep(sweep_config, project="pytorch-sweeps-demo")
```
The `wandb.sweep` function returns a `sweep_id` that you will use at a later step to activate your sweep.
{{% alert %}}
On the command line, this function is replaced with
```python
wandb sweep config.yaml
```
{{% /alert %}}
For more information on how to create W&B Sweeps in a terminal, see the [W&B Sweep walkthrough]({{< relref "/guides/models/sweeps/walkthrough" >}}).
## Step 3: Define your machine learning code
Before you execute the sweep,
define the training procedure that uses the hyperparameter values you want to try. The key to integrating W&B Sweeps into your training code is to ensure that, for each training experiment, that your training logic can access the hyperparameter values you defined in your sweep configuration.
In the proceeding code example, the helper functions `build_dataset`, `build_network`, `build_optimizer`, and `train_epoch` access the sweep hyperparameter configuration dictionary.
Run the proceeding machine learning training code in your notebook. The functions define a basic fully connected neural network in PyTorch.
```python
import torch
import torch.optim as optim
import torch.nn.functional as F
import torch.nn as nn
from torchvision import datasets, transforms
device = torch.device("cuda" if torch.cuda.is_available() else "cpu")
def train(config=None):
# Initialize a new wandb run
with wandb.init(config=config):
# If called by wandb.agent, as below,
# this config will be set by Sweep Controller
config = wandb.config
loader = build_dataset(config.batch_size)
network = build_network(config.fc_layer_size, config.dropout)
optimizer = build_optimizer(network, config.optimizer, config.learning_rate)
for epoch in range(config.epochs):
avg_loss = train_epoch(network, loader, optimizer)
wandb.log({"loss": avg_loss, "epoch": epoch})
```
Within the `train` function, you will notice the following W&B Python SDK methods:
* [`wandb.init()`]({{< relref "/ref/python/init" >}}): Initialize a new W&B run. Each run is a single execution of the training function.
* [`wandb.config`]({{< relref "/guides/models/track/config" >}}): Pass sweep configuration with the hyperparameters you want to experiment with.
* [`wandb.log()`]({{< relref "/ref/python/log" >}}): Log the training loss for each epoch.
The proceeding cell defines four functions:
`build_dataset`, `build_network`, `build_optimizer`, and `train_epoch`.
These functions are a standard part of a basic PyTorch pipeline,
and their implementation is unaffected by the use of W&B.
```python
def build_dataset(batch_size):
transform = transforms.Compose(
[transforms.ToTensor(),
transforms.Normalize((0.1307,), (0.3081,))])
# download MNIST training dataset
dataset = datasets.MNIST(".", train=True, download=True,
transform=transform)
sub_dataset = torch.utils.data.Subset(
dataset, indices=range(0, len(dataset), 5))
loader = torch.utils.data.DataLoader(sub_dataset, batch_size=batch_size)
return loader
def build_network(fc_layer_size, dropout):
network = nn.Sequential( # fully connected, single hidden layer
nn.Flatten(),
nn.Linear(784, fc_layer_size), nn.ReLU(),
nn.Dropout(dropout),
nn.Linear(fc_layer_size, 10),
nn.LogSoftmax(dim=1))
return network.to(device)
def build_optimizer(network, optimizer, learning_rate):
if optimizer == "sgd":
optimizer = optim.SGD(network.parameters(),
lr=learning_rate, momentum=0.9)
elif optimizer == "adam":
optimizer = optim.Adam(network.parameters(),
lr=learning_rate)
return optimizer
def train_epoch(network, loader, optimizer):
cumu_loss = 0
for _, (data, target) in enumerate(loader):
data, target = data.to(device), target.to(device)
optimizer.zero_grad()
# ➡ Forward pass
loss = F.nll_loss(network(data), target)
cumu_loss += loss.item()
# ⬅ Backward pass + weight update
loss.backward()
optimizer.step()
wandb.log({"batch loss": loss.item()})
return cumu_loss / len(loader)
```
For more details on instrumenting W&B with PyTorch, see [this Colab](https://colab.research.google.com/github/wandb/examples/blob/master/colabs/pytorch/Simple_PyTorch_Integration.ipynb).
## Step 4: Activate sweep agents
Now that you have your sweep configuration defined and a training script that can utilize those hyperparameter in an interactive way, you are ready to activate a sweep agent. Sweep agents are responsible for running an experiment with a set of hyperparameter values that you defined in your sweep configuration.
Create sweep agents with the `wandb.agent` method. Provide the following:
1. The sweep the agent is a part of (`sweep_id`)
2. The function the sweep is supposed to run. In this example, the sweep will use the `train` function.
3. (optionally) How many configs to ask the sweep controller for (`count`)
{{% alert %}}
You can start multiple sweep agents with the same `sweep_id`
on different compute resources. The sweep controller ensures that they work together
according to the sweep configuration you defined.
{{% /alert %}}
The proceeding cell activates a sweep agent that runs the training function (`train`) 5 times:
```python
wandb.agent(sweep_id, train, count=5)
```
{{% alert %}}
Since the `random` search method was specified in the sweep configuration, the sweep controller provides randomly generated hyperparameter values.
{{% /alert %}}
For more information on how to create W&B Sweeps in a terminal, see the [W&B Sweep walkthrough]({{< relref "/guides/models/sweeps/walkthrough" >}}).
## Visualize Sweep Results
### Parallel Coordinates Plot
This plot maps hyperparameter values to model metrics. It’s useful for honing in on combinations of hyperparameters that led to the best model performance.
{{< img src="/images/tutorials/sweeps-2.png" alt="" >}}
### Hyperparameter Importance Plot
The hyperparameter importance plot surfaces which hyperparameters were the best predictors of your metrics.
We report feature importance (from a random forest model) and correlation (implicitly a linear model).
{{< img src="/images/tutorials/sweeps-3.png" alt="" >}}
These visualizations can help you save both time and resources running expensive hyperparameter optimizations by honing in on the parameters (and value ranges) that are the most important, and thereby worthy of further exploration.
## Learn more about W&B Sweeps
We created a simple training script and [a few flavors of sweep configs](https://github.com/wandb/examples/tree/master/examples/keras/keras-cnn-fashion) for you to play with. We highly encourage you to give these a try.
That repo also has examples to help you try more advanced sweep features like [Bayesian Hyperband](https://app.wandb.ai/wandb/examples-keras-cnn-fashion/sweeps/us0ifmrf?workspace=user-lavanyashukla), and [Hyperopt](https://app.wandb.ai/wandb/examples-keras-cnn-fashion/sweeps/xbs2wm5e?workspace=user-lavanyashukla).
# Track models and datasets
{{< cta-button colabLink="https://colab.research.google.com/github/wandb/examples/blob/master/colabs/wandb-artifacts/Pipeline_Versioning_with_W&B_Artifacts.ipynb" >}}
In this notebook, we'll show you how to track your ML experiment pipelines using W&B Artifacts.
Follow along with a [video tutorial](http://tiny.cc/wb-artifacts-video).
## About artifacts
An artifact, like a Greek [amphora](https://en.wikipedia.org/wiki/Amphora),
is a produced object -- the output of a process.
In ML, the most important artifacts are _datasets_ and _models_.
And, like the [Cross of Coronado](https://indianajones.fandom.com/wiki/Cross_of_Coronado), these important artifacts belong in a museum.
That is, they should be cataloged and organized
so that you, your team, and the ML community at large can learn from them.
After all, those who don't track training are doomed to repeat it.
Using our Artifacts API, you can log `Artifact`s as outputs of W&B `Run`s or use `Artifact`s as input to `Run`s, as in this diagram,
where a training run takes in a dataset and produces a model.
{{< img src="/images/tutorials/artifacts-diagram.png" alt="" >}}
Since one run can use another run's output as an input, `Artifact`s and `Run`s together form a directed graph (a bipartite [DAG](https://en.wikipedia.org/wiki/Directed_acyclic_graph), with nodes for `Artifact`s and `Run`s
and arrows that connect a `Run` to the `Artifact`s it consumes or produces.
## Use artifacts to track models and datatsets
### Install and Import
Artifacts are part of our Python library, starting with version `0.9.2`.
Like most parts of the ML Python stack, it's available via `pip`.
```python
# Compatible with wandb version 0.9.2+
!pip install wandb -qqq
!apt install tree
```
```python
import os
import wandb
```
### Log a Dataset
First, let's define some Artifacts.
This example is based off of this PyTorch
["Basic MNIST Example"](https://github.com/pytorch/examples/tree/master/mnist/),
but could just as easily have been done in [TensorFlow](http://wandb.me/artifacts-colab), in any other framework,
or in pure Python.
We start with the `Dataset`s:
- a `train`ing set, for choosing the parameters,
- a `validation` set, for choosing the hyperparameters,
- a `test`ing set, for evaluating the final model
The first cell below defines these three datasets.
```python
import random
import torch
import torchvision
from torch.utils.data import TensorDataset
from tqdm.auto import tqdm
# Ensure deterministic behavior
torch.backends.cudnn.deterministic = True
random.seed(0)
torch.manual_seed(0)
torch.cuda.manual_seed_all(0)
# Device configuration
device = torch.device("cuda:0" if torch.cuda.is_available() else "cpu")
# Data parameters
num_classes = 10
input_shape = (1, 28, 28)
# drop slow mirror from list of MNIST mirrors
torchvision.datasets.MNIST.mirrors = [mirror for mirror in torchvision.datasets.MNIST.mirrors
if not mirror.startswith("http://yann.lecun.com")]
def load(train_size=50_000):
"""
# Load the data
"""
# the data, split between train and test sets
train = torchvision.datasets.MNIST("./", train=True, download=True)
test = torchvision.datasets.MNIST("./", train=False, download=True)
(x_train, y_train), (x_test, y_test) = (train.data, train.targets), (test.data, test.targets)
# split off a validation set for hyperparameter tuning
x_train, x_val = x_train[:train_size], x_train[train_size:]
y_train, y_val = y_train[:train_size], y_train[train_size:]
training_set = TensorDataset(x_train, y_train)
validation_set = TensorDataset(x_val, y_val)
test_set = TensorDataset(x_test, y_test)
datasets = [training_set, validation_set, test_set]
return datasets
```
This sets up a pattern we'll see repeated in this example:
the code to log the data as an Artifact is wrapped around the code for
producing that data.
In this case, the code for `load`ing the data is
separated out from the code for `load_and_log`ging the data.
This is good practice.
In order to log these datasets as Artifacts,
we just need to
1. create a `Run` with `wandb.init`, (L4)
2. create an `Artifact` for the dataset (L10), and
3. save and log the associated `file`s (L20, L23).
Check out the example the code cell below
and then expand the sections afterwards for more details.
```python
def load_and_log():
# 🚀 start a run, with a type to label it and a project it can call home
with wandb.init(project="artifacts-example", job_type="load-data") as run:
datasets = load() # separate code for loading the datasets
names = ["training", "validation", "test"]
# 🏺 create our Artifact
raw_data = wandb.Artifact(
"mnist-raw", type="dataset",
description="Raw MNIST dataset, split into train/val/test",
metadata={"source": "torchvision.datasets.MNIST",
"sizes": [len(dataset) for dataset in datasets]})
for name, data in zip(names, datasets):
# 🐣 Store a new file in the artifact, and write something into its contents.
with raw_data.new_file(name + ".pt", mode="wb") as file:
x, y = data.tensors
torch.save((x, y), file)
# ✍️ Save the artifact to W&B.
run.log_artifact(raw_data)
load_and_log()
```
#### `wandb.init`
When we make the `Run` that's going to produce the `Artifact`s,
we need to state which `project` it belongs to.
Depending on your workflow,
a project might be as big as `car-that-drives-itself`
or as small as `iterative-architecture-experiment-117`.
> **Rule of 👍**: if you can, keep all of the `Run`s that share `Artifact`s
inside a single project. This keeps things simple,
but don't worry -- `Artifact`s are portable across projects.
To help keep track of all the different kinds of jobs you might run,
it's useful to provide a `job_type` when making `Runs`.
This keeps the graph of your Artifacts nice and tidy.
> **Rule of 👍**: the `job_type` should be descriptive and correspond to a single step of your pipeline. Here, we separate out `load`ing data from `preprocess`ing data.
#### `wandb.Artifact`
To log something as an `Artifact`, we have to first make an `Artifact` object.
Every `Artifact` has a `name` -- that's what the first argument sets.
> **Rule of 👍**: the `name` should be descriptive, but easy to remember and type --
we like to use names that are hyphen-separated and correspond to variable names in the code.
It also has a `type`. Just like `job_type`s for `Run`s,
this is used for organizing the graph of `Run`s and `Artifact`s.
> **Rule of 👍**: the `type` should be simple:
more like `dataset` or `model`
than `mnist-data-YYYYMMDD`.
You can also attach a `description` and some `metadata`, as a dictionary.
The `metadata` just needs to be serializable to JSON.
> **Rule of 👍**: the `metadata` should be as descriptive as possible.
#### `artifact.new_file` and `run.log_artifact`
Once we've made an `Artifact` object, we need to add files to it.
You read that right: _files_ with an _s_.
`Artifact`s are structured like directories,
with files and sub-directories.
> **Rule of 👍**: whenever it makes sense to do so, split the contents
of an `Artifact` up into multiple files. This will help if it comes time to scale.
We use the `new_file` method
to simultaneously write the file and attach it to the `Artifact`.
Below, we'll use the `add_file` method,
which separates those two steps.
Once we've added all of our files, we need to `log_artifact` to [wandb.ai](https://wandb.ai).
You'll notice some URLs appeared in the output,
including one for the Run page.
That's where you can view the results of the `Run`,
including any `Artifact`s that got logged.
We'll see some examples that make better use of the other components of the Run page below.
### Use a Logged Dataset Artifact
`Artifact`s in W&B, unlike artifacts in museums,
are designed to be _used_, not just stored.
Let's see what that looks like.
The cell below defines a pipeline step that takes in a raw dataset
and uses it to produce a `preprocess`ed dataset:
`normalize`d and shaped correctly.
Notice again that we split out the meat of the code, `preprocess`,
from the code that interfaces with `wandb`.
```python
def preprocess(dataset, normalize=True, expand_dims=True):
"""
## Prepare the data
"""
x, y = dataset.tensors
if normalize:
# Scale images to the [0, 1] range
x = x.type(torch.float32) / 255
if expand_dims:
# Make sure images have shape (1, 28, 28)
x = torch.unsqueeze(x, 1)
return TensorDataset(x, y)
```
Now for the code that instruments this `preprocess` step with `wandb.Artifact` logging.
Note that the example below both `use`s an `Artifact`,
which is new,
and `log`s it,
which is the same as the last step.
`Artifact`s are both the inputs and the outputs of `Run`s.
We use a new `job_type`, `preprocess-data`,
to make it clear that this is a different kind of job from the previous one.
```python
def preprocess_and_log(steps):
with wandb.init(project="artifacts-example", job_type="preprocess-data") as run:
processed_data = wandb.Artifact(
"mnist-preprocess", type="dataset",
description="Preprocessed MNIST dataset",
metadata=steps)
# ✔️ declare which artifact we'll be using
raw_data_artifact = run.use_artifact('mnist-raw:latest')
# 📥 if need be, download the artifact
raw_dataset = raw_data_artifact.download()
for split in ["training", "validation", "test"]:
raw_split = read(raw_dataset, split)
processed_dataset = preprocess(raw_split, **steps)
with processed_data.new_file(split + ".pt", mode="wb") as file:
x, y = processed_dataset.tensors
torch.save((x, y), file)
run.log_artifact(processed_data)
def read(data_dir, split):
filename = split + ".pt"
x, y = torch.load(os.path.join(data_dir, filename))
return TensorDataset(x, y)
```
One thing to notice here is that the `steps` of the preprocessing
are saved with the `preprocessed_data` as `metadata`.
If you're trying to make your experiments reproducible,
capturing lots of metadata is a good idea.
Also, even though our dataset is a "`large artifact`",
the `download` step is done in much less than a second.
Expand the markdown cell below for details.
```python
steps = {"normalize": True,
"expand_dims": True}
preprocess_and_log(steps)
```
#### `run.use_artifact`
These steps are simpler. The consumer just needs to know the `name` of the `Artifact`, plus a bit more.
That "bit more" is the `alias` of the particular version of the `Artifact` you want.
By default, the last version to be uploaded is tagged `latest`.
Otherwise, you can pick older versions with `v0`/`v1`, etc.,
or you can provide your own aliases, like `best` or `jit-script`.
Just like [Docker Hub](https://hub.docker.com/) tags,
aliases are separated from names with `:`,
so the `Artifact` we want is `mnist-raw:latest`.
> **Rule of 👍**: Keep aliases short and sweet.
Use custom `alias`es like `latest` or `best` when you want an `Artifact`
that satisifies some property
#### `artifact.download`
Now, you may be worrying about the `download` call.
If we download another copy, won't that double the burden on memory?
Don't worry friend. Before we actually download anything,
we check to see if the right version is available locally.
This uses the same technology that underlies [torrenting](https://en.wikipedia.org/wiki/Torrent_file) and [version control with `git`](https://blog.thoughtram.io/git/2014/11/18/the-anatomy-of-a-git-commit.html): hashing.
As `Artifact`s are created and logged,
a folder called `artifacts` in the working directory
will start to fill with sub-directories,
one for each `Artifact`.
Check out its contents with `!tree artifacts`:
```python
!tree artifacts
```
#### The Artifacts page
Now that we've logged and used an `Artifact`,
let's check out the Artifacts tab on the Run page.
Navigate to the Run page URL from the `wandb` output
and select the "Artifacts" tab from the left sidebar
(it's the one with the database icon,
which looks like three hockey pucks stacked on top of one another).
Click a row in either the **Input Artifacts** table
or in the **Output Artifacts** table,
then check out the tabs (**Overview**, **Metadata**)
to see everything logged about the `Artifact`.
We particularly like the **Graph View**.
By default, it shows a graph
with the `type`s of `Artifact`s
and the `job_type`s of `Run` as the two types of nodes,
with arrows to represent consumption and production.
### Log a Model
That's enough to see how the API for `Artifact`s works,
but let's follow this example through to the end of the pipeline
so we can see how `Artifact`s can improve your ML workflow.
This first cell here builds a DNN `model` in PyTorch -- a really simple ConvNet.
We'll start by just initializing the `model`, not training it.
That way, we can repeat the training while keeping everything else constant.
```python
from math import floor
import torch.nn as nn
class ConvNet(nn.Module):
def __init__(self, hidden_layer_sizes=[32, 64],
kernel_sizes=[3],
activation="ReLU",
pool_sizes=[2],
dropout=0.5,
num_classes=num_classes,
input_shape=input_shape):
super(ConvNet, self).__init__()
self.layer1 = nn.Sequential(
nn.Conv2d(in_channels=input_shape[0], out_channels=hidden_layer_sizes[0], kernel_size=kernel_sizes[0]),
getattr(nn, activation)(),
nn.MaxPool2d(kernel_size=pool_sizes[0])
)
self.layer2 = nn.Sequential(
nn.Conv2d(in_channels=hidden_layer_sizes[0], out_channels=hidden_layer_sizes[-1], kernel_size=kernel_sizes[-1]),
getattr(nn, activation)(),
nn.MaxPool2d(kernel_size=pool_sizes[-1])
)
self.layer3 = nn.Sequential(
nn.Flatten(),
nn.Dropout(dropout)
)
fc_input_dims = floor((input_shape[1] - kernel_sizes[0] + 1) / pool_sizes[0]) # layer 1 output size
fc_input_dims = floor((fc_input_dims - kernel_sizes[-1] + 1) / pool_sizes[-1]) # layer 2 output size
fc_input_dims = fc_input_dims*fc_input_dims*hidden_layer_sizes[-1] # layer 3 output size
self.fc = nn.Linear(fc_input_dims, num_classes)
def forward(self, x):
x = self.layer1(x)
x = self.layer2(x)
x = self.layer3(x)
x = self.fc(x)
return x
```
Here, we're using W&B to track the run,
and so using the [`wandb.config`](https://colab.research.google.com/github/wandb/examples/blob/master/colabs/wandb-config/Configs_in_W%26B.ipynb)
object to store all of the hyperparameters.
The `dict`ionary version of that `config` object is a really useful piece of `metadata`, so make sure to include it.
```python
def build_model_and_log(config):
with wandb.init(project="artifacts-example", job_type="initialize", config=config) as run:
config = wandb.config
model = ConvNet(**config)
model_artifact = wandb.Artifact(
"convnet", type="model",
description="Simple AlexNet style CNN",
metadata=dict(config))
torch.save(model.state_dict(), "initialized_model.pth")
# ➕ another way to add a file to an Artifact
model_artifact.add_file("initialized_model.pth")
wandb.save("initialized_model.pth")
run.log_artifact(model_artifact)
model_config = {"hidden_layer_sizes": [32, 64],
"kernel_sizes": [3],
"activation": "ReLU",
"pool_sizes": [2],
"dropout": 0.5,
"num_classes": 10}
build_model_and_log(model_config)
```
#### `artifact.add_file`
Instead of simultaneously writing a `new_file` and adding it to the `Artifact`,
as in the dataset logging examples,
we can also write files in one step
(here, `torch.save`)
and then `add` them to the `Artifact` in another.
> **Rule of 👍**: use `new_file` when you can, to prevent duplication.
#### Use a Logged Model Artifact
Just like we could call `use_artifact` on a `dataset`,
we can call it on our `initialized_model`
to use it in another `Run`.
This time, let's `train` the `model`.
For more details, check out our Colab on
[instrumenting W&B with PyTorch](http://wandb.me/pytorch-colab).
```python
import torch.nn.functional as F
def train(model, train_loader, valid_loader, config):
optimizer = getattr(torch.optim, config.optimizer)(model.parameters())
model.train()
example_ct = 0
for epoch in range(config.epochs):
for batch_idx, (data, target) in enumerate(train_loader):
data, target = data.to(device), target.to(device)
optimizer.zero_grad()
output = model(data)
loss = F.cross_entropy(output, target)
loss.backward()
optimizer.step()
example_ct += len(data)
if batch_idx % config.batch_log_interval == 0:
print('Train Epoch: {} [{}/{} ({:.0%})]\tLoss: {:.6f}'.format(
epoch, batch_idx * len(data), len(train_loader.dataset),
batch_idx / len(train_loader), loss.item()))
train_log(loss, example_ct, epoch)
# evaluate the model on the validation set at each epoch
loss, accuracy = test(model, valid_loader)
test_log(loss, accuracy, example_ct, epoch)
def test(model, test_loader):
model.eval()
test_loss = 0
correct = 0
with torch.no_grad():
for data, target in test_loader:
data, target = data.to(device), target.to(device)
output = model(data)
test_loss += F.cross_entropy(output, target, reduction='sum') # sum up batch loss
pred = output.argmax(dim=1, keepdim=True) # get the index of the max log-probability
correct += pred.eq(target.view_as(pred)).sum()
test_loss /= len(test_loader.dataset)
accuracy = 100. * correct / len(test_loader.dataset)
return test_loss, accuracy
def train_log(loss, example_ct, epoch):
loss = float(loss)
# where the magic happens
wandb.log({"epoch": epoch, "train/loss": loss}, step=example_ct)
print(f"Loss after " + str(example_ct).zfill(5) + f" examples: {loss:.3f}")
def test_log(loss, accuracy, example_ct, epoch):
loss = float(loss)
accuracy = float(accuracy)
# where the magic happens
wandb.log({"epoch": epoch, "validation/loss": loss, "validation/accuracy": accuracy}, step=example_ct)
print(f"Loss/accuracy after " + str(example_ct).zfill(5) + f" examples: {loss:.3f}/{accuracy:.3f}")
```
We'll run two separate `Artifact`-producing `Run`s this time.
Once the first finishes `train`ing the `model`,
the `second` will consume the `trained-model` `Artifact`
by `evaluate`ing its performance on the `test_dataset`.
Also, we'll pull out the 32 examples on which the network gets the most confused --
on which the `categorical_crossentropy` is highest.
This is a good way to diagnose issues with your dataset and your model.
```python
def evaluate(model, test_loader):
"""
## Evaluate the trained model
"""
loss, accuracy = test(model, test_loader)
highest_losses, hardest_examples, true_labels, predictions = get_hardest_k_examples(model, test_loader.dataset)
return loss, accuracy, highest_losses, hardest_examples, true_labels, predictions
def get_hardest_k_examples(model, testing_set, k=32):
model.eval()
loader = DataLoader(testing_set, 1, shuffle=False)
# get the losses and predictions for each item in the dataset
losses = None
predictions = None
with torch.no_grad():
for data, target in loader:
data, target = data.to(device), target.to(device)
output = model(data)
loss = F.cross_entropy(output, target)
pred = output.argmax(dim=1, keepdim=True)
if losses is None:
losses = loss.view((1, 1))
predictions = pred
else:
losses = torch.cat((losses, loss.view((1, 1))), 0)
predictions = torch.cat((predictions, pred), 0)
argsort_loss = torch.argsort(losses, dim=0)
highest_k_losses = losses[argsort_loss[-k:]]
hardest_k_examples = testing_set[argsort_loss[-k:]][0]
true_labels = testing_set[argsort_loss[-k:]][1]
predicted_labels = predictions[argsort_loss[-k:]]
return highest_k_losses, hardest_k_examples, true_labels, predicted_labels
```
These logging functions don't add any new `Artifact` features,
so we won't comment on them:
we're just `use`ing, `download`ing,
and `log`ging `Artifact`s.
```python
from torch.utils.data import DataLoader
def train_and_log(config):
with wandb.init(project="artifacts-example", job_type="train", config=config) as run:
config = wandb.config
data = run.use_artifact('mnist-preprocess:latest')
data_dir = data.download()
training_dataset = read(data_dir, "training")
validation_dataset = read(data_dir, "validation")
train_loader = DataLoader(training_dataset, batch_size=config.batch_size)
validation_loader = DataLoader(validation_dataset, batch_size=config.batch_size)
model_artifact = run.use_artifact("convnet:latest")
model_dir = model_artifact.download()
model_path = os.path.join(model_dir, "initialized_model.pth")
model_config = model_artifact.metadata
config.update(model_config)
model = ConvNet(**model_config)
model.load_state_dict(torch.load(model_path))
model = model.to(device)
train(model, train_loader, validation_loader, config)
model_artifact = wandb.Artifact(
"trained-model", type="model",
description="Trained NN model",
metadata=dict(model_config))
torch.save(model.state_dict(), "trained_model.pth")
model_artifact.add_file("trained_model.pth")
wandb.save("trained_model.pth")
run.log_artifact(model_artifact)
return model
def evaluate_and_log(config=None):
with wandb.init(project="artifacts-example", job_type="report", config=config) as run:
data = run.use_artifact('mnist-preprocess:latest')
data_dir = data.download()
testing_set = read(data_dir, "test")
test_loader = torch.utils.data.DataLoader(testing_set, batch_size=128, shuffle=False)
model_artifact = run.use_artifact("trained-model:latest")
model_dir = model_artifact.download()
model_path = os.path.join(model_dir, "trained_model.pth")
model_config = model_artifact.metadata
model = ConvNet(**model_config)
model.load_state_dict(torch.load(model_path))
model.to(device)
loss, accuracy, highest_losses, hardest_examples, true_labels, preds = evaluate(model, test_loader)
run.summary.update({"loss": loss, "accuracy": accuracy})
wandb.log({"high-loss-examples":
[wandb.Image(hard_example, caption=str(int(pred)) + "," + str(int(label)))
for hard_example, pred, label in zip(hardest_examples, preds, true_labels)]})
```
```python
train_config = {"batch_size": 128,
"epochs": 5,
"batch_log_interval": 25,
"optimizer": "Adam"}
model = train_and_log(train_config)
evaluate_and_log()
```
# Programmatic Workspaces
{{< cta-button colabLink="https://colab.research.google.com/github/wandb/wandb-workspaces/blob/Update-wandb-workspaces-tuturial/Workspace_tutorial.ipynb" >}}
Organize and visualize your machine learning experiments more effectively by programmatically creating, managing, and customizing workspaces. You can define configurations, set panel layouts, and organize sections with the [`wandb-workspaces`](https://github.com/wandb/wandb-workspaces/tree/main) W&B library. You can load and modify workspaces by URL, use expressions to filter and group runs, and customize the appearances of runs.
`wandb-workspaces` is a Python library for programmatically creating and customizing W&B [Workspaces]({{< relref "/guides/models/track/workspaces/" >}}) and [Reports]({{< relref "/guides/core/reports/" >}}).
In this tutorial you will see how to use `wandb-workspaces` to create and customize workspaces by defining configurations, set panel layouts, and organize sections.
## How to use this notebook
* Run each cell one at a time.
* Copy and paste the URL that is printed after you run a cell to view the changes made to the workspace.
{{% alert %}}
Programmatic interaction with workspaces is currently supported for [**Saved workspaces views**]({{< relref "/guides/models/track/workspaces#saved-workspace-views" >}}). Saved workspaces views are collaborative snapshots of a workspace. Anyone on your team can view, edit, and save changes to saved workspace views.
{{% /alert %}}
## 1. Install and import dependencies
```python
# Install dependencies
!pip install wandb wandb-workspaces rich
```
```python
# Import dependencies
import os
import wandb
import wandb_workspaces.workspaces as ws
import wandb_workspaces.reports.v2 as wr # We use the Reports API for adding panels
# Improve output formatting
%load_ext rich
```
## 2. Create a new project and workspace
For this tutorial we will create a new project so that we can experiment with the `wandb_workspaces` API:
Note: You can load an existing workspace using its unique `Saved view` URL. See the next code block to see how to do this.
```python
# Initialize Weights & Biases and Login
wandb.login()
# Function to create a new project and log sample data
def create_project_and_log_data():
project = "workspace-api-example" # Default project name
# Initialize a run to log some sample data
with wandb.init(project=project, name="sample_run") as run:
for step in range(100):
wandb.log({
"Step": step,
"val_loss": 1.0 / (step + 1),
"val_accuracy": step / 100.0,
"train_loss": 1.0 / (step + 2),
"train_accuracy": step / 110.0,
"f1_score": step / 100.0,
"recall": step / 120.0,
})
return project
# Create a new project and log data
project = create_project_and_log_data()
entity = wandb.Api().default_entity
```
### (Optional) Load an existing project and workspace
Instead of creating a new project, you can load one of your own existing project and workspace. To do this, find the unique workspace URL and pass it to `ws.Workspace.from_url` as a string. The URL has the form `https://wandb.ai/[SOURCE-ENTITY]/[SOURCE-USER]?nw=abc`.
For example:
```python
wandb.login()
workspace = ws.Workspace.from_url("https://wandb.ai/[SOURCE-ENTITY]/[SOURCE-USER]?nw=abc").
workspace = ws.Workspace(
entity="NEW-ENTITY",
project=NEW-PROJECT,
name="NEW-SAVED-VIEW-NAME"
)
```
## 3. Programmatic workspace examples
Below are examples for using programmatic workspace features:
```python
# See all available settings for workspaces, sections, and panels.
all_settings_objects = [x for x in dir(ws) if isinstance(getattr(ws, x), type)]
all_settings_objects
```
### Create a workspace with `saved view`
This example demonstrates how to create a new workspace and populate it with sections and panels. Workspaces can be edited like regular Python objects, providing flexibility and ease of use.
```python
def sample_workspace_saved_example(entity: str, project: str) -> str:
workspace: ws.Workspace = ws.Workspace(
name="Example W&B Workspace",
entity=entity,
project=project,
sections=[
ws.Section(
name="Validation Metrics",
panels=[
wr.LinePlot(x="Step", y=["val_loss"]),
wr.BarPlot(metrics=["val_accuracy"]),
wr.ScalarChart(metric="f1_score", groupby_aggfunc="mean"),
],
is_open=True,
),
],
)
workspace.save()
print("Sample Workspace saved.")
return workspace.url
workspace_url: str = sample_workspace_saved_example(entity, project)
```
### Load a workspace from a URL
Duplicate and customize workspaces without affecting the original setup. To do this, load an existing workspace and save it as a new view:
```python
def save_new_workspace_view_example(url: str) -> None:
workspace: ws.Workspace = ws.Workspace.from_url(url)
workspace.name = "Updated Workspace Name"
workspace.save_as_new_view()
print(f"Workspace saved as new view.")
save_new_workspace_view_example(workspace_url)
```
Note that your workspace is now named "Updated Workspace Name".
### Basic settings
The following code shows how to create a workspace, add sections with panels, and configure settings for the workspace, individual sections, and panels:
```python
# Function to create and configure a workspace with custom settings
def custom_settings_example(entity: str, project: str) -> None:
workspace: ws.Workspace = ws.Workspace(name="An example workspace", entity=entity, project=project)
workspace.sections = [
ws.Section(
name="Validation",
panels=[
wr.LinePlot(x="Step", y=["val_loss"]),
wr.LinePlot(x="Step", y=["val_accuracy"]),
wr.ScalarChart(metric="f1_score", groupby_aggfunc="mean"),
wr.ScalarChart(metric="recall", groupby_aggfunc="mean"),
],
is_open=True,
),
ws.Section(
name="Training",
panels=[
wr.LinePlot(x="Step", y=["train_loss"]),
wr.LinePlot(x="Step", y=["train_accuracy"]),
],
is_open=False,
),
]
workspace.settings = ws.WorkspaceSettings(
x_axis="Step",
x_min=0,
x_max=75,
smoothing_type="gaussian",
smoothing_weight=20.0,
ignore_outliers=False,
remove_legends_from_panels=False,
tooltip_number_of_runs="default",
tooltip_color_run_names=True,
max_runs=20,
point_visualization_method="bucketing",
auto_expand_panel_search_results=False,
)
section = workspace.sections[0]
section.panel_settings = ws.SectionPanelSettings(
x_min=25,
x_max=50,
smoothing_type="none",
)
panel = section.panels[0]
panel.title = "Validation Loss Custom Title"
panel.title_x = "Custom x-axis title"
workspace.save()
print("Workspace with custom settings saved.")
# Run the function to create and configure the workspace
custom_settings_example(entity, project)
```
Note that you are now viewing a different saved view called "An example workspace".
## Customize runs
The following code cells show you how to filter, change the color, group, and sort runs programmatically.
In each example, the general workflow is to specify the desired customization as an argument to the appropiate parameter in `ws.RunsetSettings`.
### Filter runs
You can create filters with python expressions and metrics you log with `wandb.log` or that are logged automatically as part of the run such as **Created Timestamp**. You can also reference filters by how they appear in the W&B App UI such as the **Name**, **Tags**, or **ID**.
The following example shows how to filter runs based on the validation loss summary, validation accuracy summary, and the regex specified:
```python
def advanced_filter_example(entity: str, project: str) -> None:
# Get all runs in the project
runs: list = wandb.Api().runs(f"{entity}/{project}")
# Apply multiple filters: val_loss < 0.1, val_accuracy > 0.8, and run name matches regex pattern
workspace: ws.Workspace = ws.Workspace(
name="Advanced Filtered Workspace with Regex",
entity=entity,
project=project,
sections=[
ws.Section(
name="Advanced Filtered Section",
panels=[
wr.LinePlot(x="Step", y=["val_loss"]),
wr.LinePlot(x="Step", y=["val_accuracy"]),
],
is_open=True,
),
],
runset_settings=ws.RunsetSettings(
filters=[
(ws.Summary("val_loss") < 0.1), # Filter runs by the 'val_loss' summary
(ws.Summary("val_accuracy") > 0.8), # Filter runs by the 'val_accuracy' summary
(ws.Metric("ID").isin([run.id for run in wandb.Api().runs(f"{entity}/{project}")])),
],
regex_query=True,
)
)
# Add regex search to match run names starting with 's'
workspace.runset_settings.query = "^s"
workspace.runset_settings.regex_query = True
workspace.save()
print("Workspace with advanced filters and regex search saved.")
advanced_filter_example(entity, project)
```
Note that passing in a list of filter expressions applies the boolean "AND" logic.
### Change the colors of runs
This example demonstrates how to change the colors of the runs in a workspace:
```python
def run_color_example(entity: str, project: str) -> None:
# Get all runs in the project
runs: list = wandb.Api().runs(f"{entity}/{project}")
# Dynamically assign colors to the runs
run_colors: list = ['purple', 'orange', 'teal', 'magenta']
run_settings: dict = {}
for i, run in enumerate(runs):
run_settings[run.id] = ws.RunSettings(color=run_colors[i % len(run_colors)])
workspace: ws.Workspace = ws.Workspace(
name="Run Colors Workspace",
entity=entity,
project=project,
sections=[
ws.Section(
name="Run Colors Section",
panels=[
wr.LinePlot(x="Step", y=["val_loss"]),
wr.LinePlot(x="Step", y=["val_accuracy"]),
],
is_open=True,
),
],
runset_settings=ws.RunsetSettings(
run_settings=run_settings
)
)
workspace.save()
print("Workspace with run colors saved.")
run_color_example(entity, project)
```
### Group runs
This example demonstrates how to group runs by specific metrics.
```python
def grouping_example(entity: str, project: str) -> None:
workspace: ws.Workspace = ws.Workspace(
name="Grouped Runs Workspace",
entity=entity,
project=project,
sections=[
ws.Section(
name="Grouped Runs",
panels=[
wr.LinePlot(x="Step", y=["val_loss"]),
wr.LinePlot(x="Step", y=["val_accuracy"]),
],
is_open=True,
),
],
runset_settings=ws.RunsetSettings(
groupby=[ws.Metric("Name")]
)
)
workspace.save()
print("Workspace with grouped runs saved.")
grouping_example(entity, project)
```
### Sort runs
This example demonstrates how to sort runs based on the validation loss summary:
```python
def sorting_example(entity: str, project: str) -> None:
workspace: ws.Workspace = ws.Workspace(
name="Sorted Runs Workspace",
entity=entity,
project=project,
sections=[
ws.Section(
name="Sorted Runs",
panels=[
wr.LinePlot(x="Step", y=["val_loss"]),
wr.LinePlot(x="Step", y=["val_accuracy"]),
],
is_open=True,
),
],
runset_settings=ws.RunsetSettings(
order=[ws.Ordering(ws.Summary("val_loss"))] #Order using val_loss summary
)
)
workspace.save()
print("Workspace with sorted runs saved.")
sorting_example(entity, project)
```
## 4. Putting it all together: comprehenive example
This example demonstrates how to create a comprehensive workspace, configure its settings, and add panels to sections:
```python
def full_end_to_end_example(entity: str, project: str) -> None:
# Get all runs in the project
runs: list = wandb.Api().runs(f"{entity}/{project}")
# Dynamically assign colors to the runs and create run settings
run_colors: list = ['red', 'blue', 'green', 'orange', 'purple', 'teal', 'magenta', '#FAC13C']
run_settings: dict = {}
for i, run in enumerate(runs):
run_settings[run.id] = ws.RunSettings(color=run_colors[i % len(run_colors)], disabled=False)
workspace: ws.Workspace = ws.Workspace(
name="My Workspace Template",
entity=entity,
project=project,
sections=[
ws.Section(
name="Main Metrics",
panels=[
wr.LinePlot(x="Step", y=["val_loss"]),
wr.LinePlot(x="Step", y=["val_accuracy"]),
wr.ScalarChart(metric="f1_score", groupby_aggfunc="mean"),
],
is_open=True,
),
ws.Section(
name="Additional Metrics",
panels=[
wr.ScalarChart(metric="precision", groupby_aggfunc="mean"),
wr.ScalarChart(metric="recall", groupby_aggfunc="mean"),
],
),
],
settings=ws.WorkspaceSettings(
x_axis="Step",
x_min=0,
x_max=100,
smoothing_type="none",
smoothing_weight=0,
ignore_outliers=False,
remove_legends_from_panels=False,
tooltip_number_of_runs="default",
tooltip_color_run_names=True,
max_runs=20,
point_visualization_method="bucketing",
auto_expand_panel_search_results=False,
),
runset_settings=ws.RunsetSettings(
query="",
regex_query=False,
filters=[
ws.Summary("val_loss") < 1,
ws.Metric("Name") == "sample_run",
],
groupby=[ws.Metric("Name")],
order=[ws.Ordering(ws.Summary("Step"), ascending=True)],
run_settings=run_settings
)
)
workspace.save()
print("Workspace created and saved.")
full_end_to_end_example(entity, project)
```
# Integration tutorials
# Weave and Models integration demo
{{< cta-button colabLink="https://colab.research.google.com/drive/1Uqgel6cNcGdP7AmBXe2pR9u6Dejggsh8?usp=sharing" >}}
This notebook shows how to use W&B Weave together with W&B Models. Specifically, this example considers two different teams.
* **The Model Team:** the model building team fine-tunes a new Chat Model (Llama 3.2) and saves it to the registry using **W&B Models**.
* **The App Team:** the app development team retrieves the Chat Model to create and evaluate a new RAG chatbot using **W&B Weave**.
Find the public workspace for both W&B Models and W&B Weave [here](https://wandb.ai/wandb-smle/weave-cookboook-demo/weave/evaluations).
{{< img src="/images/tutorials/weave_models_workflow.jpg" alt="Weights & Biases" >}}
The workflow covers the following steps:
1. Instrument the RAG app code with W&B Weave
2. Fine-tune an LLM (such as Llama 3.2, but you can replace it with any other LLM) and track it with W&B Models
3. Log the fine-tuned model to the [W&B Registry](https://docs.wandb.ai/guides/core/registry)
4. Implement the RAG app with the new fine-tuned model and evaluate the app with W&B Weave
5. Once satisfied with the results, save a reference to the updated Rag app in the W&B Registry
**Note:**
The `RagModel` referenced below is top-level `weave.Model` that you can consider a complete RAG app. It contains a `ChatModel`, Vector database, and a Prompt. The `ChatModel` is also another `weave.Model` which contains the code to download an artifact from the W&B Registry and it can change to support any other chat model as part of the `RagModel`. For more details see [the complete model on Weave](https://wandb.ai/wandb-smle/weave-cookboook-demo/weave/evaluations?peekPath=%2Fwandb-smle%2Fweave-cookboook-demo%2Fobjects%2FRagModel%2Fversions%2Fx7MzcgHDrGXYHHDQ9BA8N89qDwcGkdSdpxH30ubm8ZM%3F%26).
## 1. Setup
First, install `weave` and `wandb`, then log in with an API key. You can create and view your API keys at https://wandb.ai/settings.
```bash
pip install weave wandb
```
```python
import wandb
import weave
import pandas as pd
PROJECT = "weave-cookboook-demo"
ENTITY = "wandb-smle"
wandb.login()
weave.init(ENTITY + "/" + PROJECT)
```
## 2. Make `ChatModel` based on Artifact
Retrieve the fine-tuned chat model from the Registry and create a `weave.Model` from it to directly plug into the [`RagModel`](https://wandb.ai/wandb-smle/weave-cookboook-demo/weave/object-versions?filter=%7B%22objectName%22%3A%22RagModel%22%7D&peekPath=%2Fwandb-smle%2Fweave-cookboook-demo%2Fobjects%2FRagModel%2Fversions%2FcqRaGKcxutBWXyM0fCGTR1Yk2mISLsNari4wlGTwERo%3F%26) in the next step. It takes in the same parameters as the existing [ChatModel](https://wandb.ai/wandb-smle/weave-cookboook-demo/weave/object-versions?filter=%7B%22objectName%22%3A%22RagModel%22%7D&peekPath=%2Fwandb-smle%2Fweave-rag-experiments%2Fobjects%2FChatModelRag%2Fversions%2F2mhdPb667uoFlXStXtZ0MuYoxPaiAXj3KyLS1kYRi84%3F%26) just the `init` and `predict` change.
```bash
pip install unsloth
pip uninstall unsloth -y && pip install --upgrade --no-cache-dir "unsloth[colab-new] @ git+https://github.com/unslothai/unsloth.git"
```
The model team fine-tuned different Llama-3.2 models using the `unsloth` library to make it faster. Hence use the special `unsloth.FastLanguageModel` or `peft.AutoPeftModelForCausalLM` models with adapters to load in the model once downloaded from the Registry. Copy the loading code from the "Use" tab in the Registry and paste it into `model_post_init`.
```python
import weave
from pydantic import PrivateAttr
from typing import Any, List, Dict, Optional
from unsloth import FastLanguageModel
import torch
class UnslothLoRAChatModel(weave.Model):
"""
Define an extra ChatModel class to store and version more parameters than just the model name.
This enables fine-tuning on specific parameters.
"""
chat_model: str
cm_temperature: float
cm_max_new_tokens: int
cm_quantize: bool
inference_batch_size: int
dtype: Any
device: str
_model: Any = PrivateAttr()
_tokenizer: Any = PrivateAttr()
def model_post_init(self, __context):
run = wandb.init(project=PROJECT, job_type="model_download")
artifact_ref = self.chat_model.replace("wandb-artifact:///", "")
artifact = run.use_artifact(artifact_ref)
model_path = artifact.download()
# unsloth version (enable native 2x faster inference)
self._model, self._tokenizer = FastLanguageModel.from_pretrained(
model_name=model_path,
max_seq_length=self.cm_max_new_tokens,
dtype=self.dtype,
load_in_4bit=self.cm_quantize,
)
FastLanguageModel.for_inference(self._model)
@weave.op()
async def predict(self, query: List[str]) -> dict:
# add_generation_prompt = true - Must add for generation
input_ids = self._tokenizer.apply_chat_template(
query,
tokenize=True,
add_generation_prompt=True,
return_tensors="pt",
).to("cuda")
output_ids = self._model.generate(
input_ids=input_ids,
max_new_tokens=64,
use_cache=True,
temperature=1.5,
min_p=0.1,
)
decoded_outputs = self._tokenizer.batch_decode(
output_ids[0][input_ids.shape[1] :], skip_special_tokens=True
)
return "".join(decoded_outputs).strip()
```
Now create a new model with a specific link from the registry:
```python
ORG_ENTITY = "wandb32" # replace this with your organization name
artifact_name = "Finetuned Llama-3.2" # replace this with your artifact name
MODEL_REG_URL = f"wandb-artifact:///{ORG_ENTITY}/wandb-registry-RAG Chat Models/{artifact_name}:v3"
max_seq_length = 2048
dtype = None
load_in_4bit = True
new_chat_model = UnslothLoRAChatModel(
name="UnslothLoRAChatModelRag",
chat_model=MODEL_REG_URL,
cm_temperature=1.0,
cm_max_new_tokens=max_seq_length,
cm_quantize=load_in_4bit,
inference_batch_size=max_seq_length,
dtype=dtype,
device="auto",
)
```
And finally run the evaluation asynchronously:
```python
await new_chat_model.predict(
[{"role": "user", "content": "What is the capital of Germany?"}]
)
```
## 3. Integrate new `ChatModel` version into `RagModel`
Building a RAG app from a fine-tuned chat model can provide several advantages, particularly in enhancing the performance and versatility of conversational AI systems.
Now retrieve the [`RagModel`](https://wandb.ai/wandb-smle/weave-cookboook-demo/weave/object-versions?filter=%7B%22objectName%22%3A%22RagModel%22%7D&peekPath=%2Fwandb-smle%2Fweave-cookboook-demo%2Fobjects%2FRagModel%2Fversions%2FcqRaGKcxutBWXyM0fCGTR1Yk2mISLsNari4wlGTwERo%3F%26) (you can fetch the weave ref for the current `RagModel` from the use tab as shown in the image below) from the existing Weave project and exchange the `ChatModel` to the new one. There is no need to change or re-create any of the other components (VDB, prompts, etc.)!
```bash
pip install litellm faiss-gpu
```
```python
RagModel = weave.ref(
"weave:///wandb-smle/weave-cookboook-demo/object/RagModel:cqRaGKcxutBWXyM0fCGTR1Yk2mISLsNari4wlGTwERo"
).get()
# MAGIC: exchange chat_model and publish new version (no need to worry about other RAG components)
RagModel.chat_model = new_chat_model
# First publish the new version so that it is referenced during predictions
PUB_REFERENCE = weave.publish(RagModel, "RagModel")
await RagModel.predict("When was the first conference on climate change?")
```
## 4. Run new `weave.Evaluation` connecting to the existing models run
Finally, evaluate the new `RagModel` on the existing `weave.Evaluation`. To make the integration as easy as possible, include the following changes.
From a Models perspective:
- Getting the model from the registry creates a new `wandb.run` which is part of the E2E lineage of the chat model
- Add the Trace ID (with current eval ID) to the run config so that the model team can click the link to go to the corresponding Weave page
From a Weave perspective:
- Save the artifact / registry link as input to the `ChatModel` (that is `RagModel`)
- Save the run.id as extra column in the traces with `weave.attributes`
```python
# MAGIC: get an evaluation with a eval dataset and scorers and use them
WEAVE_EVAL = "weave:///wandb-smle/weave-cookboook-demo/object/climate_rag_eval:ntRX6qn3Tx6w3UEVZXdhIh1BWGh7uXcQpOQnIuvnSgo"
climate_rag_eval = weave.ref(WEAVE_EVAL).get()
with weave.attributes({"wandb-run-id": wandb.run.id}):
# use .call attribute to retrieve both the result and the call in order to save eval trace to Models
summary, call = await climate_rag_eval.evaluate.call(climate_rag_eval, ` RagModel `)
```
## 5. Save the new RAG model on the Registry
In order to effectively share the new RAG Model, push it to the Registry as a reference artifact adding in the weave version as an alias.
```python
MODELS_OBJECT_VERSION = PUB_REFERENCE.digest # weave object version
MODELS_OBJECT_NAME = PUB_REFERENCE.name # weave object name
models_url = f"https://wandb.ai/{ENTITY}/{PROJECT}/weave/objects/{MODELS_OBJECT_NAME}/versions/{MODELS_OBJECT_VERSION}"
models_link = (
f"weave:///{ENTITY}/{PROJECT}/object/{MODELS_OBJECT_NAME}:{MODELS_OBJECT_VERSION}"
)
with wandb.init(project=PROJECT, entity=ENTITY) as run:
# create new Artifact
artifact_model = wandb.Artifact(
name="RagModel",
type="model",
description="Models Link from RagModel in Weave",
metadata={"url": models_url},
)
artifact_model.add_reference(models_link, name="model", checksum=False)
# log new artifact
run.log_artifact(artifact_model, aliases=[MODELS_OBJECT_VERSION])
# link to registry
run.link_artifact(
artifact_model, target_path="wandb32/wandb-registry-RAG Models/RAG Model"
)
```
# Integration tutorials
# PyTorch
{{< cta-button colabLink="https://colab.research.google.com/github/wandb/examples/blob/master/colabs/pytorch/Simple_PyTorch_Integration.ipynb" >}}
Use [Weights & Biases](https://wandb.com) for machine learning experiment tracking, dataset versioning, and project collaboration.
{{< img src="/images/tutorials/huggingface-why.png" alt="" >}}
## What this notebook covers
We show you how to integrate Weights & Biases with your PyTorch code to add experiment tracking to your pipeline.
{{< img src="/images/tutorials/pytorch.png" alt="" >}}
```python
# import the library
import wandb
# start a new experiment
wandb.init(project="new-sota-model")
# capture a dictionary of hyperparameters with config
wandb.config = {"learning_rate": 0.001, "epochs": 100, "batch_size": 128}
# set up model and data
model, dataloader = get_model(), get_data()
# optional: track gradients
wandb.watch(model)
for batch in dataloader:
metrics = model.training_step()
# log metrics inside your training loop to visualize model performance
wandb.log(metrics)
# optional: save model at the end
model.to_onnx()
wandb.save("model.onnx")
```
Follow along with a [video tutorial](http://wandb.me/pytorch-video).
**Note**: Sections starting with _Step_ are all you need to integrate W&B in an existing pipeline. The rest just loads data and defines a model.
## Install, import, and log in
```python
import os
import random
import numpy as np
import torch
import torch.nn as nn
import torchvision
import torchvision.transforms as transforms
from tqdm.auto import tqdm
# Ensure deterministic behavior
torch.backends.cudnn.deterministic = True
random.seed(hash("setting random seeds") % 2**32 - 1)
np.random.seed(hash("improves reproducibility") % 2**32 - 1)
torch.manual_seed(hash("by removing stochasticity") % 2**32 - 1)
torch.cuda.manual_seed_all(hash("so runs are repeatable") % 2**32 - 1)
# Device configuration
device = torch.device("cuda:0" if torch.cuda.is_available() else "cpu")
# remove slow mirror from list of MNIST mirrors
torchvision.datasets.MNIST.mirrors = [mirror for mirror in torchvision.datasets.MNIST.mirrors
if not mirror.startswith("http://yann.lecun.com")]
```
### Step 0: Install W&B
To get started, we'll need to get the library.
`wandb` is easily installed using `pip`.
```python
!pip install wandb onnx -Uq
```
### Step 1: Import W&B and Login
In order to log data to our web service,
you'll need to log in.
If this is your first time using W&B,
you'll need to sign up for a free account at the link that appears.
```
import wandb
wandb.login()
```
## Define the Experiment and Pipeline
### Track metadata and hyperparameters with `wandb.init`
Programmatically, the first thing we do is define our experiment:
what are the hyperparameters? what metadata is associated with this run?
It's a pretty common workflow to store this information in a `config` dictionary
(or similar object)
and then access it as needed.
For this example, we're only letting a few hyperparameters vary
and hand-coding the rest.
But any part of your model can be part of the `config`.
We also include some metadata: we're using the MNIST dataset and a convolutional
architecture. If we later work with, say,
fully connected architectures on CIFAR in the same project,
this will help us separate our runs.
```python
config = dict(
epochs=5,
classes=10,
kernels=[16, 32],
batch_size=128,
learning_rate=0.005,
dataset="MNIST",
architecture="CNN")
```
Now, let's define the overall pipeline,
which is pretty typical for model-training:
1. we first `make` a model, plus associated data and optimizer, then
2. we `train` the model accordingly and finally
3. `test` it to see how training went.
We'll implement these functions below.
```python
def model_pipeline(hyperparameters):
# tell wandb to get started
with wandb.init(project="pytorch-demo", config=hyperparameters):
# access all HPs through wandb.config, so logging matches execution.
config = wandb.config
# make the model, data, and optimization problem
model, train_loader, test_loader, criterion, optimizer = make(config)
print(model)
# and use them to train the model
train(model, train_loader, criterion, optimizer, config)
# and test its final performance
test(model, test_loader)
return model
```
The only difference here from a standard pipeline
is that it all occurs inside the context of `wandb.init`.
Calling this function sets up a line of communication
between your code and our servers.
Passing the `config` dictionary to `wandb.init`
immediately logs all that information to us,
so you'll always know what hyperparameter values
you set your experiment to use.
To ensure the values you chose and logged are always the ones that get used
in your model, we recommend using the `wandb.config` copy of your object.
Check the definition of `make` below to see some examples.
> *Side Note*: We take care to run our code in separate processes,
so that any issues on our end
(such as if a giant sea monster attacks our data centers)
don't crash your code.
Once the issue is resolved, such as when the Kraken returns to the deep,
you can log the data with `wandb sync`.
```python
def make(config):
# Make the data
train, test = get_data(train=True), get_data(train=False)
train_loader = make_loader(train, batch_size=config.batch_size)
test_loader = make_loader(test, batch_size=config.batch_size)
# Make the model
model = ConvNet(config.kernels, config.classes).to(device)
# Make the loss and optimizer
criterion = nn.CrossEntropyLoss()
optimizer = torch.optim.Adam(
model.parameters(), lr=config.learning_rate)
return model, train_loader, test_loader, criterion, optimizer
```
### Define the Data Loading and Model
Now, we need to specify how the data is loaded and what the model looks like.
This part is very important, but it's
no different from what it would be without `wandb`,
so we won't dwell on it.
```python
def get_data(slice=5, train=True):
full_dataset = torchvision.datasets.MNIST(root=".",
train=train,
transform=transforms.ToTensor(),
download=True)
# equiv to slicing with [::slice]
sub_dataset = torch.utils.data.Subset(
full_dataset, indices=range(0, len(full_dataset), slice))
return sub_dataset
def make_loader(dataset, batch_size):
loader = torch.utils.data.DataLoader(dataset=dataset,
batch_size=batch_size,
shuffle=True,
pin_memory=True, num_workers=2)
return loader
```
Defining the model is normally the fun part.
But nothing changes with `wandb`,
so we're gonna stick with a standard ConvNet architecture.
Don't be afraid to mess around with this and try some experiments --
all your results will be logged on [wandb.ai](https://wandb.ai).
```python
# Conventional and convolutional neural network
class ConvNet(nn.Module):
def __init__(self, kernels, classes=10):
super(ConvNet, self).__init__()
self.layer1 = nn.Sequential(
nn.Conv2d(1, kernels[0], kernel_size=5, stride=1, padding=2),
nn.ReLU(),
nn.MaxPool2d(kernel_size=2, stride=2))
self.layer2 = nn.Sequential(
nn.Conv2d(16, kernels[1], kernel_size=5, stride=1, padding=2),
nn.ReLU(),
nn.MaxPool2d(kernel_size=2, stride=2))
self.fc = nn.Linear(7 * 7 * kernels[-1], classes)
def forward(self, x):
out = self.layer1(x)
out = self.layer2(out)
out = out.reshape(out.size(0), -1)
out = self.fc(out)
return out
```
### Define Training Logic
Moving on in our `model_pipeline`, it's time to specify how we `train`.
Two `wandb` functions come into play here: `watch` and `log`.
## Track gradients with `wandb.watch` and everything else with `wandb.log`
`wandb.watch` will log the gradients and the parameters of your model,
every `log_freq` steps of training.
All you need to do is call it before you start training.
The rest of the training code remains the same:
we iterate over epochs and batches,
running forward and backward passes
and applying our `optimizer`.
```python
def train(model, loader, criterion, optimizer, config):
# Tell wandb to watch what the model gets up to: gradients, weights, and more.
wandb.watch(model, criterion, log="all", log_freq=10)
# Run training and track with wandb
total_batches = len(loader) * config.epochs
example_ct = 0 # number of examples seen
batch_ct = 0
for epoch in tqdm(range(config.epochs)):
for _, (images, labels) in enumerate(loader):
loss = train_batch(images, labels, model, optimizer, criterion)
example_ct += len(images)
batch_ct += 1
# Report metrics every 25th batch
if ((batch_ct + 1) % 25) == 0:
train_log(loss, example_ct, epoch)
def train_batch(images, labels, model, optimizer, criterion):
images, labels = images.to(device), labels.to(device)
# Forward pass ➡
outputs = model(images)
loss = criterion(outputs, labels)
# Backward pass ⬅
optimizer.zero_grad()
loss.backward()
# Step with optimizer
optimizer.step()
return loss
```
The only difference is in the logging code:
where previously you might have reported metrics by printing to the terminal,
now you pass the same information to `wandb.log`.
`wandb.log` expects a dictionary with strings as keys.
These strings identify the objects being logged, which make up the values.
You can also optionally log which `step` of training you're on.
> *Side Note*: I like to use the number of examples the model has seen,
since this makes for easier comparison across batch sizes,
but you can use raw steps or batch count. For longer training runs, it can also make sense to log by `epoch`.
```python
def train_log(loss, example_ct, epoch):
# Where the magic happens
wandb.log({"epoch": epoch, "loss": loss}, step=example_ct)
print(f"Loss after {str(example_ct).zfill(5)} examples: {loss:.3f}")
```
### Define Testing Logic
Once the model is done training, we want to test it:
run it against some fresh data from production, perhaps,
or apply it to some hand-curated examples.
## (Optional) Call `wandb.save`
This is also a great time to save the model's architecture
and final parameters to disk.
For maximum compatibility, we'll `export` our model in the
[Open Neural Network eXchange (ONNX) format](https://onnx.ai/).
Passing that filename to `wandb.save` ensures that the model parameters
are saved to W&B's servers: no more losing track of which `.h5` or `.pb`
corresponds to which training runs.
For more advanced `wandb` features for storing, versioning, and distributing
models, check out our [Artifacts tools](https://www.wandb.com/artifacts).
```python
def test(model, test_loader):
model.eval()
# Run the model on some test examples
with torch.no_grad():
correct, total = 0, 0
for images, labels in test_loader:
images, labels = images.to(device), labels.to(device)
outputs = model(images)
_, predicted = torch.max(outputs.data, 1)
total += labels.size(0)
correct += (predicted == labels).sum().item()
print(f"Accuracy of the model on the {total} " +
f"test images: {correct / total:%}")
wandb.log({"test_accuracy": correct / total})
# Save the model in the exchangeable ONNX format
torch.onnx.export(model, images, "model.onnx")
wandb.save("model.onnx")
```
### Run training and watch your metrics live on wandb.ai
Now that we've defined the whole pipeline and slipped in
those few lines of W&B code,
we're ready to run our fully tracked experiment.
We'll report a few links to you:
our documentation,
the Project page, which organizes all the runs in a project, and
the Run page, where this run's results will be stored.
Navigate to the Run page and check out these tabs:
1. **Charts**, where the model gradients, parameter values, and loss are logged throughout training
2. **System**, which contains a variety of system metrics, including Disk I/O utilization, CPU and GPU metrics (watch that temperature soar), and more
3. **Logs**, which has a copy of anything pushed to standard out during training
4. **Files**, where, once training is complete, you can click on the `model.onnx` to view our network with the [Netron model viewer](https://github.com/lutzroeder/netron).
Once the run in finished, when the `with wandb.init` block exits,
we'll also print a summary of the results in the cell output.
```python
# Build, train and analyze the model with the pipeline
model = model_pipeline(config)
```
### Test Hyperparameters with Sweeps
We only looked at a single set of hyperparameters in this example.
But an important part of most ML workflows is iterating over
a number of hyperparameters.
You can use Weights & Biases Sweeps to automate hyperparameter testing and explore the space of possible models and optimization strategies.
## [Check out Hyperparameter Optimization in PyTorch using W&B Sweeps](http://wandb.me/sweeps-colab)
Running a hyperparameter sweep with Weights & Biases is very easy. There are just 3 simple steps:
1. **Define the sweep:** We do this by creating a dictionary or a [YAML file]({{< relref "/guides/models/sweeps/define-sweep-configuration" >}}) that specifies the parameters to search through, the search strategy, the optimization metric et all.
2. **Initialize the sweep:**
`sweep_id = wandb.sweep(sweep_config)`
3. **Run the sweep agent:**
`wandb.agent(sweep_id, function=train)`
That's all there is to running a hyperparameter sweep.
{{< img src="/images/tutorials/pytorch-2.png" alt="" >}}
## Example Gallery
See examples of projects tracked and visualized with W&B in our [Gallery →](https://app.wandb.ai/gallery)
## Advanced Setup
1. [Environment variables]({{< relref "/guides/hosting/env-vars/" >}}): Set API keys in environment variables so you can run training on a managed cluster.
2. [Offline mode]({{< relref "/support/kb-articles/run_wandb_offline.md" >}}): Use `dryrun` mode to train offline and sync results later.
3. [On-prem]({{< relref "/guides/hosting/hosting-options/self-managed" >}}): Install W&B in a private cloud or air-gapped servers in your own infrastructure. We have local installations for everyone from academics to enterprise teams.
4. [Sweeps]({{< relref "/guides/models/sweeps/" >}}): Set up hyperparameter search quickly with our lightweight tool for tuning.
# PyTorch Lightning
{{< cta-button colabLink="https://colab.research.google.com/github/wandb/examples/blob/master/colabs/pytorch-lightning/Image_Classification_using_PyTorch_Lightning.ipynb" >}}
We will build an image classification pipeline using PyTorch Lightning. We will follow this [style guide](https://lightning.ai/docs/pytorch/stable/starter/style_guide.html) to increase the readability and reproducibility of our code. A cool explanation of this available [here](https://wandb.ai/wandb/wandb-lightning/reports/Image-Classification-using-PyTorch-Lightning--VmlldzoyODk1NzY).
## Setting up PyTorch Lightning and W&B
For this tutorial, we need PyTorch Lightning and Weights and Biases.
```shell
pip install lightning -q
pip install wandb -qU
```
```python
import lightning.pytorch as pl
# your favorite machine learning tracking tool
from lightning.pytorch.loggers import WandbLogger
import torch
from torch import nn
from torch.nn import functional as F
from torch.utils.data import random_split, DataLoader
from torchmetrics import Accuracy
from torchvision import transforms
from torchvision.datasets import CIFAR10
import wandb
```
Now you'll need to log in to your wandb account.
```
wandb.login()
```
## DataModule - The Data Pipeline we Deserve
DataModules are a way of decoupling data-related hooks from the LightningModule so you can develop dataset agnostic models.
It organizes the data pipeline into one shareable and reusable class. A datamodule encapsulates the five steps involved in data processing in PyTorch:
- Download / tokenize / process.
- Clean and (maybe) save to disk.
- Load inside Dataset.
- Apply transforms (rotate, tokenize, etc…).
- Wrap inside a DataLoader.
Learn more about datamodules [here](https://lightning.ai/docs/pytorch/stable/data/datamodule.html). Let's build a datamodule for the Cifar-10 dataset.
```
class CIFAR10DataModule(pl.LightningDataModule):
def __init__(self, batch_size, data_dir: str = './'):
super().__init__()
self.data_dir = data_dir
self.batch_size = batch_size
self.transform = transforms.Compose([
transforms.ToTensor(),
transforms.Normalize((0.5, 0.5, 0.5), (0.5, 0.5, 0.5))
])
self.num_classes = 10
def prepare_data(self):
CIFAR10(self.data_dir, train=True, download=True)
CIFAR10(self.data_dir, train=False, download=True)
def setup(self, stage=None):
# Assign train/val datasets for use in dataloaders
if stage == 'fit' or stage is None:
cifar_full = CIFAR10(self.data_dir, train=True, transform=self.transform)
self.cifar_train, self.cifar_val = random_split(cifar_full, [45000, 5000])
# Assign test dataset for use in dataloader(s)
if stage == 'test' or stage is None:
self.cifar_test = CIFAR10(self.data_dir, train=False, transform=self.transform)
def train_dataloader(self):
return DataLoader(self.cifar_train, batch_size=self.batch_size, shuffle=True)
def val_dataloader(self):
return DataLoader(self.cifar_val, batch_size=self.batch_size)
def test_dataloader(self):
return DataLoader(self.cifar_test, batch_size=self.batch_size)
```
## Callbacks
A callback is a self-contained program that can be reused across projects. PyTorch Lightning comes with few [built-in callbacks](https://lightning.ai/docs/pytorch/latest/extensions/callbacks.html#built-in-callbacks) which are regularly used.
Learn more about callbacks in PyTorch Lightning [here](https://lightning.ai/docs/pytorch/latest/extensions/callbacks.html).
### Built-in Callbacks
In this tutorial, we will use [Early Stopping](https://lightning.ai/docs/pytorch/latest/api/lightning.pytorch.callbacks.EarlyStopping.html#lightning.callbacks.EarlyStopping) and [Model Checkpoint](https://lightning.ai/docs/pytorch/latest/api/lightning.pytorch.callbacks.ModelCheckpoint.html#pytorch_lightning.callbacks.ModelCheckpoint) built-in callbacks. They can be passed to the `Trainer`.
### Custom Callbacks
If you are familiar with Custom Keras callback, the ability to do the same in your PyTorch pipeline is just a cherry on the cake.
Since we are performing image classification, the ability to visualize the model's predictions on some samples of images can be helpful. This in the form of a callback can help debug the model at an early stage.
```
class ImagePredictionLogger(pl.callbacks.Callback):
def __init__(self, val_samples, num_samples=32):
super().__init__()
self.num_samples = num_samples
self.val_imgs, self.val_labels = val_samples
def on_validation_epoch_end(self, trainer, pl_module):
# Bring the tensors to CPU
val_imgs = self.val_imgs.to(device=pl_module.device)
val_labels = self.val_labels.to(device=pl_module.device)
# Get model prediction
logits = pl_module(val_imgs)
preds = torch.argmax(logits, -1)
# Log the images as wandb Image
trainer.logger.experiment.log({
"examples":[wandb.Image(x, caption=f"Pred:{pred}, Label:{y}")
for x, pred, y in zip(val_imgs[:self.num_samples],
preds[:self.num_samples],
val_labels[:self.num_samples])]
})
```
## LightningModule - Define the System
The LightningModule defines a system and not a model. Here a system groups all the research code into a single class to make it self-contained. `LightningModule` organizes your PyTorch code into 5 sections:
- Computations (`__init__`).
- Train loop (`training_step`)
- Validation loop (`validation_step`)
- Test loop (`test_step`)
- Optimizers (`configure_optimizers`)
One can thus build a dataset agnostic model that can be easily shared. Let's build a system for Cifar-10 classification.
```
class LitModel(pl.LightningModule):
def __init__(self, input_shape, num_classes, learning_rate=2e-4):
super().__init__()
# log hyperparameters
self.save_hyperparameters()
self.learning_rate = learning_rate
self.conv1 = nn.Conv2d(3, 32, 3, 1)
self.conv2 = nn.Conv2d(32, 32, 3, 1)
self.conv3 = nn.Conv2d(32, 64, 3, 1)
self.conv4 = nn.Conv2d(64, 64, 3, 1)
self.pool1 = torch.nn.MaxPool2d(2)
self.pool2 = torch.nn.MaxPool2d(2)
n_sizes = self._get_conv_output(input_shape)
self.fc1 = nn.Linear(n_sizes, 512)
self.fc2 = nn.Linear(512, 128)
self.fc3 = nn.Linear(128, num_classes)
self.accuracy = Accuracy(task='multiclass', num_classes=num_classes)
# returns the size of the output tensor going into Linear layer from the conv block.
def _get_conv_output(self, shape):
batch_size = 1
input = torch.autograd.Variable(torch.rand(batch_size, *shape))
output_feat = self._forward_features(input)
n_size = output_feat.data.view(batch_size, -1).size(1)
return n_size
# returns the feature tensor from the conv block
def _forward_features(self, x):
x = F.relu(self.conv1(x))
x = self.pool1(F.relu(self.conv2(x)))
x = F.relu(self.conv3(x))
x = self.pool2(F.relu(self.conv4(x)))
return x
# will be used during inference
def forward(self, x):
x = self._forward_features(x)
x = x.view(x.size(0), -1)
x = F.relu(self.fc1(x))
x = F.relu(self.fc2(x))
x = F.log_softmax(self.fc3(x), dim=1)
return x
def training_step(self, batch, batch_idx):
x, y = batch
logits = self(x)
loss = F.nll_loss(logits, y)
# training metrics
preds = torch.argmax(logits, dim=1)
acc = self.accuracy(preds, y)
self.log('train_loss', loss, on_step=True, on_epoch=True, logger=True)
self.log('train_acc', acc, on_step=True, on_epoch=True, logger=True)
return loss
def validation_step(self, batch, batch_idx):
x, y = batch
logits = self(x)
loss = F.nll_loss(logits, y)
# validation metrics
preds = torch.argmax(logits, dim=1)
acc = self.accuracy(preds, y)
self.log('val_loss', loss, prog_bar=True)
self.log('val_acc', acc, prog_bar=True)
return loss
def test_step(self, batch, batch_idx):
x, y = batch
logits = self(x)
loss = F.nll_loss(logits, y)
# validation metrics
preds = torch.argmax(logits, dim=1)
acc = self.accuracy(preds, y)
self.log('test_loss', loss, prog_bar=True)
self.log('test_acc', acc, prog_bar=True)
return loss
def configure_optimizers(self):
optimizer = torch.optim.Adam(self.parameters(), lr=self.learning_rate)
return optimizer
```
## Train and Evaluate
Now that we have organized our data pipeline using `DataModule` and model architecture+training loop using `LightningModule`, the PyTorch Lightning `Trainer` automates everything else for us.
The Trainer automates:
- Epoch and batch iteration
- Calling of `optimizer.step()`, `backward`, `zero_grad()`
- Calling of `.eval()`, enabling/disabling grads
- Saving and loading weights
- Weights and Biases logging
- Multi-GPU training support
- TPU support
- 16-bit training support
```
dm = CIFAR10DataModule(batch_size=32)
# To access the x_dataloader we need to call prepare_data and setup.
dm.prepare_data()
dm.setup()
# Samples required by the custom ImagePredictionLogger callback to log image predictions.
val_samples = next(iter(dm.val_dataloader()))
val_imgs, val_labels = val_samples[0], val_samples[1]
val_imgs.shape, val_labels.shape
```
```
model = LitModel((3, 32, 32), dm.num_classes)
# Initialize wandb logger
wandb_logger = WandbLogger(project='wandb-lightning', job_type='train')
# Initialize Callbacks
early_stop_callback = pl.callbacks.EarlyStopping(monitor="val_loss")
checkpoint_callback = pl.callbacks.ModelCheckpoint()
# Initialize a trainer
trainer = pl.Trainer(max_epochs=2,
logger=wandb_logger,
callbacks=[early_stop_callback,
ImagePredictionLogger(val_samples),
checkpoint_callback],
)
# Train the model
trainer.fit(model, dm)
# Evaluate the model on the held-out test set ⚡⚡
trainer.test(dataloaders=dm.test_dataloader())
# Close wandb run
wandb.finish()
```
## Final Thoughts
I come from the TensorFlow/Keras ecosystem and find PyTorch a bit overwhelming even though it's an elegant framework. Just my personal experience though. While exploring PyTorch Lightning, I realized that almost all of the reasons that kept me away from PyTorch is taken care of. Here's a quick summary of my excitement:
- Then: Conventional PyTorch model definition used to be all over the place. With the model in some `model.py` script and the training loop in the `train.py `file. It was a lot of looking back and forth to understand the pipeline.
- Now: The `LightningModule` acts as a system where the model is defined along with the `training_step`, `validation_step`, etc. Now it's modular and shareable.
- Then: The best part about TensorFlow/Keras is the input data pipeline. Their dataset catalog is rich and growing. PyTorch's data pipeline used to be the biggest pain point. In normal PyTorch code, the data download/cleaning/preparation is usually scattered across many files.
- Now: The DataModule organizes the data pipeline into one shareable and reusable class. It's simply a collection of a `train_dataloader`, `val_dataloader`(s), `test_dataloader`(s) along with the matching transforms and data processing/downloads steps required.
- Then: With Keras, one can call `model.fit` to train the model and `model.predict` to run inference on. `model.evaluate` offered a good old simple evaluation on the test data. This is not the case with PyTorch. One will usually find separate `train.py` and `test.py` files.
- Now: With the `LightningModule` in place, the `Trainer` automates everything. One needs to just call `trainer.fit` and `trainer.test` to train and evaluate the model.
- Then: TensorFlow loves TPU, PyTorch...
- Now: With PyTorch Lightning, it's so easy to train the same model with multiple GPUs and even on TPU.
- Then: I am a big fan of Callbacks and prefer writing custom callbacks. Something as trivial as Early Stopping used to be a point of discussion with conventional PyTorch.
- Now: With PyTorch Lightning using Early Stopping and Model Checkpointing is a piece of cake. I can even write custom callbacks.
## 🎨 Conclusion and Resources
I hope you find this report helpful. I will encourage to play with the code and train an image classifier with a dataset of your choice.
Here are some resources to learn more about PyTorch Lightning:
- [Step-by-step walk-through](https://lightning.ai/docs/pytorch/latest/starter/introduction.html) - This is one of the official tutorials. Their documentation is really well written and I highly encourage it as a good learning resource.
- [Use Pytorch Lightning with Weights & Biases](https://wandb.me/lightning) - This is a quick colab that you can run through to learn more about how to use W&B with PyTorch Lightning.
# Hugging Face
{{< img src="/images/tutorials/huggingface.png" alt="" >}}
{{< cta-button colabLink="https://colab.research.google.com/github/wandb/examples/blob/master/colabs/huggingface/Huggingface_wandb.ipynb" >}}
Visualize your [Hugging Face](https://github.com/huggingface/transformers) model's performance quickly with a seamless [W&B](https://wandb.ai/site) integration.
Compare hyperparameters, output metrics, and system stats like GPU utilization across your models.
## Why should I use W&B?
{.skipvale}
{{< img src="/images/tutorials/huggingface-why.png" alt="" >}}
- **Unified dashboard**: Central repository for all your model metrics and predictions
- **Lightweight**: No code changes required to integrate with Hugging Face
- **Accessible**: Free for individuals and academic teams
- **Secure**: All projects are private by default
- **Trusted**: Used by machine learning teams at OpenAI, Toyota, Lyft and more
Think of W&B like GitHub for machine learning models— save machine learning experiments to your private, hosted dashboard. Experiment quickly with the confidence that all the versions of your models are saved for you, no matter where you're running your scripts.
W&B lightweight integrations works with any Python script, and all you need to do is sign up for a free W&B account to start tracking and visualizing your models.
In the Hugging Face Transformers repo, we've instrumented the Trainer to automatically log training and evaluation metrics to W&B at each logging step.
Here's an in depth look at how the integration works: [Hugging Face + W&B Report](https://app.wandb.ai/jxmorris12/huggingface-demo/reports/Train-a-model-with-Hugging-Face-and-Weights-%26-Biases--VmlldzoxMDE2MTU).
## Install, import, and log in
Install the Hugging Face and Weights & Biases libraries, and the GLUE dataset and training script for this tutorial.
- [Hugging Face Transformers](https://github.com/huggingface/transformers): Natural language models and datasets
- [Weights & Biases]({{< relref "/" >}}): Experiment tracking and visualization
- [GLUE dataset](https://gluebenchmark.com/): A language understanding benchmark dataset
- [GLUE script](https://raw.githubusercontent.com/huggingface/transformers/refs/heads/main/examples/pytorch/text-classification/run_glue.py): Model training script for sequence classification
```notebook
!pip install datasets wandb evaluate accelerate -qU
!wget https://raw.githubusercontent.com/huggingface/transformers/refs/heads/main/examples/pytorch/text-classification/run_glue.py
```
```notebook
# the run_glue.py script requires transformers dev
!pip install -q git+https://github.com/huggingface/transformers
```
Before continuing, [sign up for a free account](https://app.wandb.ai/login?signup=true).
## Put in your API key
Once you've signed up, run the next cell and click on the link to get your API key and authenticate this notebook.
```python
import wandb
wandb.login()
```
Optionally, we can set environment variables to customize W&B logging. See [documentation]({{< relref "/guides/integrations/huggingface/" >}}).
```python
# Optional: log both gradients and parameters
%env WANDB_WATCH=all
```
## Train the model
Next, call the downloaded training script [run_glue.py](https://huggingface.co/transformers/examples.html#glue) and see training automatically get tracked to the Weights & Biases dashboard. This script fine-tunes BERT on the Microsoft Research Paraphrase Corpus— pairs of sentences with human annotations indicating whether they are semantically equivalent.
```python
%env WANDB_PROJECT=huggingface-demo
%env TASK_NAME=MRPC
!python run_glue.py \
--model_name_or_path bert-base-uncased \
--task_name $TASK_NAME \
--do_train \
--do_eval \
--max_seq_length 256 \
--per_device_train_batch_size 32 \
--learning_rate 2e-4 \
--num_train_epochs 3 \
--output_dir /tmp/$TASK_NAME/ \
--overwrite_output_dir \
--logging_steps 50
```
## Visualize results in dashboard
Click the link printed out above, or go to [wandb.ai](https://app.wandb.ai) to see your results stream in live. The link to see your run in the browser will appear after all the dependencies are loaded. Look for the following output: "**wandb**: 🚀 View run at [URL to your unique run]"
**Visualize Model Performance**
It's easy to look across dozens of experiments, zoom in on interesting findings, and visualize highly dimensional data.
{{< img src="/images/tutorials/huggingface-visualize.gif" alt="" >}}
**Compare Architectures**
Here's an example comparing [BERT vs DistilBERT](https://app.wandb.ai/jack-morris/david-vs-goliath/reports/Does-model-size-matter%3F-Comparing-BERT-and-DistilBERT-using-Sweeps--VmlldzoxMDUxNzU). It's easy to see how different architectures effect the evaluation accuracy throughout training with automatic line plot visualizations.
{{< img src="/images/tutorials/huggingface-comparearchitectures.gif" alt="" >}}
## Track key information effortlessly by default
Weights & Biases saves a new run for each experiment. Here's the information that gets saved by default:
- **Hyperparameters**: Settings for your model are saved in Config
- **Model Metrics**: Time series data of metrics streaming in are saved in Log
- **Terminal Logs**: Command line outputs are saved and available in a tab
- **System Metrics**: GPU and CPU utilization, memory, temperature etc.
## Learn more
- [Documentation]({{< relref "/guides/integrations/huggingface" >}}): docs on the Weights & Biases and Hugging Face integration
- [Videos](http://wandb.me/youtube): tutorials, interviews with practitioners, and more on our YouTube channel
- Contact: Message us at contact@wandb.com with questions
# TensorFlow
{{< cta-button colabLink="https://colab.research.google.com/github/wandb/examples/blob/master/colabs/tensorflow/Simple_TensorFlow_Integration.ipynb" >}}
## What this notebook covers
* Easy integration of Weights and Biases with your TensorFlow pipeline for experiment tracking.
* Computing metrics with `keras.metrics`
* Using `wandb.log` to log those metrics in your custom training loop.
{{< img src="/images/tutorials/tensorflow/dashboard.png" alt="dashboard" >}}
**Note**: Sections starting with _Step_ are all you need to integrate W&B into existing code. The rest is just a standard MNIST example.
```python
import os
import matplotlib.pyplot as plt
import numpy as np
import pandas as pd
import tensorflow as tf
from tensorflow import keras
from tensorflow.keras.datasets import cifar10
```
## Install, Import, Login
### Install W&B
```jupyter
%%capture
!pip install wandb
```
### Import W&B and login
```python
import wandb
from wandb.integration.keras import WandbMetricsLogger
wandb.login()
```
> Side note: If this is your first time using W&B or you are not logged in, the link that appears after running `wandb.login()` will take you to sign-up/login page. Signing up is as easy as one click.
### Prepare Dataset
```python
# Prepare the training dataset
BATCH_SIZE = 64
(x_train, y_train), (x_test, y_test) = keras.datasets.mnist.load_data()
x_train = np.reshape(x_train, (-1, 784))
x_test = np.reshape(x_test, (-1, 784))
# build input pipeline using tf.data
train_dataset = tf.data.Dataset.from_tensor_slices((x_train, y_train))
train_dataset = train_dataset.shuffle(buffer_size=1024).batch(BATCH_SIZE)
val_dataset = tf.data.Dataset.from_tensor_slices((x_test, y_test))
val_dataset = val_dataset.batch(BATCH_SIZE)
```
## Define the Model and the Training Loop
```python
def make_model():
inputs = keras.Input(shape=(784,), name="digits")
x1 = keras.layers.Dense(64, activation="relu")(inputs)
x2 = keras.layers.Dense(64, activation="relu")(x1)
outputs = keras.layers.Dense(10, name="predictions")(x2)
return keras.Model(inputs=inputs, outputs=outputs)
```
```python
def train_step(x, y, model, optimizer, loss_fn, train_acc_metric):
with tf.GradientTape() as tape:
logits = model(x, training=True)
loss_value = loss_fn(y, logits)
grads = tape.gradient(loss_value, model.trainable_weights)
optimizer.apply_gradients(zip(grads, model.trainable_weights))
train_acc_metric.update_state(y, logits)
return loss_value
```
```python
def test_step(x, y, model, loss_fn, val_acc_metric):
val_logits = model(x, training=False)
loss_value = loss_fn(y, val_logits)
val_acc_metric.update_state(y, val_logits)
return loss_value
```
## Add `wandb.log` to your training loop
```python
def train(
train_dataset,
val_dataset,
model,
optimizer,
train_acc_metric,
val_acc_metric,
epochs=10,
log_step=200,
val_log_step=50,
):
for epoch in range(epochs):
print("\nStart of epoch %d" % (epoch,))
train_loss = []
val_loss = []
# Iterate over the batches of the dataset
for step, (x_batch_train, y_batch_train) in enumerate(train_dataset):
loss_value = train_step(
x_batch_train,
y_batch_train,
model,
optimizer,
loss_fn,
train_acc_metric,
)
train_loss.append(float(loss_value))
# Run a validation loop at the end of each epoch
for step, (x_batch_val, y_batch_val) in enumerate(val_dataset):
val_loss_value = test_step(
x_batch_val, y_batch_val, model, loss_fn, val_acc_metric
)
val_loss.append(float(val_loss_value))
# Display metrics at the end of each epoch
train_acc = train_acc_metric.result()
print("Training acc over epoch: %.4f" % (float(train_acc),))
val_acc = val_acc_metric.result()
print("Validation acc: %.4f" % (float(val_acc),))
# Reset metrics at the end of each epoch
train_acc_metric.reset_states()
val_acc_metric.reset_states()
# ⭐: log metrics using wandb.log
wandb.log(
{
"epochs": epoch,
"loss": np.mean(train_loss),
"acc": float(train_acc),
"val_loss": np.mean(val_loss),
"val_acc": float(val_acc),
}
)
```
## Run Training
### Call `wandb.init` to start a run
This lets us know you're launching an experiment,
so we can give it a unique ID and a dashboard.
[Check out the official documentation]({{< relref "/ref/python/init" >}})
```python
# initialize wandb with your project name and optionally with configuration.
# play around with the config values and see the result on your wandb dashboard.
config = {
"learning_rate": 0.001,
"epochs": 10,
"batch_size": 64,
"log_step": 200,
"val_log_step": 50,
"architecture": "CNN",
"dataset": "CIFAR-10",
}
run = wandb.init(project='my-tf-integration', config=config)
config = run.config
# Initialize model.
model = make_model()
# Instantiate an optimizer to train the model.
optimizer = keras.optimizers.SGD(learning_rate=config.learning_rate)
# Instantiate a loss function.
loss_fn = keras.losses.SparseCategoricalCrossentropy(from_logits=True)
# Prepare the metrics.
train_acc_metric = keras.metrics.SparseCategoricalAccuracy()
val_acc_metric = keras.metrics.SparseCategoricalAccuracy()
train(
train_dataset,
val_dataset,
model,
optimizer,
train_acc_metric,
val_acc_metric,
epochs=config.epochs,
log_step=config.log_step,
val_log_step=config.val_log_step,
)
run.finish() # In Jupyter/Colab, let us know you're finished!
```
### Visualize Results
Click on the [**run page**]({{< relref "/guides/models/track/runs/#view-logged-runs" >}}) link above to see your live results.
## Sweep 101
Use Weights & Biases Sweeps to automate hyperparameter optimization and explore the space of possible models.
## [Check out Hyperparameter Optimization in TensorFlow using W&B Sweeps](http://wandb.me/tf-sweeps-colab)
### Benefits of using W&B Sweeps
* **Quick setup**: With just a few lines of code you can run W&B sweeps.
* **Transparent**: We cite all the algorithms we're using, and [our code is open source](https://github.com/wandb/sweeps).
* **Powerful**: Our sweeps are completely customizable and configurable. You can launch a sweep across dozens of machines, and it's just as easy as starting a sweep on your laptop.
{{< img src="/images/tutorials/tensorflow/sweeps.png" alt="Sweep result" >}}
## Example Gallery
See examples of projects tracked and visualized with W&B in our gallery of examples, [Fully Connected →](https://wandb.me/fc)
## Best Practices
1. **Projects**: Log multiple runs to a project to compare them. `wandb.init(project="project-name")`
2. **Groups**: For multiple processes or cross validation folds, log each process as a runs and group them together. `wandb.init(group="experiment-1")`
3. **Tags**: Add tags to track your current baseline or production model.
4. **Notes**: Type notes in the table to track the changes between runs.
5. **Reports**: Take quick notes on progress to share with colleagues and make dashboards and snapshots of your ML projects.
### Advanced Setup
1. [Environment variables]({{< relref "/guides/hosting/env-vars/" >}}): Set API keys in environment variables so you can run training on a managed cluster.
2. [Offline mode]({{< relref "/support/kb-articles/run_wandb_offline.md" >}})
3. [On-prem]({{< relref "/guides/hosting/hosting-options/self-managed" >}}): Install W&B in a private cloud or air-gapped servers in your own infrastructure. We have local installations for everyone from academics to enterprise teams.
4. [Artifacts]({{< relref "/guides/core/artifacts/" >}}): Track and version models and datasets in a streamlined way that automatically picks up your pipeline steps as you train models.
# TensorFlow Sweeps
{{< cta-button colabLink="https://colab.research.google.com/github/wandb/examples/blob/master/colabs/tensorflow/Hyperparameter_Optimization_in_TensorFlow_using_W&B_Sweeps.ipynb" >}}
Use W&B for machine learning experiment tracking, dataset versioning, and project collaboration.
{{< img src="/images/tutorials/huggingface-why.png" alt="" >}}
Use W&B Sweeps to automate hyperparameter optimization and explore model possibilities with interactive dashboards:
{{< img src="/images/tutorials/tensorflow/sweeps.png" alt="" >}}
## Why use sweeps
* **Quick setup**: Run W&B sweeps with a few lines of code.
* **Transparent**: The project cites all algorithms used, and the [code is open source](https://github.com/wandb/wandb/blob/main/wandb/apis/public/sweeps.py).
* **Powerful**: Sweeps provide customization options and can run on multiple machines or a laptop with ease.
For more information, see the [Sweep documentation]({{< relref "/guides/models/sweeps/" >}}).
## What this notebook covers
* Steps to start with W&B Sweep and a custom training loop in TensorFlow.
* Finding best hyperparameters for image classification tasks.
**Note**: Sections starting with _Step_ show necessary code to perform a hyperparameter sweep. The rest sets up a simple example.
## Install, import, and log in
### Install W&B
```bash
pip install wandb
```
### Import W&B and log in
```python
import tqdm
import tensorflow as tf
from tensorflow import keras
from tensorflow.keras.datasets import cifar10
import os
import numpy as np
import pandas as pd
import matplotlib.pyplot as plt
```
```python
import wandb
from wandb.integration.keras import WandbMetricsLogger
wandb.login()
```
{{< alert >}}
If you are new to W&B or not logged in, the link after running `wandb.login()` directs to the sign-up/login page.
{{< /alert >}}
## Prepare dataset
```python
# Prepare the training dataset
(x_train, y_train), (x_test, y_test) = keras.datasets.mnist.load_data()
x_train = x_train / 255.0
x_test = x_test / 255.0
x_train = np.reshape(x_train, (-1, 784))
x_test = np.reshape(x_test, (-1, 784))
```
## Build a classifier MLP
```python
def Model():
inputs = keras.Input(shape=(784,), name="digits")
x1 = keras.layers.Dense(64, activation="relu")(inputs)
x2 = keras.layers.Dense(64, activation="relu")(x1)
outputs = keras.layers.Dense(10, name="predictions")(x2)
return keras.Model(inputs=inputs, outputs=outputs)
def train_step(x, y, model, optimizer, loss_fn, train_acc_metric):
with tf.GradientTape() as tape:
logits = model(x, training=True)
loss_value = loss_fn(y, logits)
grads = tape.gradient(loss_value, model.trainable_weights)
optimizer.apply_gradients(zip(grads, model.trainable_weights))
train_acc_metric.update_state(y, logits)
return loss_value
def test_step(x, y, model, loss_fn, val_acc_metric):
val_logits = model(x, training=False)
loss_value = loss_fn(y, val_logits)
val_acc_metric.update_state(y, val_logits)
return loss_value
```
## Write a training loop
```python
def train(
train_dataset,
val_dataset,
model,
optimizer,
loss_fn,
train_acc_metric,
val_acc_metric,
epochs=10,
log_step=200,
val_log_step=50,
):
for epoch in range(epochs):
print("\nStart of epoch %d" % (epoch,))
train_loss = []
val_loss = []
# Iterate over the batches of the dataset
for step, (x_batch_train, y_batch_train) in tqdm.tqdm(
enumerate(train_dataset), total=len(train_dataset)
):
loss_value = train_step(
x_batch_train,
y_batch_train,
model,
optimizer,
loss_fn,
train_acc_metric,
)
train_loss.append(float(loss_value))
# Run a validation loop at the end of each epoch
for step, (x_batch_val, y_batch_val) in enumerate(val_dataset):
val_loss_value = test_step(
x_batch_val, y_batch_val, model, loss_fn, val_acc_metric
)
val_loss.append(float(val_loss_value))
# Display metrics at the end of each epoch
train_acc = train_acc_metric.result()
print("Training acc over epoch: %.4f" % (float(train_acc),))
val_acc = val_acc_metric.result()
print("Validation acc: %.4f" % (float(val_acc),))
# Reset metrics at the end of each epoch
train_acc_metric.reset_states()
val_acc_metric.reset_states()
# 3️⃣ log metrics using wandb.log
wandb.log(
{
"epochs": epoch,
"loss": np.mean(train_loss),
"acc": float(train_acc),
"val_loss": np.mean(val_loss),
"val_acc": float(val_acc),
}
)
```
## Configure the sweep
Steps to configure the sweep:
* Define the hyperparameters to optimize
* Choose the optimization method: `random`, `grid`, or `bayes`
* Set a goal and metric for `bayes`, like minimizing `val_loss`
* Use `hyperband` for early termination of performing runs
See more in the [W&B Sweeps documentation]({{< relref "/guides/models/sweeps/define-sweep-configuration" >}}).
```python
sweep_config = {
"method": "random",
"metric": {"name": "val_loss", "goal": "minimize"},
"early_terminate": {"type": "hyperband", "min_iter": 5},
"parameters": {
"batch_size": {"values": [32, 64, 128, 256]},
"learning_rate": {"values": [0.01, 0.005, 0.001, 0.0005, 0.0001]},
},
}
```
## Wrap the training loop
Create a function, like `sweep_train`,
which uses `wandb.config` to set hyperparameters before calling `train`.
```python
def sweep_train(config_defaults=None):
# Set default values
config_defaults = {"batch_size": 64, "learning_rate": 0.01}
# Initialize wandb with a sample project name
wandb.init(config=config_defaults) # this gets over-written in the Sweep
# Specify the other hyperparameters to the configuration, if any
wandb.config.epochs = 2
wandb.config.log_step = 20
wandb.config.val_log_step = 50
wandb.config.architecture_name = "MLP"
wandb.config.dataset_name = "MNIST"
# build input pipeline using tf.data
train_dataset = tf.data.Dataset.from_tensor_slices((x_train, y_train))
train_dataset = (
train_dataset.shuffle(buffer_size=1024)
.batch(wandb.config.batch_size)
.prefetch(buffer_size=tf.data.AUTOTUNE)
)
val_dataset = tf.data.Dataset.from_tensor_slices((x_test, y_test))
val_dataset = val_dataset.batch(wandb.config.batch_size).prefetch(
buffer_size=tf.data.AUTOTUNE
)
# initialize model
model = Model()
# Instantiate an optimizer to train the model.
optimizer = keras.optimizers.SGD(learning_rate=wandb.config.learning_rate)
# Instantiate a loss function.
loss_fn = keras.losses.SparseCategoricalCrossentropy(from_logits=True)
# Prepare the metrics.
train_acc_metric = keras.metrics.SparseCategoricalAccuracy()
val_acc_metric = keras.metrics.SparseCategoricalAccuracy()
train(
train_dataset,
val_dataset,
model,
optimizer,
loss_fn,
train_acc_metric,
val_acc_metric,
epochs=wandb.config.epochs,
log_step=wandb.config.log_step,
val_log_step=wandb.config.val_log_step,
)
```
## Initialize sweep and run personal digital assistant
```python
sweep_id = wandb.sweep(sweep_config, project="sweeps-tensorflow")
```
Limit the number of runs with the `count` parameter. Set to 10 for quick execution. Increase as needed.
```python
wandb.agent(sweep_id, function=sweep_train, count=10)
```
## Visualize results
Click on the **Sweep URL** link preceding to view live results.
## Example gallery
Explore projects tracked and visualized with W&B in the [Gallery](https://app.wandb.ai/gallery).
## Best practices
1. **Projects**: Log multiple runs to a project to compare them. `wandb.init(project="project-name")`
2. **Groups**: Log each process as a run for multiple processes or cross-validation folds, and group them. `wandb.init(group='experiment-1')`
3. **Tags**: Use tags to track your baseline or production model.
4. **Notes**: Enter notes in the table to track changes between runs.
5. **Reports**: Use reports for progress notes, sharing with colleagues, and creating ML project dashboards and snapshots.
## Advanced setup
1. [Environment variables]({{< relref "/guides/hosting/env-vars/" >}}): Set API keys for training on a managed cluster.
2. [Offline mode]({{< relref "/support/kb-articles/run_wandb_offline.md" >}})
3. [On-prem]({{< relref "/guides/hosting/hosting-options/self-managed" >}}): Install W&B in a private cloud or air-gapped servers in your infrastructure. Local installations suit academics and enterprise teams.
# 3D brain tumor segmentation with MONAI
{{< cta-button colabLink="https://colab.research.google.com/github/wandb/examples/blob/master/colabs/monai/3d_brain_tumor_segmentation.ipynb" >}}
This tutorial demonstrates how to construct a training workflow of multi-labels 3D brain tumor segmentation task using [MONAI](https://github.com/Project-MONAI/MONAI) and use experiment tracking and data visualization features of [Weights & Biases](https://wandb.ai/site). The tutorial contains the following features:
1. Initialize a Weights & Biases run and synchronize all configs associated with the run for reproducibility.
2. MONAI transform API:
1. MONAI Transforms for dictionary format data.
2. How to define a new transform according to MONAI `transforms` API.
3. How to randomly adjust intensity for data augmentation.
3. Data Loading and Visualization:
1. Load `Nifti` image with metadata, load a list of images and stack them.
2. Cache IO and transforms to accelerate training and validation.
3. Visualize the data using `wandb.Table` and interactive segmentation overlay on Weights & Biases.
4. Training a 3D `SegResNet` model
1. Using the `networks`, `losses`, and `metrics` APIs from MONAI.
2. Training the 3D `SegResNet` model using a PyTorch training loop.
3. Track the training experiment using Weights & Biases.
4. Log and version model checkpoints as model artifacts on Weights & Biases.
5. Visualize and compare the predictions on the validation dataset using `wandb.Table` and interactive segmentation overlay on Weights & Biases.
## Setup and Installation
First, install the latest version of both MONAI and Weights and Biases.
```python
!python -c "import monai" || pip install -q -U "monai[nibabel, tqdm]"
!python -c "import wandb" || pip install -q -U wandb
```
```python
import os
import numpy as np
from tqdm.auto import tqdm
import wandb
from monai.apps import DecathlonDataset
from monai.data import DataLoader, decollate_batch
from monai.losses import DiceLoss
from monai.inferers import sliding_window_inference
from monai.metrics import DiceMetric
from monai.networks.nets import SegResNet
from monai.transforms import (
Activations,
AsDiscrete,
Compose,
LoadImaged,
MapTransform,
NormalizeIntensityd,
Orientationd,
RandFlipd,
RandScaleIntensityd,
RandShiftIntensityd,
RandSpatialCropd,
Spacingd,
EnsureTyped,
EnsureChannelFirstd,
)
from monai.utils import set_determinism
import torch
```
Then, authenticate the Colab instance to use W&B.
```python
wandb.login()
```
## Initialize a W&B Run
Start a new W&B run to start tracking the experiment.
```python
wandb.init(project="monai-brain-tumor-segmentation")
```
Use of proper config system is a recommended best practice for reproducible machine learning. You can track the hyperparameters for every experiment using W&B.
```python
config = wandb.config
config.seed = 0
config.roi_size = [224, 224, 144]
config.batch_size = 1
config.num_workers = 4
config.max_train_images_visualized = 20
config.max_val_images_visualized = 20
config.dice_loss_smoothen_numerator = 0
config.dice_loss_smoothen_denominator = 1e-5
config.dice_loss_squared_prediction = True
config.dice_loss_target_onehot = False
config.dice_loss_apply_sigmoid = True
config.initial_learning_rate = 1e-4
config.weight_decay = 1e-5
config.max_train_epochs = 50
config.validation_intervals = 1
config.dataset_dir = "./dataset/"
config.checkpoint_dir = "./checkpoints"
config.inference_roi_size = (128, 128, 64)
config.max_prediction_images_visualized = 20
```
You also need to set the random seed for modules to enable or turn off deterministic training.
```python
set_determinism(seed=config.seed)
# Create directories
os.makedirs(config.dataset_dir, exist_ok=True)
os.makedirs(config.checkpoint_dir, exist_ok=True)
```
## Data Loading and Transformation
Here, use the `monai.transforms` API to create a custom transform that converts the multi-classes labels into multi-labels segmentation task in one-hot format.
```python
class ConvertToMultiChannelBasedOnBratsClassesd(MapTransform):
"""
Convert labels to multi channels based on brats classes:
label 1 is the peritumoral edema
label 2 is the GD-enhancing tumor
label 3 is the necrotic and non-enhancing tumor core
The possible classes are TC (Tumor core), WT (Whole tumor)
and ET (Enhancing tumor).
Reference: https://github.com/Project-MONAI/tutorials/blob/main/3d_segmentation/brats_segmentation_3d.ipynb
"""
def __call__(self, data):
d = dict(data)
for key in self.keys:
result = []
# merge label 2 and label 3 to construct TC
result.append(torch.logical_or(d[key] == 2, d[key] == 3))
# merge labels 1, 2 and 3 to construct WT
result.append(
torch.logical_or(
torch.logical_or(d[key] == 2, d[key] == 3), d[key] == 1
)
)
# label 2 is ET
result.append(d[key] == 2)
d[key] = torch.stack(result, axis=0).float()
return d
```
Next, set up transforms for training and validation datasets respectively.
```python
train_transform = Compose(
[
# load 4 Nifti images and stack them together
LoadImaged(keys=["image", "label"]),
EnsureChannelFirstd(keys="image"),
EnsureTyped(keys=["image", "label"]),
ConvertToMultiChannelBasedOnBratsClassesd(keys="label"),
Orientationd(keys=["image", "label"], axcodes="RAS"),
Spacingd(
keys=["image", "label"],
pixdim=(1.0, 1.0, 1.0),
mode=("bilinear", "nearest"),
),
RandSpatialCropd(
keys=["image", "label"], roi_size=config.roi_size, random_size=False
),
RandFlipd(keys=["image", "label"], prob=0.5, spatial_axis=0),
RandFlipd(keys=["image", "label"], prob=0.5, spatial_axis=1),
RandFlipd(keys=["image", "label"], prob=0.5, spatial_axis=2),
NormalizeIntensityd(keys="image", nonzero=True, channel_wise=True),
RandScaleIntensityd(keys="image", factors=0.1, prob=1.0),
RandShiftIntensityd(keys="image", offsets=0.1, prob=1.0),
]
)
val_transform = Compose(
[
LoadImaged(keys=["image", "label"]),
EnsureChannelFirstd(keys="image"),
EnsureTyped(keys=["image", "label"]),
ConvertToMultiChannelBasedOnBratsClassesd(keys="label"),
Orientationd(keys=["image", "label"], axcodes="RAS"),
Spacingd(
keys=["image", "label"],
pixdim=(1.0, 1.0, 1.0),
mode=("bilinear", "nearest"),
),
NormalizeIntensityd(keys="image", nonzero=True, channel_wise=True),
]
)
```
### The Dataset
The dataset used for this experiment comes from http://medicaldecathlon.com/. It uses multi-modal multi-site MRI data (FLAIR, T1w, T1gd, T2w) to segment Gliomas, necrotic/active tumour, and oedema. The dataset consists of 750 4D volumes (484 Training + 266 Testing).
Use the `DecathlonDataset` to automatically download and extract the dataset. It inherits MONAI `CacheDataset` which enables you to set `cache_num=N` to cache `N` items for training and use the default arguments to cache all the items for validation, depending on your memory size.
```python
train_dataset = DecathlonDataset(
root_dir=config.dataset_dir,
task="Task01_BrainTumour",
transform=val_transform,
section="training",
download=True,
cache_rate=0.0,
num_workers=4,
)
val_dataset = DecathlonDataset(
root_dir=config.dataset_dir,
task="Task01_BrainTumour",
transform=val_transform,
section="validation",
download=False,
cache_rate=0.0,
num_workers=4,
)
```
{{% alert %}}
**Note:** Instead of applying the `train_transform` to the `train_dataset`, apply `val_transform` to both the training and validation datasets. This is because, before training, you would be visualizing samples from both the splits of the dataset.
{{% /alert %}}
### Visualizing the Dataset
Weights & Biases supports images, video, audio, and more. You can log rich media to explore your results and visually compare our runs, models, and datasets. Use the [segmentation mask overlay system]({{< relref "/guides/models/track/log/media/#image-overlays-in-tables" >}}) to visualize our data volumes. To log segmentation masks in [tables]({{< relref "/guides/models/tables/" >}}), you must provide a `wandb.Image` object for each row in the table.
An example is provided in the pseudocode below:
```python
table = wandb.Table(columns=["ID", "Image"])
for id, img, label in zip(ids, images, labels):
mask_img = wandb.Image(
img,
masks={
"prediction": {"mask_data": label, "class_labels": class_labels}
# ...
},
)
table.add_data(id, img)
wandb.log({"Table": table})
```
Now write a simple utility function that takes a sample image, label, `wandb.Table` object and some associated metadata and populate the rows of a table that would be logged to the Weights & Biases dashboard.
```python
def log_data_samples_into_tables(
sample_image: np.array,
sample_label: np.array,
split: str = None,
data_idx: int = None,
table: wandb.Table = None,
):
num_channels, _, _, num_slices = sample_image.shape
with tqdm(total=num_slices, leave=False) as progress_bar:
for slice_idx in range(num_slices):
ground_truth_wandb_images = []
for channel_idx in range(num_channels):
ground_truth_wandb_images.append(
masks = {
"ground-truth/Tumor-Core": {
"mask_data": sample_label[0, :, :, slice_idx],
"class_labels": {0: "background", 1: "Tumor Core"},
},
"ground-truth/Whole-Tumor": {
"mask_data": sample_label[1, :, :, slice_idx] * 2,
"class_labels": {0: "background", 2: "Whole Tumor"},
},
"ground-truth/Enhancing-Tumor": {
"mask_data": sample_label[2, :, :, slice_idx] * 3,
"class_labels": {0: "background", 3: "Enhancing Tumor"},
},
}
wandb.Image(
sample_image[channel_idx, :, :, slice_idx],
masks=masks,
)
)
table.add_data(split, data_idx, slice_idx, *ground_truth_wandb_images)
progress_bar.update(1)
return table
```
Next, define the `wandb.Table` object and what columns it consists of so that it can populate with the data visualizations.
```python
table = wandb.Table(
columns=[
"Split",
"Data Index",
"Slice Index",
"Image-Channel-0",
"Image-Channel-1",
"Image-Channel-2",
"Image-Channel-3",
]
)
```
Then, loop over the `train_dataset` and `val_dataset` respectively to generate the visualizations for the data samples and populate the rows of the table which to log to the dashboard.
```python
# Generate visualizations for train_dataset
max_samples = (
min(config.max_train_images_visualized, len(train_dataset))
if config.max_train_images_visualized > 0
else len(train_dataset)
)
progress_bar = tqdm(
enumerate(train_dataset[:max_samples]),
total=max_samples,
desc="Generating Train Dataset Visualizations:",
)
for data_idx, sample in progress_bar:
sample_image = sample["image"].detach().cpu().numpy()
sample_label = sample["label"].detach().cpu().numpy()
table = log_data_samples_into_tables(
sample_image,
sample_label,
split="train",
data_idx=data_idx,
table=table,
)
# Generate visualizations for val_dataset
max_samples = (
min(config.max_val_images_visualized, len(val_dataset))
if config.max_val_images_visualized > 0
else len(val_dataset)
)
progress_bar = tqdm(
enumerate(val_dataset[:max_samples]),
total=max_samples,
desc="Generating Validation Dataset Visualizations:",
)
for data_idx, sample in progress_bar:
sample_image = sample["image"].detach().cpu().numpy()
sample_label = sample["label"].detach().cpu().numpy()
table = log_data_samples_into_tables(
sample_image,
sample_label,
split="val",
data_idx=data_idx,
table=table,
)
# Log the table to your dashboard
wandb.log({"Tumor-Segmentation-Data": table})
```
The data appears on the W&B dashboard in an interactive tabular format. We can see each channel of a particular slice from a data volume overlaid with the respective segmentation mask in each row. You can write [Weave queries]({{< relref "/guides/weave" >}}) to filter the data on the table and focus on one particular row.
| {{< img src="/images/tutorials/monai/viz-1.gif" alt="An example of logged table data." >}} |
|:--:|
| **An example of logged table data.** |
Open an image and see how you can interact with each of the segmentation masks using the interactive overlay.
| {{< img src="/images/tutorials/monai/viz-2.gif" alt="An example of visualized segmentation maps." >}} |
|:--:|
| **An example of visualized segmentation maps.* |
{{% alert %}}
**Note:** The labels in the dataset consist of non-overlapping masks across classes. The overlay logs the labels as separate masks in the overlay.
{{% /alert %}}
### Loading the Data
Create the PyTorch DataLoaders for loading the data from the datasets. Before creating the DataLoaders, set the `transform` for `train_dataset` to `train_transform` to pre-process and transform the data for training.
```python
# apply train_transforms to the training dataset
train_dataset.transform = train_transform
# create the train_loader
train_loader = DataLoader(
train_dataset,
batch_size=config.batch_size,
shuffle=True,
num_workers=config.num_workers,
)
# create the val_loader
val_loader = DataLoader(
val_dataset,
batch_size=config.batch_size,
shuffle=False,
num_workers=config.num_workers,
)
```
## Creating the Model, Loss, and Optimizer
This tutorial crates a `SegResNet` model based on the paper [3D MRI brain tumor segmentation using auto-encoder regularization](https://arxiv.org/pdf/1810.11654.pdf). The `SegResNet` model that comes implemented as a PyTorch Module as part of the `monai.networks` API as well as an optimizer and learning rate scheduler.
```python
device = torch.device("cuda:0")
# create model
model = SegResNet(
blocks_down=[1, 2, 2, 4],
blocks_up=[1, 1, 1],
init_filters=16,
in_channels=4,
out_channels=3,
dropout_prob=0.2,
).to(device)
# create optimizer
optimizer = torch.optim.Adam(
model.parameters(),
config.initial_learning_rate,
weight_decay=config.weight_decay,
)
# create learning rate scheduler
lr_scheduler = torch.optim.lr_scheduler.CosineAnnealingLR(
optimizer, T_max=config.max_train_epochs
)
```
Define the loss as multi-label `DiceLoss` using the `monai.losses` API and the corresponding dice metrics using the `monai.metrics` API.
```python
loss_function = DiceLoss(
smooth_nr=config.dice_loss_smoothen_numerator,
smooth_dr=config.dice_loss_smoothen_denominator,
squared_pred=config.dice_loss_squared_prediction,
to_onehot_y=config.dice_loss_target_onehot,
sigmoid=config.dice_loss_apply_sigmoid,
)
dice_metric = DiceMetric(include_background=True, reduction="mean")
dice_metric_batch = DiceMetric(include_background=True, reduction="mean_batch")
post_trans = Compose([Activations(sigmoid=True), AsDiscrete(threshold=0.5)])
# use automatic mixed-precision to accelerate training
scaler = torch.cuda.amp.GradScaler()
torch.backends.cudnn.benchmark = True
```
Define a small utility for mixed-precision inference. This will be useful during the validation step of the training process and when you want to run the model after training.
```python
def inference(model, input):
def _compute(input):
return sliding_window_inference(
inputs=input,
roi_size=(240, 240, 160),
sw_batch_size=1,
predictor=model,
overlap=0.5,
)
with torch.cuda.amp.autocast():
return _compute(input)
```
## Training and Validation
Before training, define the metric properties which will later be logged with `wandb.log()` for tracking the training and validation experiments.
```python
wandb.define_metric("epoch/epoch_step")
wandb.define_metric("epoch/*", step_metric="epoch/epoch_step")
wandb.define_metric("batch/batch_step")
wandb.define_metric("batch/*", step_metric="batch/batch_step")
wandb.define_metric("validation/validation_step")
wandb.define_metric("validation/*", step_metric="validation/validation_step")
batch_step = 0
validation_step = 0
metric_values = []
metric_values_tumor_core = []
metric_values_whole_tumor = []
metric_values_enhanced_tumor = []
```
### Execute Standard PyTorch Training Loop
```python
# Define a W&B Artifact object
artifact = wandb.Artifact(
name=f"{wandb.run.id}-checkpoint", type="model"
)
epoch_progress_bar = tqdm(range(config.max_train_epochs), desc="Training:")
for epoch in epoch_progress_bar:
model.train()
epoch_loss = 0
total_batch_steps = len(train_dataset) // train_loader.batch_size
batch_progress_bar = tqdm(train_loader, total=total_batch_steps, leave=False)
# Training Step
for batch_data in batch_progress_bar:
inputs, labels = (
batch_data["image"].to(device),
batch_data["label"].to(device),
)
optimizer.zero_grad()
with torch.cuda.amp.autocast():
outputs = model(inputs)
loss = loss_function(outputs, labels)
scaler.scale(loss).backward()
scaler.step(optimizer)
scaler.update()
epoch_loss += loss.item()
batch_progress_bar.set_description(f"train_loss: {loss.item():.4f}:")
## Log batch-wise training loss to W&B
wandb.log({"batch/batch_step": batch_step, "batch/train_loss": loss.item()})
batch_step += 1
lr_scheduler.step()
epoch_loss /= total_batch_steps
## Log batch-wise training loss and learning rate to W&B
wandb.log(
{
"epoch/epoch_step": epoch,
"epoch/mean_train_loss": epoch_loss,
"epoch/learning_rate": lr_scheduler.get_last_lr()[0],
}
)
epoch_progress_bar.set_description(f"Training: train_loss: {epoch_loss:.4f}:")
# Validation and model checkpointing step
if (epoch + 1) % config.validation_intervals == 0:
model.eval()
with torch.no_grad():
for val_data in val_loader:
val_inputs, val_labels = (
val_data["image"].to(device),
val_data["label"].to(device),
)
val_outputs = inference(model, val_inputs)
val_outputs = [post_trans(i) for i in decollate_batch(val_outputs)]
dice_metric(y_pred=val_outputs, y=val_labels)
dice_metric_batch(y_pred=val_outputs, y=val_labels)
metric_values.append(dice_metric.aggregate().item())
metric_batch = dice_metric_batch.aggregate()
metric_values_tumor_core.append(metric_batch[0].item())
metric_values_whole_tumor.append(metric_batch[1].item())
metric_values_enhanced_tumor.append(metric_batch[2].item())
dice_metric.reset()
dice_metric_batch.reset()
checkpoint_path = os.path.join(config.checkpoint_dir, "model.pth")
torch.save(model.state_dict(), checkpoint_path)
# Log and versison model checkpoints using W&B artifacts.
artifact.add_file(local_path=checkpoint_path)
wandb.log_artifact(artifact, aliases=[f"epoch_{epoch}"])
# Log validation metrics to W&B dashboard.
wandb.log(
{
"validation/validation_step": validation_step,
"validation/mean_dice": metric_values[-1],
"validation/mean_dice_tumor_core": metric_values_tumor_core[-1],
"validation/mean_dice_whole_tumor": metric_values_whole_tumor[-1],
"validation/mean_dice_enhanced_tumor": metric_values_enhanced_tumor[-1],
}
)
validation_step += 1
# Wait for this artifact to finish logging
artifact.wait()
```
Instrumenting the code with `wandb.log` not only enables tracking all metrics associated with the training and validation process, but also logs all system metrics (our CPU and GPU in this case) on the W&B dashboard.
| {{< img src="/images/tutorials/monai/viz-3.gif" alt="An example of training and validation process tracking on W&B." >}} |
|:--:|
| **An example of training and validation process tracking on W&B.** |
Navigate to the artifacts tab in the W&B run dashboard to access the different versions of model checkpoint artifacts logged during training.
| {{< img src="/images/tutorials/monai/viz-4.gif" alt="An example of model checkpoints logging and versioning on W&B." >}} |
|:--:|
| **An example of model checkpoints logging and versioning on W&B.** |
## Inference
Using the artifacts interface, you can select which version of the artifact is the best model checkpoint, in this case, the mean epoch-wise training loss. You can also explore the entire lineage of the artifact and use the version that you need.
| {{< img src="/images/tutorials/monai/viz-5.gif" alt="An example of model artifact tracking on W&B." >}} |
|:--:|
| **An example of model artifact tracking on W&B.** |
Fetch the version of the model artifact with the best epoch-wise mean training loss and load the checkpoint state dictionary to the model.
```python
model_artifact = wandb.use_artifact(
"geekyrakshit/monai-brain-tumor-segmentation/d5ex6n4a-checkpoint:v49",
type="model",
)
model_artifact_dir = model_artifact.download()
model.load_state_dict(torch.load(os.path.join(model_artifact_dir, "model.pth")))
model.eval()
```
### Visualizing Predictions and Comparing with the Ground Truth Labels
Create another utility function to visualize the predictions of the pre-trained model and compare them with the corresponding ground-truth segmentation mask using the interactive segmentation mask overlay,.
```python
def log_predictions_into_tables(
sample_image: np.array,
sample_label: np.array,
predicted_label: np.array,
split: str = None,
data_idx: int = None,
table: wandb.Table = None,
):
num_channels, _, _, num_slices = sample_image.shape
with tqdm(total=num_slices, leave=False) as progress_bar:
for slice_idx in range(num_slices):
wandb_images = []
for channel_idx in range(num_channels):
wandb_images += [
wandb.Image(
sample_image[channel_idx, :, :, slice_idx],
masks={
"ground-truth/Tumor-Core": {
"mask_data": sample_label[0, :, :, slice_idx],
"class_labels": {0: "background", 1: "Tumor Core"},
},
"prediction/Tumor-Core": {
"mask_data": predicted_label[0, :, :, slice_idx] * 2,
"class_labels": {0: "background", 2: "Tumor Core"},
},
},
),
wandb.Image(
sample_image[channel_idx, :, :, slice_idx],
masks={
"ground-truth/Whole-Tumor": {
"mask_data": sample_label[1, :, :, slice_idx],
"class_labels": {0: "background", 1: "Whole Tumor"},
},
"prediction/Whole-Tumor": {
"mask_data": predicted_label[1, :, :, slice_idx] * 2,
"class_labels": {0: "background", 2: "Whole Tumor"},
},
},
),
wandb.Image(
sample_image[channel_idx, :, :, slice_idx],
masks={
"ground-truth/Enhancing-Tumor": {
"mask_data": sample_label[2, :, :, slice_idx],
"class_labels": {0: "background", 1: "Enhancing Tumor"},
},
"prediction/Enhancing-Tumor": {
"mask_data": predicted_label[2, :, :, slice_idx] * 2,
"class_labels": {0: "background", 2: "Enhancing Tumor"},
},
},
),
]
table.add_data(split, data_idx, slice_idx, *wandb_images)
progress_bar.update(1)
return table
```
Log the prediction results to the prediction table.
```python
# create the prediction table
prediction_table = wandb.Table(
columns=[
"Split",
"Data Index",
"Slice Index",
"Image-Channel-0/Tumor-Core",
"Image-Channel-1/Tumor-Core",
"Image-Channel-2/Tumor-Core",
"Image-Channel-3/Tumor-Core",
"Image-Channel-0/Whole-Tumor",
"Image-Channel-1/Whole-Tumor",
"Image-Channel-2/Whole-Tumor",
"Image-Channel-3/Whole-Tumor",
"Image-Channel-0/Enhancing-Tumor",
"Image-Channel-1/Enhancing-Tumor",
"Image-Channel-2/Enhancing-Tumor",
"Image-Channel-3/Enhancing-Tumor",
]
)
# Perform inference and visualization
with torch.no_grad():
config.max_prediction_images_visualized
max_samples = (
min(config.max_prediction_images_visualized, len(val_dataset))
if config.max_prediction_images_visualized > 0
else len(val_dataset)
)
progress_bar = tqdm(
enumerate(val_dataset[:max_samples]),
total=max_samples,
desc="Generating Predictions:",
)
for data_idx, sample in progress_bar:
val_input = sample["image"].unsqueeze(0).to(device)
val_output = inference(model, val_input)
val_output = post_trans(val_output[0])
prediction_table = log_predictions_into_tables(
sample_image=sample["image"].cpu().numpy(),
sample_label=sample["label"].cpu().numpy(),
predicted_label=val_output.cpu().numpy(),
data_idx=data_idx,
split="validation",
table=prediction_table,
)
wandb.log({"Predictions/Tumor-Segmentation-Data": prediction_table})
# End the experiment
wandb.finish()
```
Use the interactive segmentation mask overlay to analyze and compare the predicted segmentation masks and the ground-truth labels for each class.
| {{< img src="/images/tutorials/monai/viz-6.gif" alt="An example of predictions and ground-truth visualization on W&B." >}} |
|:--:|
| **An example of predictions and ground-truth visualization on W&B.** |
## Acknowledgements and more resources
* [MONAI Tutorial: Brain tumor 3D segmentation with MONAI](https://github.com/Project-MONAI/tutorials/blob/main/3d_segmentation/brats_segmentation_3d.ipynb)
* [WandB Report: Brain Tumor Segmentation using MONAI and WandB](https://wandb.ai/geekyrakshit/brain-tumor-segmentation/reports/Brain-Tumor-Segmentation-using-MONAI-and-WandB---Vmlldzo0MjUzODIw)
# Keras
{{< cta-button colabLink="https://colab.research.google.com/github/wandb/examples/blob/master/colabs/keras/Use_WandbMetricLogger_in_your_Keras_workflow.ipynb" >}}
Use Weights & Biases for machine learning experiment tracking, dataset versioning, and project collaboration.
{{< img src="/images/tutorials/huggingface-why.png" alt="" >}}
This Colab notebook introduces the `WandbMetricsLogger` callback. Use this callback for [Experiment Tracking]({{< relref "/guides/models/track" >}}). It will log your training and validation metrics along with system metrics to Weights and Biases.
## Setup and Installation
First, let us install the latest version of Weights and Biases. We will then authenticate this colab instance to use W&B.
```shell
pip install -qq -U wandb
```
```python
import os
import tensorflow as tf
from tensorflow.keras import layers
from tensorflow.keras import models
import tensorflow_datasets as tfds
# Weights and Biases related imports
import wandb
from wandb.integration.keras import WandbMetricsLogger
```
If this is your first time using W&B or you are not logged in, the link that appears after running `wandb.login()` will take you to sign-up/login page. Signing up for a [free account](https://wandb.ai/signup) is as easy as a few clicks.
```python
wandb.login()
```
## Hyperparameters
Use of proper config system is a recommended best practice for reproducible machine learning. We can track the hyperparameters for every experiment using W&B. In this colab we will be using simple Python `dict` as our config system.
```python
configs = dict(
num_classes=10,
shuffle_buffer=1024,
batch_size=64,
image_size=28,
image_channels=1,
earlystopping_patience=3,
learning_rate=1e-3,
epochs=10,
)
```
## Dataset
In this colab, we will be using [CIFAR100](https://www.tensorflow.org/datasets/catalog/cifar100) dataset from TensorFlow Dataset catalog. We aim to build a simple image classification pipeline using TensorFlow/Keras.
```python
train_ds, valid_ds = tfds.load("fashion_mnist", split=["train", "test"])
```
```python
AUTOTUNE = tf.data.AUTOTUNE
def parse_data(example):
# Get image
image = example["image"]
# image = tf.image.convert_image_dtype(image, dtype=tf.float32)
# Get label
label = example["label"]
label = tf.one_hot(label, depth=configs["num_classes"])
return image, label
def get_dataloader(ds, configs, dataloader_type="train"):
dataloader = ds.map(parse_data, num_parallel_calls=AUTOTUNE)
if dataloader_type == "train":
dataloader = dataloader.shuffle(configs["shuffle_buffer"])
dataloader = dataloader.batch(configs["batch_size"]).prefetch(AUTOTUNE)
return dataloader
```
```python
trainloader = get_dataloader(train_ds, configs)
validloader = get_dataloader(valid_ds, configs, dataloader_type="valid")
```
## Model
```python
def get_model(configs):
backbone = tf.keras.applications.mobilenet_v2.MobileNetV2(
weights="imagenet", include_top=False
)
backbone.trainable = False
inputs = layers.Input(
shape=(configs["image_size"], configs["image_size"], configs["image_channels"])
)
resize = layers.Resizing(32, 32)(inputs)
neck = layers.Conv2D(3, (3, 3), padding="same")(resize)
preprocess_input = tf.keras.applications.mobilenet.preprocess_input(neck)
x = backbone(preprocess_input)
x = layers.GlobalAveragePooling2D()(x)
outputs = layers.Dense(configs["num_classes"], activation="softmax")(x)
return models.Model(inputs=inputs, outputs=outputs)
```
```python
tf.keras.backend.clear_session()
model = get_model(configs)
model.summary()
```
## Compile Model
```python
model.compile(
optimizer="adam",
loss="categorical_crossentropy",
metrics=[
"accuracy",
tf.keras.metrics.TopKCategoricalAccuracy(k=5, name="top@5_accuracy"),
],
)
```
## Train
```python
# Initialize a W&B run
run = wandb.init(project="intro-keras", config=configs)
# Train your model
model.fit(
trainloader,
epochs=configs["epochs"],
validation_data=validloader,
callbacks=[
WandbMetricsLogger(log_freq=10)
], # Notice the use of WandbMetricsLogger here
)
# Close the W&B run
run.finish()
```
# Keras models
{{< cta-button colabLink="https://colab.research.google.com/github/wandb/examples/blob/master/colabs/keras/Use_WandbModelCheckpoint_in_your_Keras_workflow.ipynb" >}}
Use Weights & Biases for machine learning experiment tracking, dataset versioning, and project collaboration.
{{< img src="/images/tutorials/huggingface-why.png" alt="" >}}
This Colab notebook introduces the `WandbModelCheckpoint` callback. Use this callback to log your model checkpoints to Weight and Biases [Artifacts]({{< relref "/guides/core/artifacts/" >}}).
## Setup and Installation
First, let us install the latest version of Weights and Biases. We will then authenticate this colab instance to use W&B.
```python
!pip install -qq -U wandb
```
```python
import os
import tensorflow as tf
from tensorflow.keras import layers
from tensorflow.keras import models
import tensorflow_datasets as tfds
# Weights and Biases related imports
import wandb
from wandb.integration.keras import WandbMetricsLogger
from wandb.integration.keras import WandbModelCheckpoint
```
If this is your first time using W&B or you are not logged in, the link that appears after running `wandb.login()` will take you to sign-up/login page. Signing up for a [free account](https://wandb.ai/signup) is as easy as a few clicks.
```python
wandb.login()
```
## Hyperparameters
Use of proper config system is a recommended best practice for reproducible machine learning. We can track the hyperparameters for every experiment using W&B. In this colab we will be using simple Python `dict` as our config system.
```python
configs = dict(
num_classes = 10,
shuffle_buffer = 1024,
batch_size = 64,
image_size = 28,
image_channels = 1,
earlystopping_patience = 3,
learning_rate = 1e-3,
epochs = 10
)
```
## Dataset
In this colab, we will be using [CIFAR100](https://www.tensorflow.org/datasets/catalog/cifar100) dataset from TensorFlow Dataset catalog. We aim to build a simple image classification pipeline using TensorFlow/Keras.
```python
train_ds, valid_ds = tfds.load('fashion_mnist', split=['train', 'test'])
```
```python
AUTOTUNE = tf.data.AUTOTUNE
def parse_data(example):
# Get image
image = example["image"]
# image = tf.image.convert_image_dtype(image, dtype=tf.float32)
# Get label
label = example["label"]
label = tf.one_hot(label, depth=configs["num_classes"])
return image, label
def get_dataloader(ds, configs, dataloader_type="train"):
dataloader = ds.map(parse_data, num_parallel_calls=AUTOTUNE)
if dataloader_type=="train":
dataloader = dataloader.shuffle(configs["shuffle_buffer"])
dataloader = (
dataloader
.batch(configs["batch_size"])
.prefetch(AUTOTUNE)
)
return dataloader
```
```python
trainloader = get_dataloader(train_ds, configs)
validloader = get_dataloader(valid_ds, configs, dataloader_type="valid")
```
## Model
```python
def get_model(configs):
backbone = tf.keras.applications.mobilenet_v2.MobileNetV2(weights='imagenet', include_top=False)
backbone.trainable = False
inputs = layers.Input(shape=(configs["image_size"], configs["image_size"], configs["image_channels"]))
resize = layers.Resizing(32, 32)(inputs)
neck = layers.Conv2D(3, (3,3), padding="same")(resize)
preprocess_input = tf.keras.applications.mobilenet.preprocess_input(neck)
x = backbone(preprocess_input)
x = layers.GlobalAveragePooling2D()(x)
outputs = layers.Dense(configs["num_classes"], activation="softmax")(x)
return models.Model(inputs=inputs, outputs=outputs)
```
```python
tf.keras.backend.clear_session()
model = get_model(configs)
model.summary()
```
## Compile Model
```python
model.compile(
optimizer = "adam",
loss = "categorical_crossentropy",
metrics = ["accuracy", tf.keras.metrics.TopKCategoricalAccuracy(k=5, name='top@5_accuracy')]
)
```
## Train
```python
# Initialize a W&B run
run = wandb.init(
project = "intro-keras",
config = configs
)
# Train your model
model.fit(
trainloader,
epochs = configs["epochs"],
validation_data = validloader,
callbacks = [
WandbMetricsLogger(log_freq=10),
WandbModelCheckpoint(filepath="models/") # Notice the use of WandbModelCheckpoint here
]
)
# Close the W&B run
run.finish()
```
# Keras tables
{{< cta-button colabLink="https://colab.research.google.com/github/wandb/examples/blob/master/colabs/keras/Use_WandbEvalCallback_in_your_Keras_workflow.ipynb" >}}
Use Weights & Biases for machine learning experiment tracking, dataset versioning, and project collaboration.
{{< img src="/images/tutorials/huggingface-why.png" alt="" >}}
This Colab notebook introduces the `WandbEvalCallback` which is an abstract callback that be inherited to build useful callbacks for model prediction visualization and dataset visualization.
## Setup and Installation
First, let us install the latest version of Weights and Biases. We will then authenticate this colab instance to use W&B.
```shell
pip install -qq -U wandb
```
```python
import os
import numpy as np
import tensorflow as tf
from tensorflow.keras import layers
from tensorflow.keras import models
import tensorflow_datasets as tfds
# Weights and Biases related imports
import wandb
from wandb.integration.keras import WandbMetricsLogger
from wandb.integration.keras import WandbModelCheckpoint
from wandb.integration.keras import WandbEvalCallback
```
If this is your first time using W&B or you are not logged in, the link that appears after running `wandb.login()` will take you to sign-up/login page. Signing up for a [free account](https://wandb.ai/signup) is as easy as a few clicks.
```python
wandb.login()
```
## Hyperparameters
Use of proper config system is a recommended best practice for reproducible machine learning. We can track the hyperparameters for every experiment using W&B. In this colab we will be using simple Python `dict` as our config system.
```python
configs = dict(
num_classes=10,
shuffle_buffer=1024,
batch_size=64,
image_size=28,
image_channels=1,
earlystopping_patience=3,
learning_rate=1e-3,
epochs=10,
)
```
## Dataset
In this colab, we will be using [CIFAR100](https://www.tensorflow.org/datasets/catalog/cifar100) dataset from TensorFlow Dataset catalog. We aim to build a simple image classification pipeline using TensorFlow/Keras.
```python
train_ds, valid_ds = tfds.load("fashion_mnist", split=["train", "test"])
```
```
AUTOTUNE = tf.data.AUTOTUNE
def parse_data(example):
# Get image
image = example["image"]
# image = tf.image.convert_image_dtype(image, dtype=tf.float32)
# Get label
label = example["label"]
label = tf.one_hot(label, depth=configs["num_classes"])
return image, label
def get_dataloader(ds, configs, dataloader_type="train"):
dataloader = ds.map(parse_data, num_parallel_calls=AUTOTUNE)
if dataloader_type=="train":
dataloader = dataloader.shuffle(configs["shuffle_buffer"])
dataloader = (
dataloader
.batch(configs["batch_size"])
.prefetch(AUTOTUNE)
)
return dataloader
```
```python
trainloader = get_dataloader(train_ds, configs)
validloader = get_dataloader(valid_ds, configs, dataloader_type="valid")
```
## Model
```python
def get_model(configs):
backbone = tf.keras.applications.mobilenet_v2.MobileNetV2(
weights="imagenet", include_top=False
)
backbone.trainable = False
inputs = layers.Input(
shape=(configs["image_size"], configs["image_size"], configs["image_channels"])
)
resize = layers.Resizing(32, 32)(inputs)
neck = layers.Conv2D(3, (3, 3), padding="same")(resize)
preprocess_input = tf.keras.applications.mobilenet.preprocess_input(neck)
x = backbone(preprocess_input)
x = layers.GlobalAveragePooling2D()(x)
outputs = layers.Dense(configs["num_classes"], activation="softmax")(x)
return models.Model(inputs=inputs, outputs=outputs)
```
```python
tf.keras.backend.clear_session()
model = get_model(configs)
model.summary()
```
## Compile Model
```python
model.compile(
optimizer="adam",
loss="categorical_crossentropy",
metrics=[
"accuracy",
tf.keras.metrics.TopKCategoricalAccuracy(k=5, name="top@5_accuracy"),
],
)
```
## `WandbEvalCallback`
The `WandbEvalCallback` is an abstract base class to build Keras callbacks for primarily model prediction visualization and secondarily dataset visualization.
This is a dataset and task agnostic abstract callback. To use this, inherit from this base callback class and implement the `add_ground_truth` and `add_model_prediction` methods.
The `WandbEvalCallback` is a utility class that provides helpful methods to:
- create data and prediction `wandb.Table` instances,
- log data and prediction Tables as `wandb.Artifact`,
- logs the data table `on_train_begin`,
- logs the prediction table `on_epoch_end`.
As an example, we have implemented `WandbClfEvalCallback` below for an image classification task. This example callback:
- logs the validation data (`data_table`) to W&B,
- performs inference and logs the prediction (`pred_table`) to W&B on every epoch end.
## How the memory footprint is reduced
We log the `data_table` to W&B when the `on_train_begin` method is ivoked. Once it's uploaded as a W&B Artifact, we get a reference to this table which can be accessed using `data_table_ref` class variable. The `data_table_ref` is a 2D list that can be indexed like `self.data_table_ref[idx][n]` where `idx` is the row number while `n` is the column number. Let's see the usage in the example below.
```python
class WandbClfEvalCallback(WandbEvalCallback):
def __init__(
self, validloader, data_table_columns, pred_table_columns, num_samples=100
):
super().__init__(data_table_columns, pred_table_columns)
self.val_data = validloader.unbatch().take(num_samples)
def add_ground_truth(self, logs=None):
for idx, (image, label) in enumerate(self.val_data):
self.data_table.add_data(idx, wandb.Image(image), np.argmax(label, axis=-1))
def add_model_predictions(self, epoch, logs=None):
# Get predictions
preds = self._inference()
table_idxs = self.data_table_ref.get_index()
for idx in table_idxs:
pred = preds[idx]
self.pred_table.add_data(
epoch,
self.data_table_ref.data[idx][0],
self.data_table_ref.data[idx][1],
self.data_table_ref.data[idx][2],
pred,
)
def _inference(self):
preds = []
for image, label in self.val_data:
pred = self.model(tf.expand_dims(image, axis=0))
argmax_pred = tf.argmax(pred, axis=-1).numpy()[0]
preds.append(argmax_pred)
return preds
```
## Train
```python
# Initialize a W&B run
run = wandb.init(project="intro-keras", config=configs)
# Train your model
model.fit(
trainloader,
epochs=configs["epochs"],
validation_data=validloader,
callbacks=[
WandbMetricsLogger(log_freq=10),
WandbClfEvalCallback(
validloader,
data_table_columns=["idx", "image", "ground_truth"],
pred_table_columns=["epoch", "idx", "image", "ground_truth", "prediction"],
), # Notice the use of WandbEvalCallback here
],
)
# Close the W&B run
run.finish()
```
# XGBoost Sweeps
{{< cta-button colabLink="https://colab.research.google.com/github/wandb/examples/blob/master/colabs/boosting/Using_W&B_Sweeps_with_XGBoost.ipynb" >}}
Use Weights & Biases for machine learning experiment tracking, dataset versioning, and project collaboration.
{{< img src="/images/tutorials/huggingface-why.png" alt="" >}}
Squeezing the best performance out of tree-based models requires
[selecting the right hyperparameters](https://blog.cambridgespark.com/hyperparameter-tuning-in-xgboost-4ff9100a3b2f).
How many `early_stopping_rounds`? What should the `max_depth` of a tree be?
Searching through high dimensional hyperparameter spaces to find the most performant model can get unwieldy very fast.
Hyperparameter sweeps provide an organized and efficient way to conduct a battle royale of models and crown a winner.
They enable this by automatically searching through combinations of hyperparameter values to find the most optimal values.
In this tutorial we'll see how you can run sophisticated hyperparameter sweeps on XGBoost models in 3 easy steps using Weights and Biases.
For a teaser, check out the plots below:
{{< img src="/images/tutorials/xgboost_sweeps/sweeps_xgboost.png" alt="sweeps_xgboost" >}}
## Sweeps: An Overview
Running a hyperparameter sweep with Weights & Biases is very easy. There are just 3 simple steps:
1. **Define the sweep:** we do this by creating a dictionary-like object that specifies the sweep: which parameters to search through, which search strategy to use, which metric to optimize.
2. **Initialize the sweep:** with one line of code we initialize the sweep and pass in the dictionary of sweep configurations:
`sweep_id = wandb.sweep(sweep_config)`
3. **Run the sweep agent:** also accomplished with one line of code, we call w`andb.agent()` and pass the `sweep_id` along with a function that defines your model architecture and trains it:
`wandb.agent(sweep_id, function=train)`
That's all there is to running a hyperparameter sweep.
In the notebook below, we'll walk through these 3 steps in more detail.
We highly encourage you to fork this notebook, tweak the parameters, or try the model with your own dataset.
### Resources
- [Sweeps docs →]({{< relref "/guides/models/sweeps/" >}})
- [Launching from the command line →](https://www.wandb.com/articles/hyperparameter-tuning-as-easy-as-1-2-3)
```python
!pip install wandb -qU
```
```python
import wandb
wandb.login()
```
## 1. Define the Sweep
Weights & Biases sweeps give you powerful levers to configure your sweeps exactly how you want them, with just a few lines of code. The sweeps config can be defined as
[a dictionary or a YAML file]({{< relref "/guides/models/sweeps/define-sweep-configuration" >}}).
Let's walk through some of them together:
* **Metric**: This is the metric the sweeps are attempting to optimize. Metrics can take a `name` (this metric should be logged by your training script) and a `goal` (`maximize` or `minimize`).
* **Search Strategy**: Specified using the `"method"` key. We support several different search strategies with sweeps.
* **Grid Search**: Iterates over every combination of hyperparameter values.
* **Random Search**: Iterates over randomly chosen combinations of hyperparameter values.
* **Bayesian Search**: Creates a probabilistic model that maps hyperparameters to probability of a metric score, and chooses parameters with high probability of improving the metric. The objective of Bayesian optimization is to spend more time in picking the hyperparameter values, but in doing so trying out fewer hyperparameter values.
* **Parameters**: A dictionary containing the hyperparameter names, and discrete values, a range, or distributions from which to pull their values on each iteration.
For details, see the [list of all sweep configuration options]({{< relref "/guides/models/sweeps/define-sweep-configuration" >}}).
```python
sweep_config = {
"method": "random", # try grid or random
"metric": {
"name": "accuracy",
"goal": "maximize"
},
"parameters": {
"booster": {
"values": ["gbtree","gblinear"]
},
"max_depth": {
"values": [3, 6, 9, 12]
},
"learning_rate": {
"values": [0.1, 0.05, 0.2]
},
"subsample": {
"values": [1, 0.5, 0.3]
}
}
}
```
## 2. Initialize the Sweep
Calling `wandb.sweep` starts a Sweep Controller --
a centralized process that provides settings of the `parameters` to any who query it
and expects them to return performance on `metrics` via `wandb` logging.
```python
sweep_id = wandb.sweep(sweep_config, project="XGBoost-sweeps")
```
### Define your training process
Before we can run the sweep,
we need to define a function that creates and trains the model --
the function that takes in hyperparameter values and spits out metrics.
We'll also need `wandb` to be integrated into our script.
There's three main components:
* `wandb.init()`: Initialize a new W&B run. Each run is single execution of the training script.
* `wandb.config`: Save all your hyperparameters in a config object. This lets you use [our app](https://wandb.ai) to sort and compare your runs by hyperparameter values.
* `wandb.log()`: Logs metrics and custom objects, such as images, videos, audio files, HTML, plots, or point clouds.
We also need to download the data:
```python
!wget https://raw.githubusercontent.com/jbrownlee/Datasets/master/pima-indians-diabetes.data.csv
```
```python
# XGBoost model for Pima Indians dataset
from numpy import loadtxt
from xgboost import XGBClassifier
from sklearn.model_selection import train_test_split
from sklearn.metrics import accuracy_score
# load data
def train():
config_defaults = {
"booster": "gbtree",
"max_depth": 3,
"learning_rate": 0.1,
"subsample": 1,
"seed": 117,
"test_size": 0.33,
}
wandb.init(config=config_defaults) # defaults are over-ridden during the sweep
config = wandb.config
# load data and split into predictors and targets
dataset = loadtxt("pima-indians-diabetes.data.csv", delimiter=",")
X, Y = dataset[:, :8], dataset[:, 8]
# split data into train and test sets
X_train, X_test, y_train, y_test = train_test_split(X, Y,
test_size=config.test_size,
random_state=config.seed)
# fit model on train
model = XGBClassifier(booster=config.booster, max_depth=config.max_depth,
learning_rate=config.learning_rate, subsample=config.subsample)
model.fit(X_train, y_train)
# make predictions on test
y_pred = model.predict(X_test)
predictions = [round(value) for value in y_pred]
# evaluate predictions
accuracy = accuracy_score(y_test, predictions)
print(f"Accuracy: {accuracy:.0%}")
wandb.log({"accuracy": accuracy})
```
## 3. Run the Sweep with an agent
Now, we call `wandb.agent` to start up our sweep.
You can call `wandb.agent` on any machine where you're logged into W&B that has
- the `sweep_id`,
- the dataset and `train` function
and that machine will join the sweep.
> _Note_: a `random` sweep will by defauly run forever,
trying new parameter combinations until the cows come home --
or until you [turn the sweep off from the app UI]({{< relref "/guides/models/sweeps/sweeps-ui" >}}).
You can prevent this by providing the total `count` of runs you'd like the `agent` to complete.
```python
wandb.agent(sweep_id, train, count=25)
```
## Visualize your results
Now that your sweep is finished, it's time to look at the results.
Weights & Biases will generate a number of useful plots for you automatically.
### Parallel coordinates plot
This plot maps hyperparameter values to model metrics. It’s useful for honing in on combinations of hyperparameters that led to the best model performance.
This plot seems to indicate that using a tree as our learner slightly,
but not mind-blowingly,
outperforms using a simple linear model as our learner.
{{< img src="/images/tutorials/xgboost_sweeps/sweeps_xgboost2.png" alt="sweeps_xgboost" >}}
### Hyperparameter importance plot
The hyperparameter importance plot shows which hyperparameter values had the biggest impact
on your metrics.
We report both the correlation (treating it as a linear predictor)
and the feature importance (after training a random forest on your results)
so you can see which parameters had the biggest effect
and whether that effect was positive or negative.
Reading this chart, we see quantitative confirmation
of the trend we noticed in the parallel coordinates chart above:
the largest impact on validation accuracy came from the choice of
learner, and the `gblinear` learners were generally worse than `gbtree` learners.
{{< img src="/images/tutorials/xgboost_sweeps/sweeps_xgboost3.png" alt="sweeps_xgboost" >}}
These visualizations can help you save both time and resources running expensive hyperparameter optimizations by honing in on the parameters (and value ranges) that are the most important, and thereby worthy of further exploration.
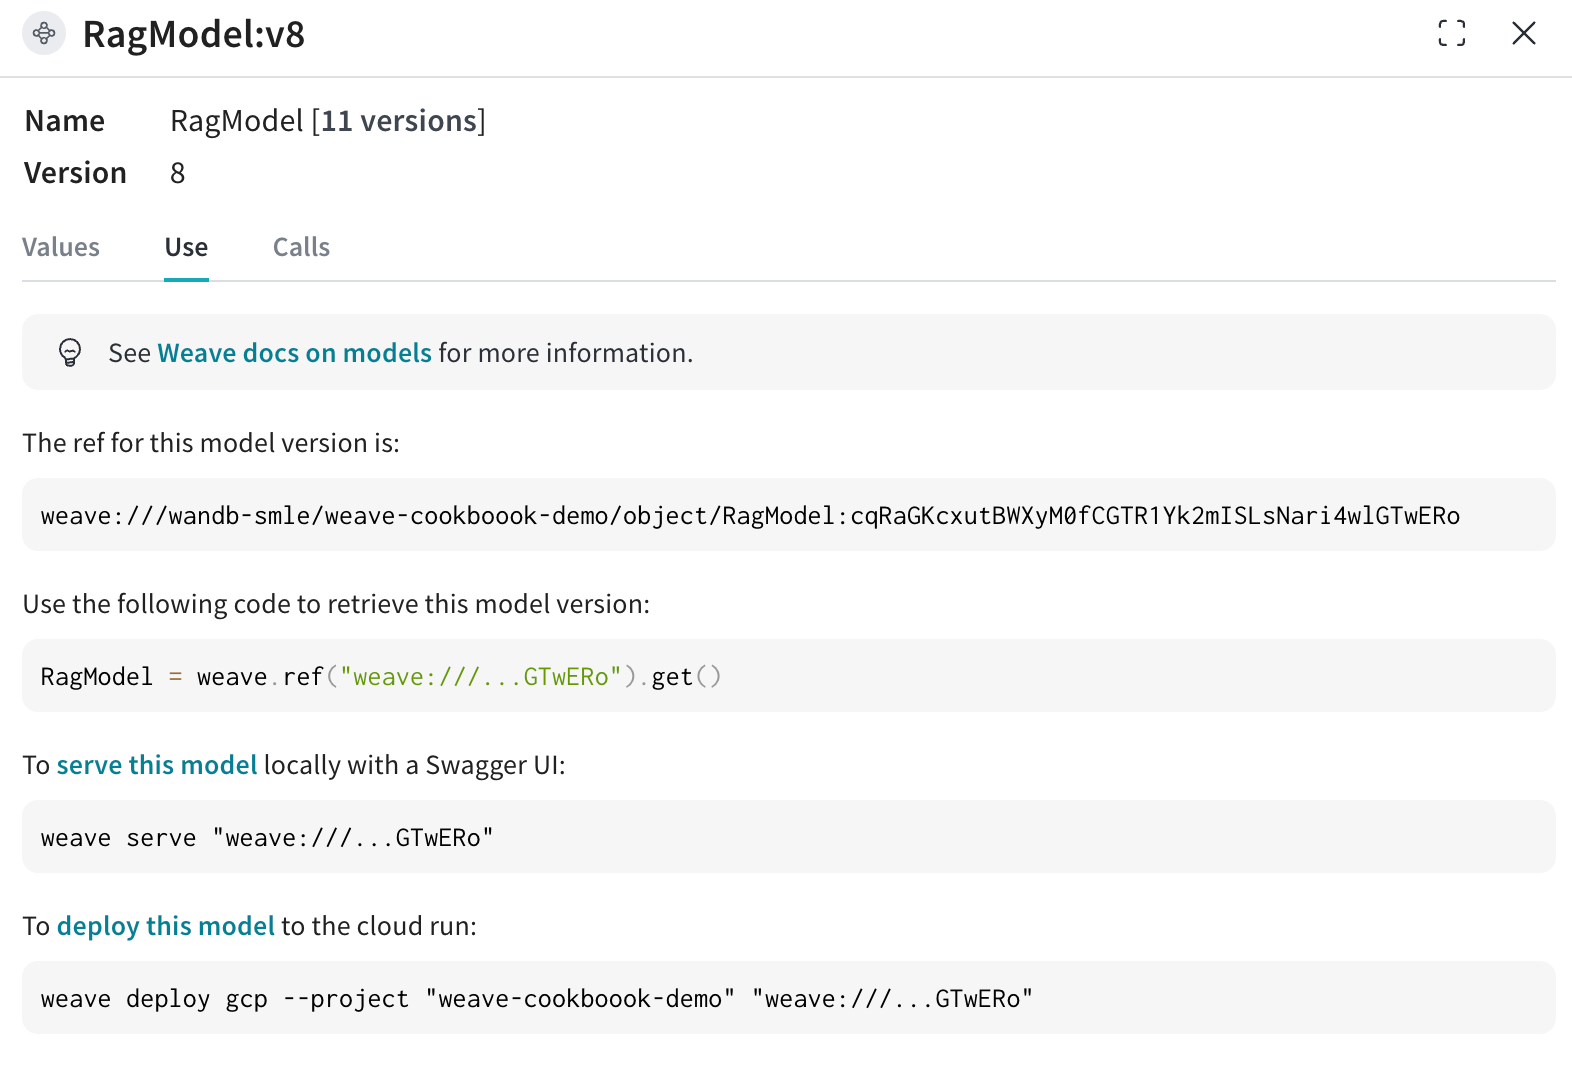 ```bash
pip install litellm faiss-gpu
```
```python
RagModel = weave.ref(
"weave:///wandb-smle/weave-cookboook-demo/object/RagModel:cqRaGKcxutBWXyM0fCGTR1Yk2mISLsNari4wlGTwERo"
).get()
# MAGIC: exchange chat_model and publish new version (no need to worry about other RAG components)
RagModel.chat_model = new_chat_model
# First publish the new version so that it is referenced during predictions
PUB_REFERENCE = weave.publish(RagModel, "RagModel")
await RagModel.predict("When was the first conference on climate change?")
```
## 4. Run new `weave.Evaluation` connecting to the existing models run
Finally, evaluate the new `RagModel` on the existing `weave.Evaluation`. To make the integration as easy as possible, include the following changes.
From a Models perspective:
- Getting the model from the registry creates a new `wandb.run` which is part of the E2E lineage of the chat model
- Add the Trace ID (with current eval ID) to the run config so that the model team can click the link to go to the corresponding Weave page
From a Weave perspective:
- Save the artifact / registry link as input to the `ChatModel` (that is `RagModel`)
- Save the run.id as extra column in the traces with `weave.attributes`
```python
# MAGIC: get an evaluation with a eval dataset and scorers and use them
WEAVE_EVAL = "weave:///wandb-smle/weave-cookboook-demo/object/climate_rag_eval:ntRX6qn3Tx6w3UEVZXdhIh1BWGh7uXcQpOQnIuvnSgo"
climate_rag_eval = weave.ref(WEAVE_EVAL).get()
with weave.attributes({"wandb-run-id": wandb.run.id}):
# use .call attribute to retrieve both the result and the call in order to save eval trace to Models
summary, call = await climate_rag_eval.evaluate.call(climate_rag_eval, ` RagModel `)
```
## 5. Save the new RAG model on the Registry
In order to effectively share the new RAG Model, push it to the Registry as a reference artifact adding in the weave version as an alias.
```python
MODELS_OBJECT_VERSION = PUB_REFERENCE.digest # weave object version
MODELS_OBJECT_NAME = PUB_REFERENCE.name # weave object name
models_url = f"https://wandb.ai/{ENTITY}/{PROJECT}/weave/objects/{MODELS_OBJECT_NAME}/versions/{MODELS_OBJECT_VERSION}"
models_link = (
f"weave:///{ENTITY}/{PROJECT}/object/{MODELS_OBJECT_NAME}:{MODELS_OBJECT_VERSION}"
)
with wandb.init(project=PROJECT, entity=ENTITY) as run:
# create new Artifact
artifact_model = wandb.Artifact(
name="RagModel",
type="model",
description="Models Link from RagModel in Weave",
metadata={"url": models_url},
)
artifact_model.add_reference(models_link, name="model", checksum=False)
# log new artifact
run.log_artifact(artifact_model, aliases=[MODELS_OBJECT_VERSION])
# link to registry
run.link_artifact(
artifact_model, target_path="wandb32/wandb-registry-RAG Models/RAG Model"
)
```
# Integration tutorials
# PyTorch
{{< cta-button colabLink="https://colab.research.google.com/github/wandb/examples/blob/master/colabs/pytorch/Simple_PyTorch_Integration.ipynb" >}}
Use [Weights & Biases](https://wandb.com) for machine learning experiment tracking, dataset versioning, and project collaboration.
{{< img src="/images/tutorials/huggingface-why.png" alt="" >}}
## What this notebook covers
We show you how to integrate Weights & Biases with your PyTorch code to add experiment tracking to your pipeline.
{{< img src="/images/tutorials/pytorch.png" alt="" >}}
```python
# import the library
import wandb
# start a new experiment
wandb.init(project="new-sota-model")
# capture a dictionary of hyperparameters with config
wandb.config = {"learning_rate": 0.001, "epochs": 100, "batch_size": 128}
# set up model and data
model, dataloader = get_model(), get_data()
# optional: track gradients
wandb.watch(model)
for batch in dataloader:
metrics = model.training_step()
# log metrics inside your training loop to visualize model performance
wandb.log(metrics)
# optional: save model at the end
model.to_onnx()
wandb.save("model.onnx")
```
Follow along with a [video tutorial](http://wandb.me/pytorch-video).
**Note**: Sections starting with _Step_ are all you need to integrate W&B in an existing pipeline. The rest just loads data and defines a model.
## Install, import, and log in
```python
import os
import random
import numpy as np
import torch
import torch.nn as nn
import torchvision
import torchvision.transforms as transforms
from tqdm.auto import tqdm
# Ensure deterministic behavior
torch.backends.cudnn.deterministic = True
random.seed(hash("setting random seeds") % 2**32 - 1)
np.random.seed(hash("improves reproducibility") % 2**32 - 1)
torch.manual_seed(hash("by removing stochasticity") % 2**32 - 1)
torch.cuda.manual_seed_all(hash("so runs are repeatable") % 2**32 - 1)
# Device configuration
device = torch.device("cuda:0" if torch.cuda.is_available() else "cpu")
# remove slow mirror from list of MNIST mirrors
torchvision.datasets.MNIST.mirrors = [mirror for mirror in torchvision.datasets.MNIST.mirrors
if not mirror.startswith("http://yann.lecun.com")]
```
### Step 0: Install W&B
To get started, we'll need to get the library.
`wandb` is easily installed using `pip`.
```python
!pip install wandb onnx -Uq
```
### Step 1: Import W&B and Login
In order to log data to our web service,
you'll need to log in.
If this is your first time using W&B,
you'll need to sign up for a free account at the link that appears.
```
import wandb
wandb.login()
```
## Define the Experiment and Pipeline
### Track metadata and hyperparameters with `wandb.init`
Programmatically, the first thing we do is define our experiment:
what are the hyperparameters? what metadata is associated with this run?
It's a pretty common workflow to store this information in a `config` dictionary
(or similar object)
and then access it as needed.
For this example, we're only letting a few hyperparameters vary
and hand-coding the rest.
But any part of your model can be part of the `config`.
We also include some metadata: we're using the MNIST dataset and a convolutional
architecture. If we later work with, say,
fully connected architectures on CIFAR in the same project,
this will help us separate our runs.
```python
config = dict(
epochs=5,
classes=10,
kernels=[16, 32],
batch_size=128,
learning_rate=0.005,
dataset="MNIST",
architecture="CNN")
```
Now, let's define the overall pipeline,
which is pretty typical for model-training:
1. we first `make` a model, plus associated data and optimizer, then
2. we `train` the model accordingly and finally
3. `test` it to see how training went.
We'll implement these functions below.
```python
def model_pipeline(hyperparameters):
# tell wandb to get started
with wandb.init(project="pytorch-demo", config=hyperparameters):
# access all HPs through wandb.config, so logging matches execution.
config = wandb.config
# make the model, data, and optimization problem
model, train_loader, test_loader, criterion, optimizer = make(config)
print(model)
# and use them to train the model
train(model, train_loader, criterion, optimizer, config)
# and test its final performance
test(model, test_loader)
return model
```
The only difference here from a standard pipeline
is that it all occurs inside the context of `wandb.init`.
Calling this function sets up a line of communication
between your code and our servers.
Passing the `config` dictionary to `wandb.init`
immediately logs all that information to us,
so you'll always know what hyperparameter values
you set your experiment to use.
To ensure the values you chose and logged are always the ones that get used
in your model, we recommend using the `wandb.config` copy of your object.
Check the definition of `make` below to see some examples.
> *Side Note*: We take care to run our code in separate processes,
so that any issues on our end
(such as if a giant sea monster attacks our data centers)
don't crash your code.
Once the issue is resolved, such as when the Kraken returns to the deep,
you can log the data with `wandb sync`.
```python
def make(config):
# Make the data
train, test = get_data(train=True), get_data(train=False)
train_loader = make_loader(train, batch_size=config.batch_size)
test_loader = make_loader(test, batch_size=config.batch_size)
# Make the model
model = ConvNet(config.kernels, config.classes).to(device)
# Make the loss and optimizer
criterion = nn.CrossEntropyLoss()
optimizer = torch.optim.Adam(
model.parameters(), lr=config.learning_rate)
return model, train_loader, test_loader, criterion, optimizer
```
### Define the Data Loading and Model
Now, we need to specify how the data is loaded and what the model looks like.
This part is very important, but it's
no different from what it would be without `wandb`,
so we won't dwell on it.
```python
def get_data(slice=5, train=True):
full_dataset = torchvision.datasets.MNIST(root=".",
train=train,
transform=transforms.ToTensor(),
download=True)
# equiv to slicing with [::slice]
sub_dataset = torch.utils.data.Subset(
full_dataset, indices=range(0, len(full_dataset), slice))
return sub_dataset
def make_loader(dataset, batch_size):
loader = torch.utils.data.DataLoader(dataset=dataset,
batch_size=batch_size,
shuffle=True,
pin_memory=True, num_workers=2)
return loader
```
Defining the model is normally the fun part.
But nothing changes with `wandb`,
so we're gonna stick with a standard ConvNet architecture.
Don't be afraid to mess around with this and try some experiments --
all your results will be logged on [wandb.ai](https://wandb.ai).
```python
# Conventional and convolutional neural network
class ConvNet(nn.Module):
def __init__(self, kernels, classes=10):
super(ConvNet, self).__init__()
self.layer1 = nn.Sequential(
nn.Conv2d(1, kernels[0], kernel_size=5, stride=1, padding=2),
nn.ReLU(),
nn.MaxPool2d(kernel_size=2, stride=2))
self.layer2 = nn.Sequential(
nn.Conv2d(16, kernels[1], kernel_size=5, stride=1, padding=2),
nn.ReLU(),
nn.MaxPool2d(kernel_size=2, stride=2))
self.fc = nn.Linear(7 * 7 * kernels[-1], classes)
def forward(self, x):
out = self.layer1(x)
out = self.layer2(out)
out = out.reshape(out.size(0), -1)
out = self.fc(out)
return out
```
### Define Training Logic
Moving on in our `model_pipeline`, it's time to specify how we `train`.
Two `wandb` functions come into play here: `watch` and `log`.
## Track gradients with `wandb.watch` and everything else with `wandb.log`
`wandb.watch` will log the gradients and the parameters of your model,
every `log_freq` steps of training.
All you need to do is call it before you start training.
The rest of the training code remains the same:
we iterate over epochs and batches,
running forward and backward passes
and applying our `optimizer`.
```python
def train(model, loader, criterion, optimizer, config):
# Tell wandb to watch what the model gets up to: gradients, weights, and more.
wandb.watch(model, criterion, log="all", log_freq=10)
# Run training and track with wandb
total_batches = len(loader) * config.epochs
example_ct = 0 # number of examples seen
batch_ct = 0
for epoch in tqdm(range(config.epochs)):
for _, (images, labels) in enumerate(loader):
loss = train_batch(images, labels, model, optimizer, criterion)
example_ct += len(images)
batch_ct += 1
# Report metrics every 25th batch
if ((batch_ct + 1) % 25) == 0:
train_log(loss, example_ct, epoch)
def train_batch(images, labels, model, optimizer, criterion):
images, labels = images.to(device), labels.to(device)
# Forward pass ➡
outputs = model(images)
loss = criterion(outputs, labels)
# Backward pass ⬅
optimizer.zero_grad()
loss.backward()
# Step with optimizer
optimizer.step()
return loss
```
The only difference is in the logging code:
where previously you might have reported metrics by printing to the terminal,
now you pass the same information to `wandb.log`.
`wandb.log` expects a dictionary with strings as keys.
These strings identify the objects being logged, which make up the values.
You can also optionally log which `step` of training you're on.
> *Side Note*: I like to use the number of examples the model has seen,
since this makes for easier comparison across batch sizes,
but you can use raw steps or batch count. For longer training runs, it can also make sense to log by `epoch`.
```python
def train_log(loss, example_ct, epoch):
# Where the magic happens
wandb.log({"epoch": epoch, "loss": loss}, step=example_ct)
print(f"Loss after {str(example_ct).zfill(5)} examples: {loss:.3f}")
```
### Define Testing Logic
Once the model is done training, we want to test it:
run it against some fresh data from production, perhaps,
or apply it to some hand-curated examples.
## (Optional) Call `wandb.save`
This is also a great time to save the model's architecture
and final parameters to disk.
For maximum compatibility, we'll `export` our model in the
[Open Neural Network eXchange (ONNX) format](https://onnx.ai/).
Passing that filename to `wandb.save` ensures that the model parameters
are saved to W&B's servers: no more losing track of which `.h5` or `.pb`
corresponds to which training runs.
For more advanced `wandb` features for storing, versioning, and distributing
models, check out our [Artifacts tools](https://www.wandb.com/artifacts).
```python
def test(model, test_loader):
model.eval()
# Run the model on some test examples
with torch.no_grad():
correct, total = 0, 0
for images, labels in test_loader:
images, labels = images.to(device), labels.to(device)
outputs = model(images)
_, predicted = torch.max(outputs.data, 1)
total += labels.size(0)
correct += (predicted == labels).sum().item()
print(f"Accuracy of the model on the {total} " +
f"test images: {correct / total:%}")
wandb.log({"test_accuracy": correct / total})
# Save the model in the exchangeable ONNX format
torch.onnx.export(model, images, "model.onnx")
wandb.save("model.onnx")
```
### Run training and watch your metrics live on wandb.ai
Now that we've defined the whole pipeline and slipped in
those few lines of W&B code,
we're ready to run our fully tracked experiment.
We'll report a few links to you:
our documentation,
the Project page, which organizes all the runs in a project, and
the Run page, where this run's results will be stored.
Navigate to the Run page and check out these tabs:
1. **Charts**, where the model gradients, parameter values, and loss are logged throughout training
2. **System**, which contains a variety of system metrics, including Disk I/O utilization, CPU and GPU metrics (watch that temperature soar), and more
3. **Logs**, which has a copy of anything pushed to standard out during training
4. **Files**, where, once training is complete, you can click on the `model.onnx` to view our network with the [Netron model viewer](https://github.com/lutzroeder/netron).
Once the run in finished, when the `with wandb.init` block exits,
we'll also print a summary of the results in the cell output.
```python
# Build, train and analyze the model with the pipeline
model = model_pipeline(config)
```
### Test Hyperparameters with Sweeps
We only looked at a single set of hyperparameters in this example.
But an important part of most ML workflows is iterating over
a number of hyperparameters.
You can use Weights & Biases Sweeps to automate hyperparameter testing and explore the space of possible models and optimization strategies.
## [Check out Hyperparameter Optimization in PyTorch using W&B Sweeps](http://wandb.me/sweeps-colab)
Running a hyperparameter sweep with Weights & Biases is very easy. There are just 3 simple steps:
1. **Define the sweep:** We do this by creating a dictionary or a [YAML file]({{< relref "/guides/models/sweeps/define-sweep-configuration" >}}) that specifies the parameters to search through, the search strategy, the optimization metric et all.
2. **Initialize the sweep:**
`sweep_id = wandb.sweep(sweep_config)`
3. **Run the sweep agent:**
`wandb.agent(sweep_id, function=train)`
That's all there is to running a hyperparameter sweep.
{{< img src="/images/tutorials/pytorch-2.png" alt="" >}}
## Example Gallery
See examples of projects tracked and visualized with W&B in our [Gallery →](https://app.wandb.ai/gallery)
## Advanced Setup
1. [Environment variables]({{< relref "/guides/hosting/env-vars/" >}}): Set API keys in environment variables so you can run training on a managed cluster.
2. [Offline mode]({{< relref "/support/kb-articles/run_wandb_offline.md" >}}): Use `dryrun` mode to train offline and sync results later.
3. [On-prem]({{< relref "/guides/hosting/hosting-options/self-managed" >}}): Install W&B in a private cloud or air-gapped servers in your own infrastructure. We have local installations for everyone from academics to enterprise teams.
4. [Sweeps]({{< relref "/guides/models/sweeps/" >}}): Set up hyperparameter search quickly with our lightweight tool for tuning.
# PyTorch Lightning
{{< cta-button colabLink="https://colab.research.google.com/github/wandb/examples/blob/master/colabs/pytorch-lightning/Image_Classification_using_PyTorch_Lightning.ipynb" >}}
We will build an image classification pipeline using PyTorch Lightning. We will follow this [style guide](https://lightning.ai/docs/pytorch/stable/starter/style_guide.html) to increase the readability and reproducibility of our code. A cool explanation of this available [here](https://wandb.ai/wandb/wandb-lightning/reports/Image-Classification-using-PyTorch-Lightning--VmlldzoyODk1NzY).
## Setting up PyTorch Lightning and W&B
For this tutorial, we need PyTorch Lightning and Weights and Biases.
```shell
pip install lightning -q
pip install wandb -qU
```
```python
import lightning.pytorch as pl
# your favorite machine learning tracking tool
from lightning.pytorch.loggers import WandbLogger
import torch
from torch import nn
from torch.nn import functional as F
from torch.utils.data import random_split, DataLoader
from torchmetrics import Accuracy
from torchvision import transforms
from torchvision.datasets import CIFAR10
import wandb
```
Now you'll need to log in to your wandb account.
```
wandb.login()
```
## DataModule - The Data Pipeline we Deserve
DataModules are a way of decoupling data-related hooks from the LightningModule so you can develop dataset agnostic models.
It organizes the data pipeline into one shareable and reusable class. A datamodule encapsulates the five steps involved in data processing in PyTorch:
- Download / tokenize / process.
- Clean and (maybe) save to disk.
- Load inside Dataset.
- Apply transforms (rotate, tokenize, etc…).
- Wrap inside a DataLoader.
Learn more about datamodules [here](https://lightning.ai/docs/pytorch/stable/data/datamodule.html). Let's build a datamodule for the Cifar-10 dataset.
```
class CIFAR10DataModule(pl.LightningDataModule):
def __init__(self, batch_size, data_dir: str = './'):
super().__init__()
self.data_dir = data_dir
self.batch_size = batch_size
self.transform = transforms.Compose([
transforms.ToTensor(),
transforms.Normalize((0.5, 0.5, 0.5), (0.5, 0.5, 0.5))
])
self.num_classes = 10
def prepare_data(self):
CIFAR10(self.data_dir, train=True, download=True)
CIFAR10(self.data_dir, train=False, download=True)
def setup(self, stage=None):
# Assign train/val datasets for use in dataloaders
if stage == 'fit' or stage is None:
cifar_full = CIFAR10(self.data_dir, train=True, transform=self.transform)
self.cifar_train, self.cifar_val = random_split(cifar_full, [45000, 5000])
# Assign test dataset for use in dataloader(s)
if stage == 'test' or stage is None:
self.cifar_test = CIFAR10(self.data_dir, train=False, transform=self.transform)
def train_dataloader(self):
return DataLoader(self.cifar_train, batch_size=self.batch_size, shuffle=True)
def val_dataloader(self):
return DataLoader(self.cifar_val, batch_size=self.batch_size)
def test_dataloader(self):
return DataLoader(self.cifar_test, batch_size=self.batch_size)
```
## Callbacks
A callback is a self-contained program that can be reused across projects. PyTorch Lightning comes with few [built-in callbacks](https://lightning.ai/docs/pytorch/latest/extensions/callbacks.html#built-in-callbacks) which are regularly used.
Learn more about callbacks in PyTorch Lightning [here](https://lightning.ai/docs/pytorch/latest/extensions/callbacks.html).
### Built-in Callbacks
In this tutorial, we will use [Early Stopping](https://lightning.ai/docs/pytorch/latest/api/lightning.pytorch.callbacks.EarlyStopping.html#lightning.callbacks.EarlyStopping) and [Model Checkpoint](https://lightning.ai/docs/pytorch/latest/api/lightning.pytorch.callbacks.ModelCheckpoint.html#pytorch_lightning.callbacks.ModelCheckpoint) built-in callbacks. They can be passed to the `Trainer`.
### Custom Callbacks
If you are familiar with Custom Keras callback, the ability to do the same in your PyTorch pipeline is just a cherry on the cake.
Since we are performing image classification, the ability to visualize the model's predictions on some samples of images can be helpful. This in the form of a callback can help debug the model at an early stage.
```
class ImagePredictionLogger(pl.callbacks.Callback):
def __init__(self, val_samples, num_samples=32):
super().__init__()
self.num_samples = num_samples
self.val_imgs, self.val_labels = val_samples
def on_validation_epoch_end(self, trainer, pl_module):
# Bring the tensors to CPU
val_imgs = self.val_imgs.to(device=pl_module.device)
val_labels = self.val_labels.to(device=pl_module.device)
# Get model prediction
logits = pl_module(val_imgs)
preds = torch.argmax(logits, -1)
# Log the images as wandb Image
trainer.logger.experiment.log({
"examples":[wandb.Image(x, caption=f"Pred:{pred}, Label:{y}")
for x, pred, y in zip(val_imgs[:self.num_samples],
preds[:self.num_samples],
val_labels[:self.num_samples])]
})
```
## LightningModule - Define the System
The LightningModule defines a system and not a model. Here a system groups all the research code into a single class to make it self-contained. `LightningModule` organizes your PyTorch code into 5 sections:
- Computations (`__init__`).
- Train loop (`training_step`)
- Validation loop (`validation_step`)
- Test loop (`test_step`)
- Optimizers (`configure_optimizers`)
One can thus build a dataset agnostic model that can be easily shared. Let's build a system for Cifar-10 classification.
```
class LitModel(pl.LightningModule):
def __init__(self, input_shape, num_classes, learning_rate=2e-4):
super().__init__()
# log hyperparameters
self.save_hyperparameters()
self.learning_rate = learning_rate
self.conv1 = nn.Conv2d(3, 32, 3, 1)
self.conv2 = nn.Conv2d(32, 32, 3, 1)
self.conv3 = nn.Conv2d(32, 64, 3, 1)
self.conv4 = nn.Conv2d(64, 64, 3, 1)
self.pool1 = torch.nn.MaxPool2d(2)
self.pool2 = torch.nn.MaxPool2d(2)
n_sizes = self._get_conv_output(input_shape)
self.fc1 = nn.Linear(n_sizes, 512)
self.fc2 = nn.Linear(512, 128)
self.fc3 = nn.Linear(128, num_classes)
self.accuracy = Accuracy(task='multiclass', num_classes=num_classes)
# returns the size of the output tensor going into Linear layer from the conv block.
def _get_conv_output(self, shape):
batch_size = 1
input = torch.autograd.Variable(torch.rand(batch_size, *shape))
output_feat = self._forward_features(input)
n_size = output_feat.data.view(batch_size, -1).size(1)
return n_size
# returns the feature tensor from the conv block
def _forward_features(self, x):
x = F.relu(self.conv1(x))
x = self.pool1(F.relu(self.conv2(x)))
x = F.relu(self.conv3(x))
x = self.pool2(F.relu(self.conv4(x)))
return x
# will be used during inference
def forward(self, x):
x = self._forward_features(x)
x = x.view(x.size(0), -1)
x = F.relu(self.fc1(x))
x = F.relu(self.fc2(x))
x = F.log_softmax(self.fc3(x), dim=1)
return x
def training_step(self, batch, batch_idx):
x, y = batch
logits = self(x)
loss = F.nll_loss(logits, y)
# training metrics
preds = torch.argmax(logits, dim=1)
acc = self.accuracy(preds, y)
self.log('train_loss', loss, on_step=True, on_epoch=True, logger=True)
self.log('train_acc', acc, on_step=True, on_epoch=True, logger=True)
return loss
def validation_step(self, batch, batch_idx):
x, y = batch
logits = self(x)
loss = F.nll_loss(logits, y)
# validation metrics
preds = torch.argmax(logits, dim=1)
acc = self.accuracy(preds, y)
self.log('val_loss', loss, prog_bar=True)
self.log('val_acc', acc, prog_bar=True)
return loss
def test_step(self, batch, batch_idx):
x, y = batch
logits = self(x)
loss = F.nll_loss(logits, y)
# validation metrics
preds = torch.argmax(logits, dim=1)
acc = self.accuracy(preds, y)
self.log('test_loss', loss, prog_bar=True)
self.log('test_acc', acc, prog_bar=True)
return loss
def configure_optimizers(self):
optimizer = torch.optim.Adam(self.parameters(), lr=self.learning_rate)
return optimizer
```
## Train and Evaluate
Now that we have organized our data pipeline using `DataModule` and model architecture+training loop using `LightningModule`, the PyTorch Lightning `Trainer` automates everything else for us.
The Trainer automates:
- Epoch and batch iteration
- Calling of `optimizer.step()`, `backward`, `zero_grad()`
- Calling of `.eval()`, enabling/disabling grads
- Saving and loading weights
- Weights and Biases logging
- Multi-GPU training support
- TPU support
- 16-bit training support
```
dm = CIFAR10DataModule(batch_size=32)
# To access the x_dataloader we need to call prepare_data and setup.
dm.prepare_data()
dm.setup()
# Samples required by the custom ImagePredictionLogger callback to log image predictions.
val_samples = next(iter(dm.val_dataloader()))
val_imgs, val_labels = val_samples[0], val_samples[1]
val_imgs.shape, val_labels.shape
```
```
model = LitModel((3, 32, 32), dm.num_classes)
# Initialize wandb logger
wandb_logger = WandbLogger(project='wandb-lightning', job_type='train')
# Initialize Callbacks
early_stop_callback = pl.callbacks.EarlyStopping(monitor="val_loss")
checkpoint_callback = pl.callbacks.ModelCheckpoint()
# Initialize a trainer
trainer = pl.Trainer(max_epochs=2,
logger=wandb_logger,
callbacks=[early_stop_callback,
ImagePredictionLogger(val_samples),
checkpoint_callback],
)
# Train the model
trainer.fit(model, dm)
# Evaluate the model on the held-out test set ⚡⚡
trainer.test(dataloaders=dm.test_dataloader())
# Close wandb run
wandb.finish()
```
## Final Thoughts
I come from the TensorFlow/Keras ecosystem and find PyTorch a bit overwhelming even though it's an elegant framework. Just my personal experience though. While exploring PyTorch Lightning, I realized that almost all of the reasons that kept me away from PyTorch is taken care of. Here's a quick summary of my excitement:
- Then: Conventional PyTorch model definition used to be all over the place. With the model in some `model.py` script and the training loop in the `train.py `file. It was a lot of looking back and forth to understand the pipeline.
- Now: The `LightningModule` acts as a system where the model is defined along with the `training_step`, `validation_step`, etc. Now it's modular and shareable.
- Then: The best part about TensorFlow/Keras is the input data pipeline. Their dataset catalog is rich and growing. PyTorch's data pipeline used to be the biggest pain point. In normal PyTorch code, the data download/cleaning/preparation is usually scattered across many files.
- Now: The DataModule organizes the data pipeline into one shareable and reusable class. It's simply a collection of a `train_dataloader`, `val_dataloader`(s), `test_dataloader`(s) along with the matching transforms and data processing/downloads steps required.
- Then: With Keras, one can call `model.fit` to train the model and `model.predict` to run inference on. `model.evaluate` offered a good old simple evaluation on the test data. This is not the case with PyTorch. One will usually find separate `train.py` and `test.py` files.
- Now: With the `LightningModule` in place, the `Trainer` automates everything. One needs to just call `trainer.fit` and `trainer.test` to train and evaluate the model.
- Then: TensorFlow loves TPU, PyTorch...
- Now: With PyTorch Lightning, it's so easy to train the same model with multiple GPUs and even on TPU.
- Then: I am a big fan of Callbacks and prefer writing custom callbacks. Something as trivial as Early Stopping used to be a point of discussion with conventional PyTorch.
- Now: With PyTorch Lightning using Early Stopping and Model Checkpointing is a piece of cake. I can even write custom callbacks.
## 🎨 Conclusion and Resources
I hope you find this report helpful. I will encourage to play with the code and train an image classifier with a dataset of your choice.
Here are some resources to learn more about PyTorch Lightning:
- [Step-by-step walk-through](https://lightning.ai/docs/pytorch/latest/starter/introduction.html) - This is one of the official tutorials. Their documentation is really well written and I highly encourage it as a good learning resource.
- [Use Pytorch Lightning with Weights & Biases](https://wandb.me/lightning) - This is a quick colab that you can run through to learn more about how to use W&B with PyTorch Lightning.
# Hugging Face
{{< img src="/images/tutorials/huggingface.png" alt="" >}}
{{< cta-button colabLink="https://colab.research.google.com/github/wandb/examples/blob/master/colabs/huggingface/Huggingface_wandb.ipynb" >}}
Visualize your [Hugging Face](https://github.com/huggingface/transformers) model's performance quickly with a seamless [W&B](https://wandb.ai/site) integration.
Compare hyperparameters, output metrics, and system stats like GPU utilization across your models.
## Why should I use W&B?
{.skipvale}
{{< img src="/images/tutorials/huggingface-why.png" alt="" >}}
- **Unified dashboard**: Central repository for all your model metrics and predictions
- **Lightweight**: No code changes required to integrate with Hugging Face
- **Accessible**: Free for individuals and academic teams
- **Secure**: All projects are private by default
- **Trusted**: Used by machine learning teams at OpenAI, Toyota, Lyft and more
Think of W&B like GitHub for machine learning models— save machine learning experiments to your private, hosted dashboard. Experiment quickly with the confidence that all the versions of your models are saved for you, no matter where you're running your scripts.
W&B lightweight integrations works with any Python script, and all you need to do is sign up for a free W&B account to start tracking and visualizing your models.
In the Hugging Face Transformers repo, we've instrumented the Trainer to automatically log training and evaluation metrics to W&B at each logging step.
Here's an in depth look at how the integration works: [Hugging Face + W&B Report](https://app.wandb.ai/jxmorris12/huggingface-demo/reports/Train-a-model-with-Hugging-Face-and-Weights-%26-Biases--VmlldzoxMDE2MTU).
## Install, import, and log in
Install the Hugging Face and Weights & Biases libraries, and the GLUE dataset and training script for this tutorial.
- [Hugging Face Transformers](https://github.com/huggingface/transformers): Natural language models and datasets
- [Weights & Biases]({{< relref "/" >}}): Experiment tracking and visualization
- [GLUE dataset](https://gluebenchmark.com/): A language understanding benchmark dataset
- [GLUE script](https://raw.githubusercontent.com/huggingface/transformers/refs/heads/main/examples/pytorch/text-classification/run_glue.py): Model training script for sequence classification
```notebook
!pip install datasets wandb evaluate accelerate -qU
!wget https://raw.githubusercontent.com/huggingface/transformers/refs/heads/main/examples/pytorch/text-classification/run_glue.py
```
```notebook
# the run_glue.py script requires transformers dev
!pip install -q git+https://github.com/huggingface/transformers
```
Before continuing, [sign up for a free account](https://app.wandb.ai/login?signup=true).
## Put in your API key
Once you've signed up, run the next cell and click on the link to get your API key and authenticate this notebook.
```python
import wandb
wandb.login()
```
Optionally, we can set environment variables to customize W&B logging. See [documentation]({{< relref "/guides/integrations/huggingface/" >}}).
```python
# Optional: log both gradients and parameters
%env WANDB_WATCH=all
```
## Train the model
Next, call the downloaded training script [run_glue.py](https://huggingface.co/transformers/examples.html#glue) and see training automatically get tracked to the Weights & Biases dashboard. This script fine-tunes BERT on the Microsoft Research Paraphrase Corpus— pairs of sentences with human annotations indicating whether they are semantically equivalent.
```python
%env WANDB_PROJECT=huggingface-demo
%env TASK_NAME=MRPC
!python run_glue.py \
--model_name_or_path bert-base-uncased \
--task_name $TASK_NAME \
--do_train \
--do_eval \
--max_seq_length 256 \
--per_device_train_batch_size 32 \
--learning_rate 2e-4 \
--num_train_epochs 3 \
--output_dir /tmp/$TASK_NAME/ \
--overwrite_output_dir \
--logging_steps 50
```
## Visualize results in dashboard
Click the link printed out above, or go to [wandb.ai](https://app.wandb.ai) to see your results stream in live. The link to see your run in the browser will appear after all the dependencies are loaded. Look for the following output: "**wandb**: 🚀 View run at [URL to your unique run]"
**Visualize Model Performance**
It's easy to look across dozens of experiments, zoom in on interesting findings, and visualize highly dimensional data.
{{< img src="/images/tutorials/huggingface-visualize.gif" alt="" >}}
**Compare Architectures**
Here's an example comparing [BERT vs DistilBERT](https://app.wandb.ai/jack-morris/david-vs-goliath/reports/Does-model-size-matter%3F-Comparing-BERT-and-DistilBERT-using-Sweeps--VmlldzoxMDUxNzU). It's easy to see how different architectures effect the evaluation accuracy throughout training with automatic line plot visualizations.
{{< img src="/images/tutorials/huggingface-comparearchitectures.gif" alt="" >}}
## Track key information effortlessly by default
Weights & Biases saves a new run for each experiment. Here's the information that gets saved by default:
- **Hyperparameters**: Settings for your model are saved in Config
- **Model Metrics**: Time series data of metrics streaming in are saved in Log
- **Terminal Logs**: Command line outputs are saved and available in a tab
- **System Metrics**: GPU and CPU utilization, memory, temperature etc.
## Learn more
- [Documentation]({{< relref "/guides/integrations/huggingface" >}}): docs on the Weights & Biases and Hugging Face integration
- [Videos](http://wandb.me/youtube): tutorials, interviews with practitioners, and more on our YouTube channel
- Contact: Message us at contact@wandb.com with questions
# TensorFlow
{{< cta-button colabLink="https://colab.research.google.com/github/wandb/examples/blob/master/colabs/tensorflow/Simple_TensorFlow_Integration.ipynb" >}}
## What this notebook covers
* Easy integration of Weights and Biases with your TensorFlow pipeline for experiment tracking.
* Computing metrics with `keras.metrics`
* Using `wandb.log` to log those metrics in your custom training loop.
{{< img src="/images/tutorials/tensorflow/dashboard.png" alt="dashboard" >}}
**Note**: Sections starting with _Step_ are all you need to integrate W&B into existing code. The rest is just a standard MNIST example.
```python
import os
import matplotlib.pyplot as plt
import numpy as np
import pandas as pd
import tensorflow as tf
from tensorflow import keras
from tensorflow.keras.datasets import cifar10
```
## Install, Import, Login
### Install W&B
```jupyter
%%capture
!pip install wandb
```
### Import W&B and login
```python
import wandb
from wandb.integration.keras import WandbMetricsLogger
wandb.login()
```
> Side note: If this is your first time using W&B or you are not logged in, the link that appears after running `wandb.login()` will take you to sign-up/login page. Signing up is as easy as one click.
### Prepare Dataset
```python
# Prepare the training dataset
BATCH_SIZE = 64
(x_train, y_train), (x_test, y_test) = keras.datasets.mnist.load_data()
x_train = np.reshape(x_train, (-1, 784))
x_test = np.reshape(x_test, (-1, 784))
# build input pipeline using tf.data
train_dataset = tf.data.Dataset.from_tensor_slices((x_train, y_train))
train_dataset = train_dataset.shuffle(buffer_size=1024).batch(BATCH_SIZE)
val_dataset = tf.data.Dataset.from_tensor_slices((x_test, y_test))
val_dataset = val_dataset.batch(BATCH_SIZE)
```
## Define the Model and the Training Loop
```python
def make_model():
inputs = keras.Input(shape=(784,), name="digits")
x1 = keras.layers.Dense(64, activation="relu")(inputs)
x2 = keras.layers.Dense(64, activation="relu")(x1)
outputs = keras.layers.Dense(10, name="predictions")(x2)
return keras.Model(inputs=inputs, outputs=outputs)
```
```python
def train_step(x, y, model, optimizer, loss_fn, train_acc_metric):
with tf.GradientTape() as tape:
logits = model(x, training=True)
loss_value = loss_fn(y, logits)
grads = tape.gradient(loss_value, model.trainable_weights)
optimizer.apply_gradients(zip(grads, model.trainable_weights))
train_acc_metric.update_state(y, logits)
return loss_value
```
```python
def test_step(x, y, model, loss_fn, val_acc_metric):
val_logits = model(x, training=False)
loss_value = loss_fn(y, val_logits)
val_acc_metric.update_state(y, val_logits)
return loss_value
```
## Add `wandb.log` to your training loop
```python
def train(
train_dataset,
val_dataset,
model,
optimizer,
train_acc_metric,
val_acc_metric,
epochs=10,
log_step=200,
val_log_step=50,
):
for epoch in range(epochs):
print("\nStart of epoch %d" % (epoch,))
train_loss = []
val_loss = []
# Iterate over the batches of the dataset
for step, (x_batch_train, y_batch_train) in enumerate(train_dataset):
loss_value = train_step(
x_batch_train,
y_batch_train,
model,
optimizer,
loss_fn,
train_acc_metric,
)
train_loss.append(float(loss_value))
# Run a validation loop at the end of each epoch
for step, (x_batch_val, y_batch_val) in enumerate(val_dataset):
val_loss_value = test_step(
x_batch_val, y_batch_val, model, loss_fn, val_acc_metric
)
val_loss.append(float(val_loss_value))
# Display metrics at the end of each epoch
train_acc = train_acc_metric.result()
print("Training acc over epoch: %.4f" % (float(train_acc),))
val_acc = val_acc_metric.result()
print("Validation acc: %.4f" % (float(val_acc),))
# Reset metrics at the end of each epoch
train_acc_metric.reset_states()
val_acc_metric.reset_states()
# ⭐: log metrics using wandb.log
wandb.log(
{
"epochs": epoch,
"loss": np.mean(train_loss),
"acc": float(train_acc),
"val_loss": np.mean(val_loss),
"val_acc": float(val_acc),
}
)
```
## Run Training
### Call `wandb.init` to start a run
This lets us know you're launching an experiment,
so we can give it a unique ID and a dashboard.
[Check out the official documentation]({{< relref "/ref/python/init" >}})
```python
# initialize wandb with your project name and optionally with configuration.
# play around with the config values and see the result on your wandb dashboard.
config = {
"learning_rate": 0.001,
"epochs": 10,
"batch_size": 64,
"log_step": 200,
"val_log_step": 50,
"architecture": "CNN",
"dataset": "CIFAR-10",
}
run = wandb.init(project='my-tf-integration', config=config)
config = run.config
# Initialize model.
model = make_model()
# Instantiate an optimizer to train the model.
optimizer = keras.optimizers.SGD(learning_rate=config.learning_rate)
# Instantiate a loss function.
loss_fn = keras.losses.SparseCategoricalCrossentropy(from_logits=True)
# Prepare the metrics.
train_acc_metric = keras.metrics.SparseCategoricalAccuracy()
val_acc_metric = keras.metrics.SparseCategoricalAccuracy()
train(
train_dataset,
val_dataset,
model,
optimizer,
train_acc_metric,
val_acc_metric,
epochs=config.epochs,
log_step=config.log_step,
val_log_step=config.val_log_step,
)
run.finish() # In Jupyter/Colab, let us know you're finished!
```
### Visualize Results
Click on the [**run page**]({{< relref "/guides/models/track/runs/#view-logged-runs" >}}) link above to see your live results.
## Sweep 101
Use Weights & Biases Sweeps to automate hyperparameter optimization and explore the space of possible models.
## [Check out Hyperparameter Optimization in TensorFlow using W&B Sweeps](http://wandb.me/tf-sweeps-colab)
### Benefits of using W&B Sweeps
* **Quick setup**: With just a few lines of code you can run W&B sweeps.
* **Transparent**: We cite all the algorithms we're using, and [our code is open source](https://github.com/wandb/sweeps).
* **Powerful**: Our sweeps are completely customizable and configurable. You can launch a sweep across dozens of machines, and it's just as easy as starting a sweep on your laptop.
{{< img src="/images/tutorials/tensorflow/sweeps.png" alt="Sweep result" >}}
## Example Gallery
See examples of projects tracked and visualized with W&B in our gallery of examples, [Fully Connected →](https://wandb.me/fc)
## Best Practices
1. **Projects**: Log multiple runs to a project to compare them. `wandb.init(project="project-name")`
2. **Groups**: For multiple processes or cross validation folds, log each process as a runs and group them together. `wandb.init(group="experiment-1")`
3. **Tags**: Add tags to track your current baseline or production model.
4. **Notes**: Type notes in the table to track the changes between runs.
5. **Reports**: Take quick notes on progress to share with colleagues and make dashboards and snapshots of your ML projects.
### Advanced Setup
1. [Environment variables]({{< relref "/guides/hosting/env-vars/" >}}): Set API keys in environment variables so you can run training on a managed cluster.
2. [Offline mode]({{< relref "/support/kb-articles/run_wandb_offline.md" >}})
3. [On-prem]({{< relref "/guides/hosting/hosting-options/self-managed" >}}): Install W&B in a private cloud or air-gapped servers in your own infrastructure. We have local installations for everyone from academics to enterprise teams.
4. [Artifacts]({{< relref "/guides/core/artifacts/" >}}): Track and version models and datasets in a streamlined way that automatically picks up your pipeline steps as you train models.
# TensorFlow Sweeps
{{< cta-button colabLink="https://colab.research.google.com/github/wandb/examples/blob/master/colabs/tensorflow/Hyperparameter_Optimization_in_TensorFlow_using_W&B_Sweeps.ipynb" >}}
Use W&B for machine learning experiment tracking, dataset versioning, and project collaboration.
{{< img src="/images/tutorials/huggingface-why.png" alt="" >}}
Use W&B Sweeps to automate hyperparameter optimization and explore model possibilities with interactive dashboards:
{{< img src="/images/tutorials/tensorflow/sweeps.png" alt="" >}}
## Why use sweeps
* **Quick setup**: Run W&B sweeps with a few lines of code.
* **Transparent**: The project cites all algorithms used, and the [code is open source](https://github.com/wandb/wandb/blob/main/wandb/apis/public/sweeps.py).
* **Powerful**: Sweeps provide customization options and can run on multiple machines or a laptop with ease.
For more information, see the [Sweep documentation]({{< relref "/guides/models/sweeps/" >}}).
## What this notebook covers
* Steps to start with W&B Sweep and a custom training loop in TensorFlow.
* Finding best hyperparameters for image classification tasks.
**Note**: Sections starting with _Step_ show necessary code to perform a hyperparameter sweep. The rest sets up a simple example.
## Install, import, and log in
### Install W&B
```bash
pip install wandb
```
### Import W&B and log in
```python
import tqdm
import tensorflow as tf
from tensorflow import keras
from tensorflow.keras.datasets import cifar10
import os
import numpy as np
import pandas as pd
import matplotlib.pyplot as plt
```
```python
import wandb
from wandb.integration.keras import WandbMetricsLogger
wandb.login()
```
{{< alert >}}
If you are new to W&B or not logged in, the link after running `wandb.login()` directs to the sign-up/login page.
{{< /alert >}}
## Prepare dataset
```python
# Prepare the training dataset
(x_train, y_train), (x_test, y_test) = keras.datasets.mnist.load_data()
x_train = x_train / 255.0
x_test = x_test / 255.0
x_train = np.reshape(x_train, (-1, 784))
x_test = np.reshape(x_test, (-1, 784))
```
## Build a classifier MLP
```python
def Model():
inputs = keras.Input(shape=(784,), name="digits")
x1 = keras.layers.Dense(64, activation="relu")(inputs)
x2 = keras.layers.Dense(64, activation="relu")(x1)
outputs = keras.layers.Dense(10, name="predictions")(x2)
return keras.Model(inputs=inputs, outputs=outputs)
def train_step(x, y, model, optimizer, loss_fn, train_acc_metric):
with tf.GradientTape() as tape:
logits = model(x, training=True)
loss_value = loss_fn(y, logits)
grads = tape.gradient(loss_value, model.trainable_weights)
optimizer.apply_gradients(zip(grads, model.trainable_weights))
train_acc_metric.update_state(y, logits)
return loss_value
def test_step(x, y, model, loss_fn, val_acc_metric):
val_logits = model(x, training=False)
loss_value = loss_fn(y, val_logits)
val_acc_metric.update_state(y, val_logits)
return loss_value
```
## Write a training loop
```python
def train(
train_dataset,
val_dataset,
model,
optimizer,
loss_fn,
train_acc_metric,
val_acc_metric,
epochs=10,
log_step=200,
val_log_step=50,
):
for epoch in range(epochs):
print("\nStart of epoch %d" % (epoch,))
train_loss = []
val_loss = []
# Iterate over the batches of the dataset
for step, (x_batch_train, y_batch_train) in tqdm.tqdm(
enumerate(train_dataset), total=len(train_dataset)
):
loss_value = train_step(
x_batch_train,
y_batch_train,
model,
optimizer,
loss_fn,
train_acc_metric,
)
train_loss.append(float(loss_value))
# Run a validation loop at the end of each epoch
for step, (x_batch_val, y_batch_val) in enumerate(val_dataset):
val_loss_value = test_step(
x_batch_val, y_batch_val, model, loss_fn, val_acc_metric
)
val_loss.append(float(val_loss_value))
# Display metrics at the end of each epoch
train_acc = train_acc_metric.result()
print("Training acc over epoch: %.4f" % (float(train_acc),))
val_acc = val_acc_metric.result()
print("Validation acc: %.4f" % (float(val_acc),))
# Reset metrics at the end of each epoch
train_acc_metric.reset_states()
val_acc_metric.reset_states()
# 3️⃣ log metrics using wandb.log
wandb.log(
{
"epochs": epoch,
"loss": np.mean(train_loss),
"acc": float(train_acc),
"val_loss": np.mean(val_loss),
"val_acc": float(val_acc),
}
)
```
## Configure the sweep
Steps to configure the sweep:
* Define the hyperparameters to optimize
* Choose the optimization method: `random`, `grid`, or `bayes`
* Set a goal and metric for `bayes`, like minimizing `val_loss`
* Use `hyperband` for early termination of performing runs
See more in the [W&B Sweeps documentation]({{< relref "/guides/models/sweeps/define-sweep-configuration" >}}).
```python
sweep_config = {
"method": "random",
"metric": {"name": "val_loss", "goal": "minimize"},
"early_terminate": {"type": "hyperband", "min_iter": 5},
"parameters": {
"batch_size": {"values": [32, 64, 128, 256]},
"learning_rate": {"values": [0.01, 0.005, 0.001, 0.0005, 0.0001]},
},
}
```
## Wrap the training loop
Create a function, like `sweep_train`,
which uses `wandb.config` to set hyperparameters before calling `train`.
```python
def sweep_train(config_defaults=None):
# Set default values
config_defaults = {"batch_size": 64, "learning_rate": 0.01}
# Initialize wandb with a sample project name
wandb.init(config=config_defaults) # this gets over-written in the Sweep
# Specify the other hyperparameters to the configuration, if any
wandb.config.epochs = 2
wandb.config.log_step = 20
wandb.config.val_log_step = 50
wandb.config.architecture_name = "MLP"
wandb.config.dataset_name = "MNIST"
# build input pipeline using tf.data
train_dataset = tf.data.Dataset.from_tensor_slices((x_train, y_train))
train_dataset = (
train_dataset.shuffle(buffer_size=1024)
.batch(wandb.config.batch_size)
.prefetch(buffer_size=tf.data.AUTOTUNE)
)
val_dataset = tf.data.Dataset.from_tensor_slices((x_test, y_test))
val_dataset = val_dataset.batch(wandb.config.batch_size).prefetch(
buffer_size=tf.data.AUTOTUNE
)
# initialize model
model = Model()
# Instantiate an optimizer to train the model.
optimizer = keras.optimizers.SGD(learning_rate=wandb.config.learning_rate)
# Instantiate a loss function.
loss_fn = keras.losses.SparseCategoricalCrossentropy(from_logits=True)
# Prepare the metrics.
train_acc_metric = keras.metrics.SparseCategoricalAccuracy()
val_acc_metric = keras.metrics.SparseCategoricalAccuracy()
train(
train_dataset,
val_dataset,
model,
optimizer,
loss_fn,
train_acc_metric,
val_acc_metric,
epochs=wandb.config.epochs,
log_step=wandb.config.log_step,
val_log_step=wandb.config.val_log_step,
)
```
## Initialize sweep and run personal digital assistant
```python
sweep_id = wandb.sweep(sweep_config, project="sweeps-tensorflow")
```
Limit the number of runs with the `count` parameter. Set to 10 for quick execution. Increase as needed.
```python
wandb.agent(sweep_id, function=sweep_train, count=10)
```
## Visualize results
Click on the **Sweep URL** link preceding to view live results.
## Example gallery
Explore projects tracked and visualized with W&B in the [Gallery](https://app.wandb.ai/gallery).
## Best practices
1. **Projects**: Log multiple runs to a project to compare them. `wandb.init(project="project-name")`
2. **Groups**: Log each process as a run for multiple processes or cross-validation folds, and group them. `wandb.init(group='experiment-1')`
3. **Tags**: Use tags to track your baseline or production model.
4. **Notes**: Enter notes in the table to track changes between runs.
5. **Reports**: Use reports for progress notes, sharing with colleagues, and creating ML project dashboards and snapshots.
## Advanced setup
1. [Environment variables]({{< relref "/guides/hosting/env-vars/" >}}): Set API keys for training on a managed cluster.
2. [Offline mode]({{< relref "/support/kb-articles/run_wandb_offline.md" >}})
3. [On-prem]({{< relref "/guides/hosting/hosting-options/self-managed" >}}): Install W&B in a private cloud or air-gapped servers in your infrastructure. Local installations suit academics and enterprise teams.
# 3D brain tumor segmentation with MONAI
{{< cta-button colabLink="https://colab.research.google.com/github/wandb/examples/blob/master/colabs/monai/3d_brain_tumor_segmentation.ipynb" >}}
This tutorial demonstrates how to construct a training workflow of multi-labels 3D brain tumor segmentation task using [MONAI](https://github.com/Project-MONAI/MONAI) and use experiment tracking and data visualization features of [Weights & Biases](https://wandb.ai/site). The tutorial contains the following features:
1. Initialize a Weights & Biases run and synchronize all configs associated with the run for reproducibility.
2. MONAI transform API:
1. MONAI Transforms for dictionary format data.
2. How to define a new transform according to MONAI `transforms` API.
3. How to randomly adjust intensity for data augmentation.
3. Data Loading and Visualization:
1. Load `Nifti` image with metadata, load a list of images and stack them.
2. Cache IO and transforms to accelerate training and validation.
3. Visualize the data using `wandb.Table` and interactive segmentation overlay on Weights & Biases.
4. Training a 3D `SegResNet` model
1. Using the `networks`, `losses`, and `metrics` APIs from MONAI.
2. Training the 3D `SegResNet` model using a PyTorch training loop.
3. Track the training experiment using Weights & Biases.
4. Log and version model checkpoints as model artifacts on Weights & Biases.
5. Visualize and compare the predictions on the validation dataset using `wandb.Table` and interactive segmentation overlay on Weights & Biases.
## Setup and Installation
First, install the latest version of both MONAI and Weights and Biases.
```python
!python -c "import monai" || pip install -q -U "monai[nibabel, tqdm]"
!python -c "import wandb" || pip install -q -U wandb
```
```python
import os
import numpy as np
from tqdm.auto import tqdm
import wandb
from monai.apps import DecathlonDataset
from monai.data import DataLoader, decollate_batch
from monai.losses import DiceLoss
from monai.inferers import sliding_window_inference
from monai.metrics import DiceMetric
from monai.networks.nets import SegResNet
from monai.transforms import (
Activations,
AsDiscrete,
Compose,
LoadImaged,
MapTransform,
NormalizeIntensityd,
Orientationd,
RandFlipd,
RandScaleIntensityd,
RandShiftIntensityd,
RandSpatialCropd,
Spacingd,
EnsureTyped,
EnsureChannelFirstd,
)
from monai.utils import set_determinism
import torch
```
Then, authenticate the Colab instance to use W&B.
```python
wandb.login()
```
## Initialize a W&B Run
Start a new W&B run to start tracking the experiment.
```python
wandb.init(project="monai-brain-tumor-segmentation")
```
Use of proper config system is a recommended best practice for reproducible machine learning. You can track the hyperparameters for every experiment using W&B.
```python
config = wandb.config
config.seed = 0
config.roi_size = [224, 224, 144]
config.batch_size = 1
config.num_workers = 4
config.max_train_images_visualized = 20
config.max_val_images_visualized = 20
config.dice_loss_smoothen_numerator = 0
config.dice_loss_smoothen_denominator = 1e-5
config.dice_loss_squared_prediction = True
config.dice_loss_target_onehot = False
config.dice_loss_apply_sigmoid = True
config.initial_learning_rate = 1e-4
config.weight_decay = 1e-5
config.max_train_epochs = 50
config.validation_intervals = 1
config.dataset_dir = "./dataset/"
config.checkpoint_dir = "./checkpoints"
config.inference_roi_size = (128, 128, 64)
config.max_prediction_images_visualized = 20
```
You also need to set the random seed for modules to enable or turn off deterministic training.
```python
set_determinism(seed=config.seed)
# Create directories
os.makedirs(config.dataset_dir, exist_ok=True)
os.makedirs(config.checkpoint_dir, exist_ok=True)
```
## Data Loading and Transformation
Here, use the `monai.transforms` API to create a custom transform that converts the multi-classes labels into multi-labels segmentation task in one-hot format.
```python
class ConvertToMultiChannelBasedOnBratsClassesd(MapTransform):
"""
Convert labels to multi channels based on brats classes:
label 1 is the peritumoral edema
label 2 is the GD-enhancing tumor
label 3 is the necrotic and non-enhancing tumor core
The possible classes are TC (Tumor core), WT (Whole tumor)
and ET (Enhancing tumor).
Reference: https://github.com/Project-MONAI/tutorials/blob/main/3d_segmentation/brats_segmentation_3d.ipynb
"""
def __call__(self, data):
d = dict(data)
for key in self.keys:
result = []
# merge label 2 and label 3 to construct TC
result.append(torch.logical_or(d[key] == 2, d[key] == 3))
# merge labels 1, 2 and 3 to construct WT
result.append(
torch.logical_or(
torch.logical_or(d[key] == 2, d[key] == 3), d[key] == 1
)
)
# label 2 is ET
result.append(d[key] == 2)
d[key] = torch.stack(result, axis=0).float()
return d
```
Next, set up transforms for training and validation datasets respectively.
```python
train_transform = Compose(
[
# load 4 Nifti images and stack them together
LoadImaged(keys=["image", "label"]),
EnsureChannelFirstd(keys="image"),
EnsureTyped(keys=["image", "label"]),
ConvertToMultiChannelBasedOnBratsClassesd(keys="label"),
Orientationd(keys=["image", "label"], axcodes="RAS"),
Spacingd(
keys=["image", "label"],
pixdim=(1.0, 1.0, 1.0),
mode=("bilinear", "nearest"),
),
RandSpatialCropd(
keys=["image", "label"], roi_size=config.roi_size, random_size=False
),
RandFlipd(keys=["image", "label"], prob=0.5, spatial_axis=0),
RandFlipd(keys=["image", "label"], prob=0.5, spatial_axis=1),
RandFlipd(keys=["image", "label"], prob=0.5, spatial_axis=2),
NormalizeIntensityd(keys="image", nonzero=True, channel_wise=True),
RandScaleIntensityd(keys="image", factors=0.1, prob=1.0),
RandShiftIntensityd(keys="image", offsets=0.1, prob=1.0),
]
)
val_transform = Compose(
[
LoadImaged(keys=["image", "label"]),
EnsureChannelFirstd(keys="image"),
EnsureTyped(keys=["image", "label"]),
ConvertToMultiChannelBasedOnBratsClassesd(keys="label"),
Orientationd(keys=["image", "label"], axcodes="RAS"),
Spacingd(
keys=["image", "label"],
pixdim=(1.0, 1.0, 1.0),
mode=("bilinear", "nearest"),
),
NormalizeIntensityd(keys="image", nonzero=True, channel_wise=True),
]
)
```
### The Dataset
The dataset used for this experiment comes from http://medicaldecathlon.com/. It uses multi-modal multi-site MRI data (FLAIR, T1w, T1gd, T2w) to segment Gliomas, necrotic/active tumour, and oedema. The dataset consists of 750 4D volumes (484 Training + 266 Testing).
Use the `DecathlonDataset` to automatically download and extract the dataset. It inherits MONAI `CacheDataset` which enables you to set `cache_num=N` to cache `N` items for training and use the default arguments to cache all the items for validation, depending on your memory size.
```python
train_dataset = DecathlonDataset(
root_dir=config.dataset_dir,
task="Task01_BrainTumour",
transform=val_transform,
section="training",
download=True,
cache_rate=0.0,
num_workers=4,
)
val_dataset = DecathlonDataset(
root_dir=config.dataset_dir,
task="Task01_BrainTumour",
transform=val_transform,
section="validation",
download=False,
cache_rate=0.0,
num_workers=4,
)
```
{{% alert %}}
**Note:** Instead of applying the `train_transform` to the `train_dataset`, apply `val_transform` to both the training and validation datasets. This is because, before training, you would be visualizing samples from both the splits of the dataset.
{{% /alert %}}
### Visualizing the Dataset
Weights & Biases supports images, video, audio, and more. You can log rich media to explore your results and visually compare our runs, models, and datasets. Use the [segmentation mask overlay system]({{< relref "/guides/models/track/log/media/#image-overlays-in-tables" >}}) to visualize our data volumes. To log segmentation masks in [tables]({{< relref "/guides/models/tables/" >}}), you must provide a `wandb.Image` object for each row in the table.
An example is provided in the pseudocode below:
```python
table = wandb.Table(columns=["ID", "Image"])
for id, img, label in zip(ids, images, labels):
mask_img = wandb.Image(
img,
masks={
"prediction": {"mask_data": label, "class_labels": class_labels}
# ...
},
)
table.add_data(id, img)
wandb.log({"Table": table})
```
Now write a simple utility function that takes a sample image, label, `wandb.Table` object and some associated metadata and populate the rows of a table that would be logged to the Weights & Biases dashboard.
```python
def log_data_samples_into_tables(
sample_image: np.array,
sample_label: np.array,
split: str = None,
data_idx: int = None,
table: wandb.Table = None,
):
num_channels, _, _, num_slices = sample_image.shape
with tqdm(total=num_slices, leave=False) as progress_bar:
for slice_idx in range(num_slices):
ground_truth_wandb_images = []
for channel_idx in range(num_channels):
ground_truth_wandb_images.append(
masks = {
"ground-truth/Tumor-Core": {
"mask_data": sample_label[0, :, :, slice_idx],
"class_labels": {0: "background", 1: "Tumor Core"},
},
"ground-truth/Whole-Tumor": {
"mask_data": sample_label[1, :, :, slice_idx] * 2,
"class_labels": {0: "background", 2: "Whole Tumor"},
},
"ground-truth/Enhancing-Tumor": {
"mask_data": sample_label[2, :, :, slice_idx] * 3,
"class_labels": {0: "background", 3: "Enhancing Tumor"},
},
}
wandb.Image(
sample_image[channel_idx, :, :, slice_idx],
masks=masks,
)
)
table.add_data(split, data_idx, slice_idx, *ground_truth_wandb_images)
progress_bar.update(1)
return table
```
Next, define the `wandb.Table` object and what columns it consists of so that it can populate with the data visualizations.
```python
table = wandb.Table(
columns=[
"Split",
"Data Index",
"Slice Index",
"Image-Channel-0",
"Image-Channel-1",
"Image-Channel-2",
"Image-Channel-3",
]
)
```
Then, loop over the `train_dataset` and `val_dataset` respectively to generate the visualizations for the data samples and populate the rows of the table which to log to the dashboard.
```python
# Generate visualizations for train_dataset
max_samples = (
min(config.max_train_images_visualized, len(train_dataset))
if config.max_train_images_visualized > 0
else len(train_dataset)
)
progress_bar = tqdm(
enumerate(train_dataset[:max_samples]),
total=max_samples,
desc="Generating Train Dataset Visualizations:",
)
for data_idx, sample in progress_bar:
sample_image = sample["image"].detach().cpu().numpy()
sample_label = sample["label"].detach().cpu().numpy()
table = log_data_samples_into_tables(
sample_image,
sample_label,
split="train",
data_idx=data_idx,
table=table,
)
# Generate visualizations for val_dataset
max_samples = (
min(config.max_val_images_visualized, len(val_dataset))
if config.max_val_images_visualized > 0
else len(val_dataset)
)
progress_bar = tqdm(
enumerate(val_dataset[:max_samples]),
total=max_samples,
desc="Generating Validation Dataset Visualizations:",
)
for data_idx, sample in progress_bar:
sample_image = sample["image"].detach().cpu().numpy()
sample_label = sample["label"].detach().cpu().numpy()
table = log_data_samples_into_tables(
sample_image,
sample_label,
split="val",
data_idx=data_idx,
table=table,
)
# Log the table to your dashboard
wandb.log({"Tumor-Segmentation-Data": table})
```
The data appears on the W&B dashboard in an interactive tabular format. We can see each channel of a particular slice from a data volume overlaid with the respective segmentation mask in each row. You can write [Weave queries]({{< relref "/guides/weave" >}}) to filter the data on the table and focus on one particular row.
| {{< img src="/images/tutorials/monai/viz-1.gif" alt="An example of logged table data." >}} |
|:--:|
| **An example of logged table data.** |
Open an image and see how you can interact with each of the segmentation masks using the interactive overlay.
| {{< img src="/images/tutorials/monai/viz-2.gif" alt="An example of visualized segmentation maps." >}} |
|:--:|
| **An example of visualized segmentation maps.* |
{{% alert %}}
**Note:** The labels in the dataset consist of non-overlapping masks across classes. The overlay logs the labels as separate masks in the overlay.
{{% /alert %}}
### Loading the Data
Create the PyTorch DataLoaders for loading the data from the datasets. Before creating the DataLoaders, set the `transform` for `train_dataset` to `train_transform` to pre-process and transform the data for training.
```python
# apply train_transforms to the training dataset
train_dataset.transform = train_transform
# create the train_loader
train_loader = DataLoader(
train_dataset,
batch_size=config.batch_size,
shuffle=True,
num_workers=config.num_workers,
)
# create the val_loader
val_loader = DataLoader(
val_dataset,
batch_size=config.batch_size,
shuffle=False,
num_workers=config.num_workers,
)
```
## Creating the Model, Loss, and Optimizer
This tutorial crates a `SegResNet` model based on the paper [3D MRI brain tumor segmentation using auto-encoder regularization](https://arxiv.org/pdf/1810.11654.pdf). The `SegResNet` model that comes implemented as a PyTorch Module as part of the `monai.networks` API as well as an optimizer and learning rate scheduler.
```python
device = torch.device("cuda:0")
# create model
model = SegResNet(
blocks_down=[1, 2, 2, 4],
blocks_up=[1, 1, 1],
init_filters=16,
in_channels=4,
out_channels=3,
dropout_prob=0.2,
).to(device)
# create optimizer
optimizer = torch.optim.Adam(
model.parameters(),
config.initial_learning_rate,
weight_decay=config.weight_decay,
)
# create learning rate scheduler
lr_scheduler = torch.optim.lr_scheduler.CosineAnnealingLR(
optimizer, T_max=config.max_train_epochs
)
```
Define the loss as multi-label `DiceLoss` using the `monai.losses` API and the corresponding dice metrics using the `monai.metrics` API.
```python
loss_function = DiceLoss(
smooth_nr=config.dice_loss_smoothen_numerator,
smooth_dr=config.dice_loss_smoothen_denominator,
squared_pred=config.dice_loss_squared_prediction,
to_onehot_y=config.dice_loss_target_onehot,
sigmoid=config.dice_loss_apply_sigmoid,
)
dice_metric = DiceMetric(include_background=True, reduction="mean")
dice_metric_batch = DiceMetric(include_background=True, reduction="mean_batch")
post_trans = Compose([Activations(sigmoid=True), AsDiscrete(threshold=0.5)])
# use automatic mixed-precision to accelerate training
scaler = torch.cuda.amp.GradScaler()
torch.backends.cudnn.benchmark = True
```
Define a small utility for mixed-precision inference. This will be useful during the validation step of the training process and when you want to run the model after training.
```python
def inference(model, input):
def _compute(input):
return sliding_window_inference(
inputs=input,
roi_size=(240, 240, 160),
sw_batch_size=1,
predictor=model,
overlap=0.5,
)
with torch.cuda.amp.autocast():
return _compute(input)
```
## Training and Validation
Before training, define the metric properties which will later be logged with `wandb.log()` for tracking the training and validation experiments.
```python
wandb.define_metric("epoch/epoch_step")
wandb.define_metric("epoch/*", step_metric="epoch/epoch_step")
wandb.define_metric("batch/batch_step")
wandb.define_metric("batch/*", step_metric="batch/batch_step")
wandb.define_metric("validation/validation_step")
wandb.define_metric("validation/*", step_metric="validation/validation_step")
batch_step = 0
validation_step = 0
metric_values = []
metric_values_tumor_core = []
metric_values_whole_tumor = []
metric_values_enhanced_tumor = []
```
### Execute Standard PyTorch Training Loop
```python
# Define a W&B Artifact object
artifact = wandb.Artifact(
name=f"{wandb.run.id}-checkpoint", type="model"
)
epoch_progress_bar = tqdm(range(config.max_train_epochs), desc="Training:")
for epoch in epoch_progress_bar:
model.train()
epoch_loss = 0
total_batch_steps = len(train_dataset) // train_loader.batch_size
batch_progress_bar = tqdm(train_loader, total=total_batch_steps, leave=False)
# Training Step
for batch_data in batch_progress_bar:
inputs, labels = (
batch_data["image"].to(device),
batch_data["label"].to(device),
)
optimizer.zero_grad()
with torch.cuda.amp.autocast():
outputs = model(inputs)
loss = loss_function(outputs, labels)
scaler.scale(loss).backward()
scaler.step(optimizer)
scaler.update()
epoch_loss += loss.item()
batch_progress_bar.set_description(f"train_loss: {loss.item():.4f}:")
## Log batch-wise training loss to W&B
wandb.log({"batch/batch_step": batch_step, "batch/train_loss": loss.item()})
batch_step += 1
lr_scheduler.step()
epoch_loss /= total_batch_steps
## Log batch-wise training loss and learning rate to W&B
wandb.log(
{
"epoch/epoch_step": epoch,
"epoch/mean_train_loss": epoch_loss,
"epoch/learning_rate": lr_scheduler.get_last_lr()[0],
}
)
epoch_progress_bar.set_description(f"Training: train_loss: {epoch_loss:.4f}:")
# Validation and model checkpointing step
if (epoch + 1) % config.validation_intervals == 0:
model.eval()
with torch.no_grad():
for val_data in val_loader:
val_inputs, val_labels = (
val_data["image"].to(device),
val_data["label"].to(device),
)
val_outputs = inference(model, val_inputs)
val_outputs = [post_trans(i) for i in decollate_batch(val_outputs)]
dice_metric(y_pred=val_outputs, y=val_labels)
dice_metric_batch(y_pred=val_outputs, y=val_labels)
metric_values.append(dice_metric.aggregate().item())
metric_batch = dice_metric_batch.aggregate()
metric_values_tumor_core.append(metric_batch[0].item())
metric_values_whole_tumor.append(metric_batch[1].item())
metric_values_enhanced_tumor.append(metric_batch[2].item())
dice_metric.reset()
dice_metric_batch.reset()
checkpoint_path = os.path.join(config.checkpoint_dir, "model.pth")
torch.save(model.state_dict(), checkpoint_path)
# Log and versison model checkpoints using W&B artifacts.
artifact.add_file(local_path=checkpoint_path)
wandb.log_artifact(artifact, aliases=[f"epoch_{epoch}"])
# Log validation metrics to W&B dashboard.
wandb.log(
{
"validation/validation_step": validation_step,
"validation/mean_dice": metric_values[-1],
"validation/mean_dice_tumor_core": metric_values_tumor_core[-1],
"validation/mean_dice_whole_tumor": metric_values_whole_tumor[-1],
"validation/mean_dice_enhanced_tumor": metric_values_enhanced_tumor[-1],
}
)
validation_step += 1
# Wait for this artifact to finish logging
artifact.wait()
```
Instrumenting the code with `wandb.log` not only enables tracking all metrics associated with the training and validation process, but also logs all system metrics (our CPU and GPU in this case) on the W&B dashboard.
| {{< img src="/images/tutorials/monai/viz-3.gif" alt="An example of training and validation process tracking on W&B." >}} |
|:--:|
| **An example of training and validation process tracking on W&B.** |
Navigate to the artifacts tab in the W&B run dashboard to access the different versions of model checkpoint artifacts logged during training.
| {{< img src="/images/tutorials/monai/viz-4.gif" alt="An example of model checkpoints logging and versioning on W&B." >}} |
|:--:|
| **An example of model checkpoints logging and versioning on W&B.** |
## Inference
Using the artifacts interface, you can select which version of the artifact is the best model checkpoint, in this case, the mean epoch-wise training loss. You can also explore the entire lineage of the artifact and use the version that you need.
| {{< img src="/images/tutorials/monai/viz-5.gif" alt="An example of model artifact tracking on W&B." >}} |
|:--:|
| **An example of model artifact tracking on W&B.** |
Fetch the version of the model artifact with the best epoch-wise mean training loss and load the checkpoint state dictionary to the model.
```python
model_artifact = wandb.use_artifact(
"geekyrakshit/monai-brain-tumor-segmentation/d5ex6n4a-checkpoint:v49",
type="model",
)
model_artifact_dir = model_artifact.download()
model.load_state_dict(torch.load(os.path.join(model_artifact_dir, "model.pth")))
model.eval()
```
### Visualizing Predictions and Comparing with the Ground Truth Labels
Create another utility function to visualize the predictions of the pre-trained model and compare them with the corresponding ground-truth segmentation mask using the interactive segmentation mask overlay,.
```python
def log_predictions_into_tables(
sample_image: np.array,
sample_label: np.array,
predicted_label: np.array,
split: str = None,
data_idx: int = None,
table: wandb.Table = None,
):
num_channels, _, _, num_slices = sample_image.shape
with tqdm(total=num_slices, leave=False) as progress_bar:
for slice_idx in range(num_slices):
wandb_images = []
for channel_idx in range(num_channels):
wandb_images += [
wandb.Image(
sample_image[channel_idx, :, :, slice_idx],
masks={
"ground-truth/Tumor-Core": {
"mask_data": sample_label[0, :, :, slice_idx],
"class_labels": {0: "background", 1: "Tumor Core"},
},
"prediction/Tumor-Core": {
"mask_data": predicted_label[0, :, :, slice_idx] * 2,
"class_labels": {0: "background", 2: "Tumor Core"},
},
},
),
wandb.Image(
sample_image[channel_idx, :, :, slice_idx],
masks={
"ground-truth/Whole-Tumor": {
"mask_data": sample_label[1, :, :, slice_idx],
"class_labels": {0: "background", 1: "Whole Tumor"},
},
"prediction/Whole-Tumor": {
"mask_data": predicted_label[1, :, :, slice_idx] * 2,
"class_labels": {0: "background", 2: "Whole Tumor"},
},
},
),
wandb.Image(
sample_image[channel_idx, :, :, slice_idx],
masks={
"ground-truth/Enhancing-Tumor": {
"mask_data": sample_label[2, :, :, slice_idx],
"class_labels": {0: "background", 1: "Enhancing Tumor"},
},
"prediction/Enhancing-Tumor": {
"mask_data": predicted_label[2, :, :, slice_idx] * 2,
"class_labels": {0: "background", 2: "Enhancing Tumor"},
},
},
),
]
table.add_data(split, data_idx, slice_idx, *wandb_images)
progress_bar.update(1)
return table
```
Log the prediction results to the prediction table.
```python
# create the prediction table
prediction_table = wandb.Table(
columns=[
"Split",
"Data Index",
"Slice Index",
"Image-Channel-0/Tumor-Core",
"Image-Channel-1/Tumor-Core",
"Image-Channel-2/Tumor-Core",
"Image-Channel-3/Tumor-Core",
"Image-Channel-0/Whole-Tumor",
"Image-Channel-1/Whole-Tumor",
"Image-Channel-2/Whole-Tumor",
"Image-Channel-3/Whole-Tumor",
"Image-Channel-0/Enhancing-Tumor",
"Image-Channel-1/Enhancing-Tumor",
"Image-Channel-2/Enhancing-Tumor",
"Image-Channel-3/Enhancing-Tumor",
]
)
# Perform inference and visualization
with torch.no_grad():
config.max_prediction_images_visualized
max_samples = (
min(config.max_prediction_images_visualized, len(val_dataset))
if config.max_prediction_images_visualized > 0
else len(val_dataset)
)
progress_bar = tqdm(
enumerate(val_dataset[:max_samples]),
total=max_samples,
desc="Generating Predictions:",
)
for data_idx, sample in progress_bar:
val_input = sample["image"].unsqueeze(0).to(device)
val_output = inference(model, val_input)
val_output = post_trans(val_output[0])
prediction_table = log_predictions_into_tables(
sample_image=sample["image"].cpu().numpy(),
sample_label=sample["label"].cpu().numpy(),
predicted_label=val_output.cpu().numpy(),
data_idx=data_idx,
split="validation",
table=prediction_table,
)
wandb.log({"Predictions/Tumor-Segmentation-Data": prediction_table})
# End the experiment
wandb.finish()
```
Use the interactive segmentation mask overlay to analyze and compare the predicted segmentation masks and the ground-truth labels for each class.
| {{< img src="/images/tutorials/monai/viz-6.gif" alt="An example of predictions and ground-truth visualization on W&B." >}} |
|:--:|
| **An example of predictions and ground-truth visualization on W&B.** |
## Acknowledgements and more resources
* [MONAI Tutorial: Brain tumor 3D segmentation with MONAI](https://github.com/Project-MONAI/tutorials/blob/main/3d_segmentation/brats_segmentation_3d.ipynb)
* [WandB Report: Brain Tumor Segmentation using MONAI and WandB](https://wandb.ai/geekyrakshit/brain-tumor-segmentation/reports/Brain-Tumor-Segmentation-using-MONAI-and-WandB---Vmlldzo0MjUzODIw)
# Keras
{{< cta-button colabLink="https://colab.research.google.com/github/wandb/examples/blob/master/colabs/keras/Use_WandbMetricLogger_in_your_Keras_workflow.ipynb" >}}
Use Weights & Biases for machine learning experiment tracking, dataset versioning, and project collaboration.
{{< img src="/images/tutorials/huggingface-why.png" alt="" >}}
This Colab notebook introduces the `WandbMetricsLogger` callback. Use this callback for [Experiment Tracking]({{< relref "/guides/models/track" >}}). It will log your training and validation metrics along with system metrics to Weights and Biases.
## Setup and Installation
First, let us install the latest version of Weights and Biases. We will then authenticate this colab instance to use W&B.
```shell
pip install -qq -U wandb
```
```python
import os
import tensorflow as tf
from tensorflow.keras import layers
from tensorflow.keras import models
import tensorflow_datasets as tfds
# Weights and Biases related imports
import wandb
from wandb.integration.keras import WandbMetricsLogger
```
If this is your first time using W&B or you are not logged in, the link that appears after running `wandb.login()` will take you to sign-up/login page. Signing up for a [free account](https://wandb.ai/signup) is as easy as a few clicks.
```python
wandb.login()
```
## Hyperparameters
Use of proper config system is a recommended best practice for reproducible machine learning. We can track the hyperparameters for every experiment using W&B. In this colab we will be using simple Python `dict` as our config system.
```python
configs = dict(
num_classes=10,
shuffle_buffer=1024,
batch_size=64,
image_size=28,
image_channels=1,
earlystopping_patience=3,
learning_rate=1e-3,
epochs=10,
)
```
## Dataset
In this colab, we will be using [CIFAR100](https://www.tensorflow.org/datasets/catalog/cifar100) dataset from TensorFlow Dataset catalog. We aim to build a simple image classification pipeline using TensorFlow/Keras.
```python
train_ds, valid_ds = tfds.load("fashion_mnist", split=["train", "test"])
```
```python
AUTOTUNE = tf.data.AUTOTUNE
def parse_data(example):
# Get image
image = example["image"]
# image = tf.image.convert_image_dtype(image, dtype=tf.float32)
# Get label
label = example["label"]
label = tf.one_hot(label, depth=configs["num_classes"])
return image, label
def get_dataloader(ds, configs, dataloader_type="train"):
dataloader = ds.map(parse_data, num_parallel_calls=AUTOTUNE)
if dataloader_type == "train":
dataloader = dataloader.shuffle(configs["shuffle_buffer"])
dataloader = dataloader.batch(configs["batch_size"]).prefetch(AUTOTUNE)
return dataloader
```
```python
trainloader = get_dataloader(train_ds, configs)
validloader = get_dataloader(valid_ds, configs, dataloader_type="valid")
```
## Model
```python
def get_model(configs):
backbone = tf.keras.applications.mobilenet_v2.MobileNetV2(
weights="imagenet", include_top=False
)
backbone.trainable = False
inputs = layers.Input(
shape=(configs["image_size"], configs["image_size"], configs["image_channels"])
)
resize = layers.Resizing(32, 32)(inputs)
neck = layers.Conv2D(3, (3, 3), padding="same")(resize)
preprocess_input = tf.keras.applications.mobilenet.preprocess_input(neck)
x = backbone(preprocess_input)
x = layers.GlobalAveragePooling2D()(x)
outputs = layers.Dense(configs["num_classes"], activation="softmax")(x)
return models.Model(inputs=inputs, outputs=outputs)
```
```python
tf.keras.backend.clear_session()
model = get_model(configs)
model.summary()
```
## Compile Model
```python
model.compile(
optimizer="adam",
loss="categorical_crossentropy",
metrics=[
"accuracy",
tf.keras.metrics.TopKCategoricalAccuracy(k=5, name="top@5_accuracy"),
],
)
```
## Train
```python
# Initialize a W&B run
run = wandb.init(project="intro-keras", config=configs)
# Train your model
model.fit(
trainloader,
epochs=configs["epochs"],
validation_data=validloader,
callbacks=[
WandbMetricsLogger(log_freq=10)
], # Notice the use of WandbMetricsLogger here
)
# Close the W&B run
run.finish()
```
# Keras models
{{< cta-button colabLink="https://colab.research.google.com/github/wandb/examples/blob/master/colabs/keras/Use_WandbModelCheckpoint_in_your_Keras_workflow.ipynb" >}}
Use Weights & Biases for machine learning experiment tracking, dataset versioning, and project collaboration.
{{< img src="/images/tutorials/huggingface-why.png" alt="" >}}
This Colab notebook introduces the `WandbModelCheckpoint` callback. Use this callback to log your model checkpoints to Weight and Biases [Artifacts]({{< relref "/guides/core/artifacts/" >}}).
## Setup and Installation
First, let us install the latest version of Weights and Biases. We will then authenticate this colab instance to use W&B.
```python
!pip install -qq -U wandb
```
```python
import os
import tensorflow as tf
from tensorflow.keras import layers
from tensorflow.keras import models
import tensorflow_datasets as tfds
# Weights and Biases related imports
import wandb
from wandb.integration.keras import WandbMetricsLogger
from wandb.integration.keras import WandbModelCheckpoint
```
If this is your first time using W&B or you are not logged in, the link that appears after running `wandb.login()` will take you to sign-up/login page. Signing up for a [free account](https://wandb.ai/signup) is as easy as a few clicks.
```python
wandb.login()
```
## Hyperparameters
Use of proper config system is a recommended best practice for reproducible machine learning. We can track the hyperparameters for every experiment using W&B. In this colab we will be using simple Python `dict` as our config system.
```python
configs = dict(
num_classes = 10,
shuffle_buffer = 1024,
batch_size = 64,
image_size = 28,
image_channels = 1,
earlystopping_patience = 3,
learning_rate = 1e-3,
epochs = 10
)
```
## Dataset
In this colab, we will be using [CIFAR100](https://www.tensorflow.org/datasets/catalog/cifar100) dataset from TensorFlow Dataset catalog. We aim to build a simple image classification pipeline using TensorFlow/Keras.
```python
train_ds, valid_ds = tfds.load('fashion_mnist', split=['train', 'test'])
```
```python
AUTOTUNE = tf.data.AUTOTUNE
def parse_data(example):
# Get image
image = example["image"]
# image = tf.image.convert_image_dtype(image, dtype=tf.float32)
# Get label
label = example["label"]
label = tf.one_hot(label, depth=configs["num_classes"])
return image, label
def get_dataloader(ds, configs, dataloader_type="train"):
dataloader = ds.map(parse_data, num_parallel_calls=AUTOTUNE)
if dataloader_type=="train":
dataloader = dataloader.shuffle(configs["shuffle_buffer"])
dataloader = (
dataloader
.batch(configs["batch_size"])
.prefetch(AUTOTUNE)
)
return dataloader
```
```python
trainloader = get_dataloader(train_ds, configs)
validloader = get_dataloader(valid_ds, configs, dataloader_type="valid")
```
## Model
```python
def get_model(configs):
backbone = tf.keras.applications.mobilenet_v2.MobileNetV2(weights='imagenet', include_top=False)
backbone.trainable = False
inputs = layers.Input(shape=(configs["image_size"], configs["image_size"], configs["image_channels"]))
resize = layers.Resizing(32, 32)(inputs)
neck = layers.Conv2D(3, (3,3), padding="same")(resize)
preprocess_input = tf.keras.applications.mobilenet.preprocess_input(neck)
x = backbone(preprocess_input)
x = layers.GlobalAveragePooling2D()(x)
outputs = layers.Dense(configs["num_classes"], activation="softmax")(x)
return models.Model(inputs=inputs, outputs=outputs)
```
```python
tf.keras.backend.clear_session()
model = get_model(configs)
model.summary()
```
## Compile Model
```python
model.compile(
optimizer = "adam",
loss = "categorical_crossentropy",
metrics = ["accuracy", tf.keras.metrics.TopKCategoricalAccuracy(k=5, name='top@5_accuracy')]
)
```
## Train
```python
# Initialize a W&B run
run = wandb.init(
project = "intro-keras",
config = configs
)
# Train your model
model.fit(
trainloader,
epochs = configs["epochs"],
validation_data = validloader,
callbacks = [
WandbMetricsLogger(log_freq=10),
WandbModelCheckpoint(filepath="models/") # Notice the use of WandbModelCheckpoint here
]
)
# Close the W&B run
run.finish()
```
# Keras tables
{{< cta-button colabLink="https://colab.research.google.com/github/wandb/examples/blob/master/colabs/keras/Use_WandbEvalCallback_in_your_Keras_workflow.ipynb" >}}
Use Weights & Biases for machine learning experiment tracking, dataset versioning, and project collaboration.
{{< img src="/images/tutorials/huggingface-why.png" alt="" >}}
This Colab notebook introduces the `WandbEvalCallback` which is an abstract callback that be inherited to build useful callbacks for model prediction visualization and dataset visualization.
## Setup and Installation
First, let us install the latest version of Weights and Biases. We will then authenticate this colab instance to use W&B.
```shell
pip install -qq -U wandb
```
```python
import os
import numpy as np
import tensorflow as tf
from tensorflow.keras import layers
from tensorflow.keras import models
import tensorflow_datasets as tfds
# Weights and Biases related imports
import wandb
from wandb.integration.keras import WandbMetricsLogger
from wandb.integration.keras import WandbModelCheckpoint
from wandb.integration.keras import WandbEvalCallback
```
If this is your first time using W&B or you are not logged in, the link that appears after running `wandb.login()` will take you to sign-up/login page. Signing up for a [free account](https://wandb.ai/signup) is as easy as a few clicks.
```python
wandb.login()
```
## Hyperparameters
Use of proper config system is a recommended best practice for reproducible machine learning. We can track the hyperparameters for every experiment using W&B. In this colab we will be using simple Python `dict` as our config system.
```python
configs = dict(
num_classes=10,
shuffle_buffer=1024,
batch_size=64,
image_size=28,
image_channels=1,
earlystopping_patience=3,
learning_rate=1e-3,
epochs=10,
)
```
## Dataset
In this colab, we will be using [CIFAR100](https://www.tensorflow.org/datasets/catalog/cifar100) dataset from TensorFlow Dataset catalog. We aim to build a simple image classification pipeline using TensorFlow/Keras.
```python
train_ds, valid_ds = tfds.load("fashion_mnist", split=["train", "test"])
```
```
AUTOTUNE = tf.data.AUTOTUNE
def parse_data(example):
# Get image
image = example["image"]
# image = tf.image.convert_image_dtype(image, dtype=tf.float32)
# Get label
label = example["label"]
label = tf.one_hot(label, depth=configs["num_classes"])
return image, label
def get_dataloader(ds, configs, dataloader_type="train"):
dataloader = ds.map(parse_data, num_parallel_calls=AUTOTUNE)
if dataloader_type=="train":
dataloader = dataloader.shuffle(configs["shuffle_buffer"])
dataloader = (
dataloader
.batch(configs["batch_size"])
.prefetch(AUTOTUNE)
)
return dataloader
```
```python
trainloader = get_dataloader(train_ds, configs)
validloader = get_dataloader(valid_ds, configs, dataloader_type="valid")
```
## Model
```python
def get_model(configs):
backbone = tf.keras.applications.mobilenet_v2.MobileNetV2(
weights="imagenet", include_top=False
)
backbone.trainable = False
inputs = layers.Input(
shape=(configs["image_size"], configs["image_size"], configs["image_channels"])
)
resize = layers.Resizing(32, 32)(inputs)
neck = layers.Conv2D(3, (3, 3), padding="same")(resize)
preprocess_input = tf.keras.applications.mobilenet.preprocess_input(neck)
x = backbone(preprocess_input)
x = layers.GlobalAveragePooling2D()(x)
outputs = layers.Dense(configs["num_classes"], activation="softmax")(x)
return models.Model(inputs=inputs, outputs=outputs)
```
```python
tf.keras.backend.clear_session()
model = get_model(configs)
model.summary()
```
## Compile Model
```python
model.compile(
optimizer="adam",
loss="categorical_crossentropy",
metrics=[
"accuracy",
tf.keras.metrics.TopKCategoricalAccuracy(k=5, name="top@5_accuracy"),
],
)
```
## `WandbEvalCallback`
The `WandbEvalCallback` is an abstract base class to build Keras callbacks for primarily model prediction visualization and secondarily dataset visualization.
This is a dataset and task agnostic abstract callback. To use this, inherit from this base callback class and implement the `add_ground_truth` and `add_model_prediction` methods.
The `WandbEvalCallback` is a utility class that provides helpful methods to:
- create data and prediction `wandb.Table` instances,
- log data and prediction Tables as `wandb.Artifact`,
- logs the data table `on_train_begin`,
- logs the prediction table `on_epoch_end`.
As an example, we have implemented `WandbClfEvalCallback` below for an image classification task. This example callback:
- logs the validation data (`data_table`) to W&B,
- performs inference and logs the prediction (`pred_table`) to W&B on every epoch end.
## How the memory footprint is reduced
We log the `data_table` to W&B when the `on_train_begin` method is ivoked. Once it's uploaded as a W&B Artifact, we get a reference to this table which can be accessed using `data_table_ref` class variable. The `data_table_ref` is a 2D list that can be indexed like `self.data_table_ref[idx][n]` where `idx` is the row number while `n` is the column number. Let's see the usage in the example below.
```python
class WandbClfEvalCallback(WandbEvalCallback):
def __init__(
self, validloader, data_table_columns, pred_table_columns, num_samples=100
):
super().__init__(data_table_columns, pred_table_columns)
self.val_data = validloader.unbatch().take(num_samples)
def add_ground_truth(self, logs=None):
for idx, (image, label) in enumerate(self.val_data):
self.data_table.add_data(idx, wandb.Image(image), np.argmax(label, axis=-1))
def add_model_predictions(self, epoch, logs=None):
# Get predictions
preds = self._inference()
table_idxs = self.data_table_ref.get_index()
for idx in table_idxs:
pred = preds[idx]
self.pred_table.add_data(
epoch,
self.data_table_ref.data[idx][0],
self.data_table_ref.data[idx][1],
self.data_table_ref.data[idx][2],
pred,
)
def _inference(self):
preds = []
for image, label in self.val_data:
pred = self.model(tf.expand_dims(image, axis=0))
argmax_pred = tf.argmax(pred, axis=-1).numpy()[0]
preds.append(argmax_pred)
return preds
```
## Train
```python
# Initialize a W&B run
run = wandb.init(project="intro-keras", config=configs)
# Train your model
model.fit(
trainloader,
epochs=configs["epochs"],
validation_data=validloader,
callbacks=[
WandbMetricsLogger(log_freq=10),
WandbClfEvalCallback(
validloader,
data_table_columns=["idx", "image", "ground_truth"],
pred_table_columns=["epoch", "idx", "image", "ground_truth", "prediction"],
), # Notice the use of WandbEvalCallback here
],
)
# Close the W&B run
run.finish()
```
# XGBoost Sweeps
{{< cta-button colabLink="https://colab.research.google.com/github/wandb/examples/blob/master/colabs/boosting/Using_W&B_Sweeps_with_XGBoost.ipynb" >}}
Use Weights & Biases for machine learning experiment tracking, dataset versioning, and project collaboration.
{{< img src="/images/tutorials/huggingface-why.png" alt="" >}}
Squeezing the best performance out of tree-based models requires
[selecting the right hyperparameters](https://blog.cambridgespark.com/hyperparameter-tuning-in-xgboost-4ff9100a3b2f).
How many `early_stopping_rounds`? What should the `max_depth` of a tree be?
Searching through high dimensional hyperparameter spaces to find the most performant model can get unwieldy very fast.
Hyperparameter sweeps provide an organized and efficient way to conduct a battle royale of models and crown a winner.
They enable this by automatically searching through combinations of hyperparameter values to find the most optimal values.
In this tutorial we'll see how you can run sophisticated hyperparameter sweeps on XGBoost models in 3 easy steps using Weights and Biases.
For a teaser, check out the plots below:
{{< img src="/images/tutorials/xgboost_sweeps/sweeps_xgboost.png" alt="sweeps_xgboost" >}}
## Sweeps: An Overview
Running a hyperparameter sweep with Weights & Biases is very easy. There are just 3 simple steps:
1. **Define the sweep:** we do this by creating a dictionary-like object that specifies the sweep: which parameters to search through, which search strategy to use, which metric to optimize.
2. **Initialize the sweep:** with one line of code we initialize the sweep and pass in the dictionary of sweep configurations:
`sweep_id = wandb.sweep(sweep_config)`
3. **Run the sweep agent:** also accomplished with one line of code, we call w`andb.agent()` and pass the `sweep_id` along with a function that defines your model architecture and trains it:
`wandb.agent(sweep_id, function=train)`
That's all there is to running a hyperparameter sweep.
In the notebook below, we'll walk through these 3 steps in more detail.
We highly encourage you to fork this notebook, tweak the parameters, or try the model with your own dataset.
### Resources
- [Sweeps docs →]({{< relref "/guides/models/sweeps/" >}})
- [Launching from the command line →](https://www.wandb.com/articles/hyperparameter-tuning-as-easy-as-1-2-3)
```python
!pip install wandb -qU
```
```python
import wandb
wandb.login()
```
## 1. Define the Sweep
Weights & Biases sweeps give you powerful levers to configure your sweeps exactly how you want them, with just a few lines of code. The sweeps config can be defined as
[a dictionary or a YAML file]({{< relref "/guides/models/sweeps/define-sweep-configuration" >}}).
Let's walk through some of them together:
* **Metric**: This is the metric the sweeps are attempting to optimize. Metrics can take a `name` (this metric should be logged by your training script) and a `goal` (`maximize` or `minimize`).
* **Search Strategy**: Specified using the `"method"` key. We support several different search strategies with sweeps.
* **Grid Search**: Iterates over every combination of hyperparameter values.
* **Random Search**: Iterates over randomly chosen combinations of hyperparameter values.
* **Bayesian Search**: Creates a probabilistic model that maps hyperparameters to probability of a metric score, and chooses parameters with high probability of improving the metric. The objective of Bayesian optimization is to spend more time in picking the hyperparameter values, but in doing so trying out fewer hyperparameter values.
* **Parameters**: A dictionary containing the hyperparameter names, and discrete values, a range, or distributions from which to pull their values on each iteration.
For details, see the [list of all sweep configuration options]({{< relref "/guides/models/sweeps/define-sweep-configuration" >}}).
```python
sweep_config = {
"method": "random", # try grid or random
"metric": {
"name": "accuracy",
"goal": "maximize"
},
"parameters": {
"booster": {
"values": ["gbtree","gblinear"]
},
"max_depth": {
"values": [3, 6, 9, 12]
},
"learning_rate": {
"values": [0.1, 0.05, 0.2]
},
"subsample": {
"values": [1, 0.5, 0.3]
}
}
}
```
## 2. Initialize the Sweep
Calling `wandb.sweep` starts a Sweep Controller --
a centralized process that provides settings of the `parameters` to any who query it
and expects them to return performance on `metrics` via `wandb` logging.
```python
sweep_id = wandb.sweep(sweep_config, project="XGBoost-sweeps")
```
### Define your training process
Before we can run the sweep,
we need to define a function that creates and trains the model --
the function that takes in hyperparameter values and spits out metrics.
We'll also need `wandb` to be integrated into our script.
There's three main components:
* `wandb.init()`: Initialize a new W&B run. Each run is single execution of the training script.
* `wandb.config`: Save all your hyperparameters in a config object. This lets you use [our app](https://wandb.ai) to sort and compare your runs by hyperparameter values.
* `wandb.log()`: Logs metrics and custom objects, such as images, videos, audio files, HTML, plots, or point clouds.
We also need to download the data:
```python
!wget https://raw.githubusercontent.com/jbrownlee/Datasets/master/pima-indians-diabetes.data.csv
```
```python
# XGBoost model for Pima Indians dataset
from numpy import loadtxt
from xgboost import XGBClassifier
from sklearn.model_selection import train_test_split
from sklearn.metrics import accuracy_score
# load data
def train():
config_defaults = {
"booster": "gbtree",
"max_depth": 3,
"learning_rate": 0.1,
"subsample": 1,
"seed": 117,
"test_size": 0.33,
}
wandb.init(config=config_defaults) # defaults are over-ridden during the sweep
config = wandb.config
# load data and split into predictors and targets
dataset = loadtxt("pima-indians-diabetes.data.csv", delimiter=",")
X, Y = dataset[:, :8], dataset[:, 8]
# split data into train and test sets
X_train, X_test, y_train, y_test = train_test_split(X, Y,
test_size=config.test_size,
random_state=config.seed)
# fit model on train
model = XGBClassifier(booster=config.booster, max_depth=config.max_depth,
learning_rate=config.learning_rate, subsample=config.subsample)
model.fit(X_train, y_train)
# make predictions on test
y_pred = model.predict(X_test)
predictions = [round(value) for value in y_pred]
# evaluate predictions
accuracy = accuracy_score(y_test, predictions)
print(f"Accuracy: {accuracy:.0%}")
wandb.log({"accuracy": accuracy})
```
## 3. Run the Sweep with an agent
Now, we call `wandb.agent` to start up our sweep.
You can call `wandb.agent` on any machine where you're logged into W&B that has
- the `sweep_id`,
- the dataset and `train` function
and that machine will join the sweep.
> _Note_: a `random` sweep will by defauly run forever,
trying new parameter combinations until the cows come home --
or until you [turn the sweep off from the app UI]({{< relref "/guides/models/sweeps/sweeps-ui" >}}).
You can prevent this by providing the total `count` of runs you'd like the `agent` to complete.
```python
wandb.agent(sweep_id, train, count=25)
```
## Visualize your results
Now that your sweep is finished, it's time to look at the results.
Weights & Biases will generate a number of useful plots for you automatically.
### Parallel coordinates plot
This plot maps hyperparameter values to model metrics. It’s useful for honing in on combinations of hyperparameters that led to the best model performance.
This plot seems to indicate that using a tree as our learner slightly,
but not mind-blowingly,
outperforms using a simple linear model as our learner.
{{< img src="/images/tutorials/xgboost_sweeps/sweeps_xgboost2.png" alt="sweeps_xgboost" >}}
### Hyperparameter importance plot
The hyperparameter importance plot shows which hyperparameter values had the biggest impact
on your metrics.
We report both the correlation (treating it as a linear predictor)
and the feature importance (after training a random forest on your results)
so you can see which parameters had the biggest effect
and whether that effect was positive or negative.
Reading this chart, we see quantitative confirmation
of the trend we noticed in the parallel coordinates chart above:
the largest impact on validation accuracy came from the choice of
learner, and the `gblinear` learners were generally worse than `gbtree` learners.
{{< img src="/images/tutorials/xgboost_sweeps/sweeps_xgboost3.png" alt="sweeps_xgboost" >}}
These visualizations can help you save both time and resources running expensive hyperparameter optimizations by honing in on the parameters (and value ranges) that are the most important, and thereby worthy of further exploration.
```bash
pip install litellm faiss-gpu
```
```python
RagModel = weave.ref(
"weave:///wandb-smle/weave-cookboook-demo/object/RagModel:cqRaGKcxutBWXyM0fCGTR1Yk2mISLsNari4wlGTwERo"
).get()
# MAGIC: exchange chat_model and publish new version (no need to worry about other RAG components)
RagModel.chat_model = new_chat_model
# First publish the new version so that it is referenced during predictions
PUB_REFERENCE = weave.publish(RagModel, "RagModel")
await RagModel.predict("When was the first conference on climate change?")
```
## 4. Run new `weave.Evaluation` connecting to the existing models run
Finally, evaluate the new `RagModel` on the existing `weave.Evaluation`. To make the integration as easy as possible, include the following changes.
From a Models perspective:
- Getting the model from the registry creates a new `wandb.run` which is part of the E2E lineage of the chat model
- Add the Trace ID (with current eval ID) to the run config so that the model team can click the link to go to the corresponding Weave page
From a Weave perspective:
- Save the artifact / registry link as input to the `ChatModel` (that is `RagModel`)
- Save the run.id as extra column in the traces with `weave.attributes`
```python
# MAGIC: get an evaluation with a eval dataset and scorers and use them
WEAVE_EVAL = "weave:///wandb-smle/weave-cookboook-demo/object/climate_rag_eval:ntRX6qn3Tx6w3UEVZXdhIh1BWGh7uXcQpOQnIuvnSgo"
climate_rag_eval = weave.ref(WEAVE_EVAL).get()
with weave.attributes({"wandb-run-id": wandb.run.id}):
# use .call attribute to retrieve both the result and the call in order to save eval trace to Models
summary, call = await climate_rag_eval.evaluate.call(climate_rag_eval, ` RagModel `)
```
## 5. Save the new RAG model on the Registry
In order to effectively share the new RAG Model, push it to the Registry as a reference artifact adding in the weave version as an alias.
```python
MODELS_OBJECT_VERSION = PUB_REFERENCE.digest # weave object version
MODELS_OBJECT_NAME = PUB_REFERENCE.name # weave object name
models_url = f"https://wandb.ai/{ENTITY}/{PROJECT}/weave/objects/{MODELS_OBJECT_NAME}/versions/{MODELS_OBJECT_VERSION}"
models_link = (
f"weave:///{ENTITY}/{PROJECT}/object/{MODELS_OBJECT_NAME}:{MODELS_OBJECT_VERSION}"
)
with wandb.init(project=PROJECT, entity=ENTITY) as run:
# create new Artifact
artifact_model = wandb.Artifact(
name="RagModel",
type="model",
description="Models Link from RagModel in Weave",
metadata={"url": models_url},
)
artifact_model.add_reference(models_link, name="model", checksum=False)
# log new artifact
run.log_artifact(artifact_model, aliases=[MODELS_OBJECT_VERSION])
# link to registry
run.link_artifact(
artifact_model, target_path="wandb32/wandb-registry-RAG Models/RAG Model"
)
```
# Integration tutorials
# PyTorch
{{< cta-button colabLink="https://colab.research.google.com/github/wandb/examples/blob/master/colabs/pytorch/Simple_PyTorch_Integration.ipynb" >}}
Use [Weights & Biases](https://wandb.com) for machine learning experiment tracking, dataset versioning, and project collaboration.
{{< img src="/images/tutorials/huggingface-why.png" alt="" >}}
## What this notebook covers
We show you how to integrate Weights & Biases with your PyTorch code to add experiment tracking to your pipeline.
{{< img src="/images/tutorials/pytorch.png" alt="" >}}
```python
# import the library
import wandb
# start a new experiment
wandb.init(project="new-sota-model")
# capture a dictionary of hyperparameters with config
wandb.config = {"learning_rate": 0.001, "epochs": 100, "batch_size": 128}
# set up model and data
model, dataloader = get_model(), get_data()
# optional: track gradients
wandb.watch(model)
for batch in dataloader:
metrics = model.training_step()
# log metrics inside your training loop to visualize model performance
wandb.log(metrics)
# optional: save model at the end
model.to_onnx()
wandb.save("model.onnx")
```
Follow along with a [video tutorial](http://wandb.me/pytorch-video).
**Note**: Sections starting with _Step_ are all you need to integrate W&B in an existing pipeline. The rest just loads data and defines a model.
## Install, import, and log in
```python
import os
import random
import numpy as np
import torch
import torch.nn as nn
import torchvision
import torchvision.transforms as transforms
from tqdm.auto import tqdm
# Ensure deterministic behavior
torch.backends.cudnn.deterministic = True
random.seed(hash("setting random seeds") % 2**32 - 1)
np.random.seed(hash("improves reproducibility") % 2**32 - 1)
torch.manual_seed(hash("by removing stochasticity") % 2**32 - 1)
torch.cuda.manual_seed_all(hash("so runs are repeatable") % 2**32 - 1)
# Device configuration
device = torch.device("cuda:0" if torch.cuda.is_available() else "cpu")
# remove slow mirror from list of MNIST mirrors
torchvision.datasets.MNIST.mirrors = [mirror for mirror in torchvision.datasets.MNIST.mirrors
if not mirror.startswith("http://yann.lecun.com")]
```
### Step 0: Install W&B
To get started, we'll need to get the library.
`wandb` is easily installed using `pip`.
```python
!pip install wandb onnx -Uq
```
### Step 1: Import W&B and Login
In order to log data to our web service,
you'll need to log in.
If this is your first time using W&B,
you'll need to sign up for a free account at the link that appears.
```
import wandb
wandb.login()
```
## Define the Experiment and Pipeline
### Track metadata and hyperparameters with `wandb.init`
Programmatically, the first thing we do is define our experiment:
what are the hyperparameters? what metadata is associated with this run?
It's a pretty common workflow to store this information in a `config` dictionary
(or similar object)
and then access it as needed.
For this example, we're only letting a few hyperparameters vary
and hand-coding the rest.
But any part of your model can be part of the `config`.
We also include some metadata: we're using the MNIST dataset and a convolutional
architecture. If we later work with, say,
fully connected architectures on CIFAR in the same project,
this will help us separate our runs.
```python
config = dict(
epochs=5,
classes=10,
kernels=[16, 32],
batch_size=128,
learning_rate=0.005,
dataset="MNIST",
architecture="CNN")
```
Now, let's define the overall pipeline,
which is pretty typical for model-training:
1. we first `make` a model, plus associated data and optimizer, then
2. we `train` the model accordingly and finally
3. `test` it to see how training went.
We'll implement these functions below.
```python
def model_pipeline(hyperparameters):
# tell wandb to get started
with wandb.init(project="pytorch-demo", config=hyperparameters):
# access all HPs through wandb.config, so logging matches execution.
config = wandb.config
# make the model, data, and optimization problem
model, train_loader, test_loader, criterion, optimizer = make(config)
print(model)
# and use them to train the model
train(model, train_loader, criterion, optimizer, config)
# and test its final performance
test(model, test_loader)
return model
```
The only difference here from a standard pipeline
is that it all occurs inside the context of `wandb.init`.
Calling this function sets up a line of communication
between your code and our servers.
Passing the `config` dictionary to `wandb.init`
immediately logs all that information to us,
so you'll always know what hyperparameter values
you set your experiment to use.
To ensure the values you chose and logged are always the ones that get used
in your model, we recommend using the `wandb.config` copy of your object.
Check the definition of `make` below to see some examples.
> *Side Note*: We take care to run our code in separate processes,
so that any issues on our end
(such as if a giant sea monster attacks our data centers)
don't crash your code.
Once the issue is resolved, such as when the Kraken returns to the deep,
you can log the data with `wandb sync`.
```python
def make(config):
# Make the data
train, test = get_data(train=True), get_data(train=False)
train_loader = make_loader(train, batch_size=config.batch_size)
test_loader = make_loader(test, batch_size=config.batch_size)
# Make the model
model = ConvNet(config.kernels, config.classes).to(device)
# Make the loss and optimizer
criterion = nn.CrossEntropyLoss()
optimizer = torch.optim.Adam(
model.parameters(), lr=config.learning_rate)
return model, train_loader, test_loader, criterion, optimizer
```
### Define the Data Loading and Model
Now, we need to specify how the data is loaded and what the model looks like.
This part is very important, but it's
no different from what it would be without `wandb`,
so we won't dwell on it.
```python
def get_data(slice=5, train=True):
full_dataset = torchvision.datasets.MNIST(root=".",
train=train,
transform=transforms.ToTensor(),
download=True)
# equiv to slicing with [::slice]
sub_dataset = torch.utils.data.Subset(
full_dataset, indices=range(0, len(full_dataset), slice))
return sub_dataset
def make_loader(dataset, batch_size):
loader = torch.utils.data.DataLoader(dataset=dataset,
batch_size=batch_size,
shuffle=True,
pin_memory=True, num_workers=2)
return loader
```
Defining the model is normally the fun part.
But nothing changes with `wandb`,
so we're gonna stick with a standard ConvNet architecture.
Don't be afraid to mess around with this and try some experiments --
all your results will be logged on [wandb.ai](https://wandb.ai).
```python
# Conventional and convolutional neural network
class ConvNet(nn.Module):
def __init__(self, kernels, classes=10):
super(ConvNet, self).__init__()
self.layer1 = nn.Sequential(
nn.Conv2d(1, kernels[0], kernel_size=5, stride=1, padding=2),
nn.ReLU(),
nn.MaxPool2d(kernel_size=2, stride=2))
self.layer2 = nn.Sequential(
nn.Conv2d(16, kernels[1], kernel_size=5, stride=1, padding=2),
nn.ReLU(),
nn.MaxPool2d(kernel_size=2, stride=2))
self.fc = nn.Linear(7 * 7 * kernels[-1], classes)
def forward(self, x):
out = self.layer1(x)
out = self.layer2(out)
out = out.reshape(out.size(0), -1)
out = self.fc(out)
return out
```
### Define Training Logic
Moving on in our `model_pipeline`, it's time to specify how we `train`.
Two `wandb` functions come into play here: `watch` and `log`.
## Track gradients with `wandb.watch` and everything else with `wandb.log`
`wandb.watch` will log the gradients and the parameters of your model,
every `log_freq` steps of training.
All you need to do is call it before you start training.
The rest of the training code remains the same:
we iterate over epochs and batches,
running forward and backward passes
and applying our `optimizer`.
```python
def train(model, loader, criterion, optimizer, config):
# Tell wandb to watch what the model gets up to: gradients, weights, and more.
wandb.watch(model, criterion, log="all", log_freq=10)
# Run training and track with wandb
total_batches = len(loader) * config.epochs
example_ct = 0 # number of examples seen
batch_ct = 0
for epoch in tqdm(range(config.epochs)):
for _, (images, labels) in enumerate(loader):
loss = train_batch(images, labels, model, optimizer, criterion)
example_ct += len(images)
batch_ct += 1
# Report metrics every 25th batch
if ((batch_ct + 1) % 25) == 0:
train_log(loss, example_ct, epoch)
def train_batch(images, labels, model, optimizer, criterion):
images, labels = images.to(device), labels.to(device)
# Forward pass ➡
outputs = model(images)
loss = criterion(outputs, labels)
# Backward pass ⬅
optimizer.zero_grad()
loss.backward()
# Step with optimizer
optimizer.step()
return loss
```
The only difference is in the logging code:
where previously you might have reported metrics by printing to the terminal,
now you pass the same information to `wandb.log`.
`wandb.log` expects a dictionary with strings as keys.
These strings identify the objects being logged, which make up the values.
You can also optionally log which `step` of training you're on.
> *Side Note*: I like to use the number of examples the model has seen,
since this makes for easier comparison across batch sizes,
but you can use raw steps or batch count. For longer training runs, it can also make sense to log by `epoch`.
```python
def train_log(loss, example_ct, epoch):
# Where the magic happens
wandb.log({"epoch": epoch, "loss": loss}, step=example_ct)
print(f"Loss after {str(example_ct).zfill(5)} examples: {loss:.3f}")
```
### Define Testing Logic
Once the model is done training, we want to test it:
run it against some fresh data from production, perhaps,
or apply it to some hand-curated examples.
## (Optional) Call `wandb.save`
This is also a great time to save the model's architecture
and final parameters to disk.
For maximum compatibility, we'll `export` our model in the
[Open Neural Network eXchange (ONNX) format](https://onnx.ai/).
Passing that filename to `wandb.save` ensures that the model parameters
are saved to W&B's servers: no more losing track of which `.h5` or `.pb`
corresponds to which training runs.
For more advanced `wandb` features for storing, versioning, and distributing
models, check out our [Artifacts tools](https://www.wandb.com/artifacts).
```python
def test(model, test_loader):
model.eval()
# Run the model on some test examples
with torch.no_grad():
correct, total = 0, 0
for images, labels in test_loader:
images, labels = images.to(device), labels.to(device)
outputs = model(images)
_, predicted = torch.max(outputs.data, 1)
total += labels.size(0)
correct += (predicted == labels).sum().item()
print(f"Accuracy of the model on the {total} " +
f"test images: {correct / total:%}")
wandb.log({"test_accuracy": correct / total})
# Save the model in the exchangeable ONNX format
torch.onnx.export(model, images, "model.onnx")
wandb.save("model.onnx")
```
### Run training and watch your metrics live on wandb.ai
Now that we've defined the whole pipeline and slipped in
those few lines of W&B code,
we're ready to run our fully tracked experiment.
We'll report a few links to you:
our documentation,
the Project page, which organizes all the runs in a project, and
the Run page, where this run's results will be stored.
Navigate to the Run page and check out these tabs:
1. **Charts**, where the model gradients, parameter values, and loss are logged throughout training
2. **System**, which contains a variety of system metrics, including Disk I/O utilization, CPU and GPU metrics (watch that temperature soar), and more
3. **Logs**, which has a copy of anything pushed to standard out during training
4. **Files**, where, once training is complete, you can click on the `model.onnx` to view our network with the [Netron model viewer](https://github.com/lutzroeder/netron).
Once the run in finished, when the `with wandb.init` block exits,
we'll also print a summary of the results in the cell output.
```python
# Build, train and analyze the model with the pipeline
model = model_pipeline(config)
```
### Test Hyperparameters with Sweeps
We only looked at a single set of hyperparameters in this example.
But an important part of most ML workflows is iterating over
a number of hyperparameters.
You can use Weights & Biases Sweeps to automate hyperparameter testing and explore the space of possible models and optimization strategies.
## [Check out Hyperparameter Optimization in PyTorch using W&B Sweeps](http://wandb.me/sweeps-colab)
Running a hyperparameter sweep with Weights & Biases is very easy. There are just 3 simple steps:
1. **Define the sweep:** We do this by creating a dictionary or a [YAML file]({{< relref "/guides/models/sweeps/define-sweep-configuration" >}}) that specifies the parameters to search through, the search strategy, the optimization metric et all.
2. **Initialize the sweep:**
`sweep_id = wandb.sweep(sweep_config)`
3. **Run the sweep agent:**
`wandb.agent(sweep_id, function=train)`
That's all there is to running a hyperparameter sweep.
{{< img src="/images/tutorials/pytorch-2.png" alt="" >}}
## Example Gallery
See examples of projects tracked and visualized with W&B in our [Gallery →](https://app.wandb.ai/gallery)
## Advanced Setup
1. [Environment variables]({{< relref "/guides/hosting/env-vars/" >}}): Set API keys in environment variables so you can run training on a managed cluster.
2. [Offline mode]({{< relref "/support/kb-articles/run_wandb_offline.md" >}}): Use `dryrun` mode to train offline and sync results later.
3. [On-prem]({{< relref "/guides/hosting/hosting-options/self-managed" >}}): Install W&B in a private cloud or air-gapped servers in your own infrastructure. We have local installations for everyone from academics to enterprise teams.
4. [Sweeps]({{< relref "/guides/models/sweeps/" >}}): Set up hyperparameter search quickly with our lightweight tool for tuning.
# PyTorch Lightning
{{< cta-button colabLink="https://colab.research.google.com/github/wandb/examples/blob/master/colabs/pytorch-lightning/Image_Classification_using_PyTorch_Lightning.ipynb" >}}
We will build an image classification pipeline using PyTorch Lightning. We will follow this [style guide](https://lightning.ai/docs/pytorch/stable/starter/style_guide.html) to increase the readability and reproducibility of our code. A cool explanation of this available [here](https://wandb.ai/wandb/wandb-lightning/reports/Image-Classification-using-PyTorch-Lightning--VmlldzoyODk1NzY).
## Setting up PyTorch Lightning and W&B
For this tutorial, we need PyTorch Lightning and Weights and Biases.
```shell
pip install lightning -q
pip install wandb -qU
```
```python
import lightning.pytorch as pl
# your favorite machine learning tracking tool
from lightning.pytorch.loggers import WandbLogger
import torch
from torch import nn
from torch.nn import functional as F
from torch.utils.data import random_split, DataLoader
from torchmetrics import Accuracy
from torchvision import transforms
from torchvision.datasets import CIFAR10
import wandb
```
Now you'll need to log in to your wandb account.
```
wandb.login()
```
## DataModule - The Data Pipeline we Deserve
DataModules are a way of decoupling data-related hooks from the LightningModule so you can develop dataset agnostic models.
It organizes the data pipeline into one shareable and reusable class. A datamodule encapsulates the five steps involved in data processing in PyTorch:
- Download / tokenize / process.
- Clean and (maybe) save to disk.
- Load inside Dataset.
- Apply transforms (rotate, tokenize, etc…).
- Wrap inside a DataLoader.
Learn more about datamodules [here](https://lightning.ai/docs/pytorch/stable/data/datamodule.html). Let's build a datamodule for the Cifar-10 dataset.
```
class CIFAR10DataModule(pl.LightningDataModule):
def __init__(self, batch_size, data_dir: str = './'):
super().__init__()
self.data_dir = data_dir
self.batch_size = batch_size
self.transform = transforms.Compose([
transforms.ToTensor(),
transforms.Normalize((0.5, 0.5, 0.5), (0.5, 0.5, 0.5))
])
self.num_classes = 10
def prepare_data(self):
CIFAR10(self.data_dir, train=True, download=True)
CIFAR10(self.data_dir, train=False, download=True)
def setup(self, stage=None):
# Assign train/val datasets for use in dataloaders
if stage == 'fit' or stage is None:
cifar_full = CIFAR10(self.data_dir, train=True, transform=self.transform)
self.cifar_train, self.cifar_val = random_split(cifar_full, [45000, 5000])
# Assign test dataset for use in dataloader(s)
if stage == 'test' or stage is None:
self.cifar_test = CIFAR10(self.data_dir, train=False, transform=self.transform)
def train_dataloader(self):
return DataLoader(self.cifar_train, batch_size=self.batch_size, shuffle=True)
def val_dataloader(self):
return DataLoader(self.cifar_val, batch_size=self.batch_size)
def test_dataloader(self):
return DataLoader(self.cifar_test, batch_size=self.batch_size)
```
## Callbacks
A callback is a self-contained program that can be reused across projects. PyTorch Lightning comes with few [built-in callbacks](https://lightning.ai/docs/pytorch/latest/extensions/callbacks.html#built-in-callbacks) which are regularly used.
Learn more about callbacks in PyTorch Lightning [here](https://lightning.ai/docs/pytorch/latest/extensions/callbacks.html).
### Built-in Callbacks
In this tutorial, we will use [Early Stopping](https://lightning.ai/docs/pytorch/latest/api/lightning.pytorch.callbacks.EarlyStopping.html#lightning.callbacks.EarlyStopping) and [Model Checkpoint](https://lightning.ai/docs/pytorch/latest/api/lightning.pytorch.callbacks.ModelCheckpoint.html#pytorch_lightning.callbacks.ModelCheckpoint) built-in callbacks. They can be passed to the `Trainer`.
### Custom Callbacks
If you are familiar with Custom Keras callback, the ability to do the same in your PyTorch pipeline is just a cherry on the cake.
Since we are performing image classification, the ability to visualize the model's predictions on some samples of images can be helpful. This in the form of a callback can help debug the model at an early stage.
```
class ImagePredictionLogger(pl.callbacks.Callback):
def __init__(self, val_samples, num_samples=32):
super().__init__()
self.num_samples = num_samples
self.val_imgs, self.val_labels = val_samples
def on_validation_epoch_end(self, trainer, pl_module):
# Bring the tensors to CPU
val_imgs = self.val_imgs.to(device=pl_module.device)
val_labels = self.val_labels.to(device=pl_module.device)
# Get model prediction
logits = pl_module(val_imgs)
preds = torch.argmax(logits, -1)
# Log the images as wandb Image
trainer.logger.experiment.log({
"examples":[wandb.Image(x, caption=f"Pred:{pred}, Label:{y}")
for x, pred, y in zip(val_imgs[:self.num_samples],
preds[:self.num_samples],
val_labels[:self.num_samples])]
})
```
## LightningModule - Define the System
The LightningModule defines a system and not a model. Here a system groups all the research code into a single class to make it self-contained. `LightningModule` organizes your PyTorch code into 5 sections:
- Computations (`__init__`).
- Train loop (`training_step`)
- Validation loop (`validation_step`)
- Test loop (`test_step`)
- Optimizers (`configure_optimizers`)
One can thus build a dataset agnostic model that can be easily shared. Let's build a system for Cifar-10 classification.
```
class LitModel(pl.LightningModule):
def __init__(self, input_shape, num_classes, learning_rate=2e-4):
super().__init__()
# log hyperparameters
self.save_hyperparameters()
self.learning_rate = learning_rate
self.conv1 = nn.Conv2d(3, 32, 3, 1)
self.conv2 = nn.Conv2d(32, 32, 3, 1)
self.conv3 = nn.Conv2d(32, 64, 3, 1)
self.conv4 = nn.Conv2d(64, 64, 3, 1)
self.pool1 = torch.nn.MaxPool2d(2)
self.pool2 = torch.nn.MaxPool2d(2)
n_sizes = self._get_conv_output(input_shape)
self.fc1 = nn.Linear(n_sizes, 512)
self.fc2 = nn.Linear(512, 128)
self.fc3 = nn.Linear(128, num_classes)
self.accuracy = Accuracy(task='multiclass', num_classes=num_classes)
# returns the size of the output tensor going into Linear layer from the conv block.
def _get_conv_output(self, shape):
batch_size = 1
input = torch.autograd.Variable(torch.rand(batch_size, *shape))
output_feat = self._forward_features(input)
n_size = output_feat.data.view(batch_size, -1).size(1)
return n_size
# returns the feature tensor from the conv block
def _forward_features(self, x):
x = F.relu(self.conv1(x))
x = self.pool1(F.relu(self.conv2(x)))
x = F.relu(self.conv3(x))
x = self.pool2(F.relu(self.conv4(x)))
return x
# will be used during inference
def forward(self, x):
x = self._forward_features(x)
x = x.view(x.size(0), -1)
x = F.relu(self.fc1(x))
x = F.relu(self.fc2(x))
x = F.log_softmax(self.fc3(x), dim=1)
return x
def training_step(self, batch, batch_idx):
x, y = batch
logits = self(x)
loss = F.nll_loss(logits, y)
# training metrics
preds = torch.argmax(logits, dim=1)
acc = self.accuracy(preds, y)
self.log('train_loss', loss, on_step=True, on_epoch=True, logger=True)
self.log('train_acc', acc, on_step=True, on_epoch=True, logger=True)
return loss
def validation_step(self, batch, batch_idx):
x, y = batch
logits = self(x)
loss = F.nll_loss(logits, y)
# validation metrics
preds = torch.argmax(logits, dim=1)
acc = self.accuracy(preds, y)
self.log('val_loss', loss, prog_bar=True)
self.log('val_acc', acc, prog_bar=True)
return loss
def test_step(self, batch, batch_idx):
x, y = batch
logits = self(x)
loss = F.nll_loss(logits, y)
# validation metrics
preds = torch.argmax(logits, dim=1)
acc = self.accuracy(preds, y)
self.log('test_loss', loss, prog_bar=True)
self.log('test_acc', acc, prog_bar=True)
return loss
def configure_optimizers(self):
optimizer = torch.optim.Adam(self.parameters(), lr=self.learning_rate)
return optimizer
```
## Train and Evaluate
Now that we have organized our data pipeline using `DataModule` and model architecture+training loop using `LightningModule`, the PyTorch Lightning `Trainer` automates everything else for us.
The Trainer automates:
- Epoch and batch iteration
- Calling of `optimizer.step()`, `backward`, `zero_grad()`
- Calling of `.eval()`, enabling/disabling grads
- Saving and loading weights
- Weights and Biases logging
- Multi-GPU training support
- TPU support
- 16-bit training support
```
dm = CIFAR10DataModule(batch_size=32)
# To access the x_dataloader we need to call prepare_data and setup.
dm.prepare_data()
dm.setup()
# Samples required by the custom ImagePredictionLogger callback to log image predictions.
val_samples = next(iter(dm.val_dataloader()))
val_imgs, val_labels = val_samples[0], val_samples[1]
val_imgs.shape, val_labels.shape
```
```
model = LitModel((3, 32, 32), dm.num_classes)
# Initialize wandb logger
wandb_logger = WandbLogger(project='wandb-lightning', job_type='train')
# Initialize Callbacks
early_stop_callback = pl.callbacks.EarlyStopping(monitor="val_loss")
checkpoint_callback = pl.callbacks.ModelCheckpoint()
# Initialize a trainer
trainer = pl.Trainer(max_epochs=2,
logger=wandb_logger,
callbacks=[early_stop_callback,
ImagePredictionLogger(val_samples),
checkpoint_callback],
)
# Train the model
trainer.fit(model, dm)
# Evaluate the model on the held-out test set ⚡⚡
trainer.test(dataloaders=dm.test_dataloader())
# Close wandb run
wandb.finish()
```
## Final Thoughts
I come from the TensorFlow/Keras ecosystem and find PyTorch a bit overwhelming even though it's an elegant framework. Just my personal experience though. While exploring PyTorch Lightning, I realized that almost all of the reasons that kept me away from PyTorch is taken care of. Here's a quick summary of my excitement:
- Then: Conventional PyTorch model definition used to be all over the place. With the model in some `model.py` script and the training loop in the `train.py `file. It was a lot of looking back and forth to understand the pipeline.
- Now: The `LightningModule` acts as a system where the model is defined along with the `training_step`, `validation_step`, etc. Now it's modular and shareable.
- Then: The best part about TensorFlow/Keras is the input data pipeline. Their dataset catalog is rich and growing. PyTorch's data pipeline used to be the biggest pain point. In normal PyTorch code, the data download/cleaning/preparation is usually scattered across many files.
- Now: The DataModule organizes the data pipeline into one shareable and reusable class. It's simply a collection of a `train_dataloader`, `val_dataloader`(s), `test_dataloader`(s) along with the matching transforms and data processing/downloads steps required.
- Then: With Keras, one can call `model.fit` to train the model and `model.predict` to run inference on. `model.evaluate` offered a good old simple evaluation on the test data. This is not the case with PyTorch. One will usually find separate `train.py` and `test.py` files.
- Now: With the `LightningModule` in place, the `Trainer` automates everything. One needs to just call `trainer.fit` and `trainer.test` to train and evaluate the model.
- Then: TensorFlow loves TPU, PyTorch...
- Now: With PyTorch Lightning, it's so easy to train the same model with multiple GPUs and even on TPU.
- Then: I am a big fan of Callbacks and prefer writing custom callbacks. Something as trivial as Early Stopping used to be a point of discussion with conventional PyTorch.
- Now: With PyTorch Lightning using Early Stopping and Model Checkpointing is a piece of cake. I can even write custom callbacks.
## 🎨 Conclusion and Resources
I hope you find this report helpful. I will encourage to play with the code and train an image classifier with a dataset of your choice.
Here are some resources to learn more about PyTorch Lightning:
- [Step-by-step walk-through](https://lightning.ai/docs/pytorch/latest/starter/introduction.html) - This is one of the official tutorials. Their documentation is really well written and I highly encourage it as a good learning resource.
- [Use Pytorch Lightning with Weights & Biases](https://wandb.me/lightning) - This is a quick colab that you can run through to learn more about how to use W&B with PyTorch Lightning.
# Hugging Face
{{< img src="/images/tutorials/huggingface.png" alt="" >}}
{{< cta-button colabLink="https://colab.research.google.com/github/wandb/examples/blob/master/colabs/huggingface/Huggingface_wandb.ipynb" >}}
Visualize your [Hugging Face](https://github.com/huggingface/transformers) model's performance quickly with a seamless [W&B](https://wandb.ai/site) integration.
Compare hyperparameters, output metrics, and system stats like GPU utilization across your models.
## Why should I use W&B?
{.skipvale}
{{< img src="/images/tutorials/huggingface-why.png" alt="" >}}
- **Unified dashboard**: Central repository for all your model metrics and predictions
- **Lightweight**: No code changes required to integrate with Hugging Face
- **Accessible**: Free for individuals and academic teams
- **Secure**: All projects are private by default
- **Trusted**: Used by machine learning teams at OpenAI, Toyota, Lyft and more
Think of W&B like GitHub for machine learning models— save machine learning experiments to your private, hosted dashboard. Experiment quickly with the confidence that all the versions of your models are saved for you, no matter where you're running your scripts.
W&B lightweight integrations works with any Python script, and all you need to do is sign up for a free W&B account to start tracking and visualizing your models.
In the Hugging Face Transformers repo, we've instrumented the Trainer to automatically log training and evaluation metrics to W&B at each logging step.
Here's an in depth look at how the integration works: [Hugging Face + W&B Report](https://app.wandb.ai/jxmorris12/huggingface-demo/reports/Train-a-model-with-Hugging-Face-and-Weights-%26-Biases--VmlldzoxMDE2MTU).
## Install, import, and log in
Install the Hugging Face and Weights & Biases libraries, and the GLUE dataset and training script for this tutorial.
- [Hugging Face Transformers](https://github.com/huggingface/transformers): Natural language models and datasets
- [Weights & Biases]({{< relref "/" >}}): Experiment tracking and visualization
- [GLUE dataset](https://gluebenchmark.com/): A language understanding benchmark dataset
- [GLUE script](https://raw.githubusercontent.com/huggingface/transformers/refs/heads/main/examples/pytorch/text-classification/run_glue.py): Model training script for sequence classification
```notebook
!pip install datasets wandb evaluate accelerate -qU
!wget https://raw.githubusercontent.com/huggingface/transformers/refs/heads/main/examples/pytorch/text-classification/run_glue.py
```
```notebook
# the run_glue.py script requires transformers dev
!pip install -q git+https://github.com/huggingface/transformers
```
Before continuing, [sign up for a free account](https://app.wandb.ai/login?signup=true).
## Put in your API key
Once you've signed up, run the next cell and click on the link to get your API key and authenticate this notebook.
```python
import wandb
wandb.login()
```
Optionally, we can set environment variables to customize W&B logging. See [documentation]({{< relref "/guides/integrations/huggingface/" >}}).
```python
# Optional: log both gradients and parameters
%env WANDB_WATCH=all
```
## Train the model
Next, call the downloaded training script [run_glue.py](https://huggingface.co/transformers/examples.html#glue) and see training automatically get tracked to the Weights & Biases dashboard. This script fine-tunes BERT on the Microsoft Research Paraphrase Corpus— pairs of sentences with human annotations indicating whether they are semantically equivalent.
```python
%env WANDB_PROJECT=huggingface-demo
%env TASK_NAME=MRPC
!python run_glue.py \
--model_name_or_path bert-base-uncased \
--task_name $TASK_NAME \
--do_train \
--do_eval \
--max_seq_length 256 \
--per_device_train_batch_size 32 \
--learning_rate 2e-4 \
--num_train_epochs 3 \
--output_dir /tmp/$TASK_NAME/ \
--overwrite_output_dir \
--logging_steps 50
```
## Visualize results in dashboard
Click the link printed out above, or go to [wandb.ai](https://app.wandb.ai) to see your results stream in live. The link to see your run in the browser will appear after all the dependencies are loaded. Look for the following output: "**wandb**: 🚀 View run at [URL to your unique run]"
**Visualize Model Performance**
It's easy to look across dozens of experiments, zoom in on interesting findings, and visualize highly dimensional data.
{{< img src="/images/tutorials/huggingface-visualize.gif" alt="" >}}
**Compare Architectures**
Here's an example comparing [BERT vs DistilBERT](https://app.wandb.ai/jack-morris/david-vs-goliath/reports/Does-model-size-matter%3F-Comparing-BERT-and-DistilBERT-using-Sweeps--VmlldzoxMDUxNzU). It's easy to see how different architectures effect the evaluation accuracy throughout training with automatic line plot visualizations.
{{< img src="/images/tutorials/huggingface-comparearchitectures.gif" alt="" >}}
## Track key information effortlessly by default
Weights & Biases saves a new run for each experiment. Here's the information that gets saved by default:
- **Hyperparameters**: Settings for your model are saved in Config
- **Model Metrics**: Time series data of metrics streaming in are saved in Log
- **Terminal Logs**: Command line outputs are saved and available in a tab
- **System Metrics**: GPU and CPU utilization, memory, temperature etc.
## Learn more
- [Documentation]({{< relref "/guides/integrations/huggingface" >}}): docs on the Weights & Biases and Hugging Face integration
- [Videos](http://wandb.me/youtube): tutorials, interviews with practitioners, and more on our YouTube channel
- Contact: Message us at contact@wandb.com with questions
# TensorFlow
{{< cta-button colabLink="https://colab.research.google.com/github/wandb/examples/blob/master/colabs/tensorflow/Simple_TensorFlow_Integration.ipynb" >}}
## What this notebook covers
* Easy integration of Weights and Biases with your TensorFlow pipeline for experiment tracking.
* Computing metrics with `keras.metrics`
* Using `wandb.log` to log those metrics in your custom training loop.
{{< img src="/images/tutorials/tensorflow/dashboard.png" alt="dashboard" >}}
**Note**: Sections starting with _Step_ are all you need to integrate W&B into existing code. The rest is just a standard MNIST example.
```python
import os
import matplotlib.pyplot as plt
import numpy as np
import pandas as pd
import tensorflow as tf
from tensorflow import keras
from tensorflow.keras.datasets import cifar10
```
## Install, Import, Login
### Install W&B
```jupyter
%%capture
!pip install wandb
```
### Import W&B and login
```python
import wandb
from wandb.integration.keras import WandbMetricsLogger
wandb.login()
```
> Side note: If this is your first time using W&B or you are not logged in, the link that appears after running `wandb.login()` will take you to sign-up/login page. Signing up is as easy as one click.
### Prepare Dataset
```python
# Prepare the training dataset
BATCH_SIZE = 64
(x_train, y_train), (x_test, y_test) = keras.datasets.mnist.load_data()
x_train = np.reshape(x_train, (-1, 784))
x_test = np.reshape(x_test, (-1, 784))
# build input pipeline using tf.data
train_dataset = tf.data.Dataset.from_tensor_slices((x_train, y_train))
train_dataset = train_dataset.shuffle(buffer_size=1024).batch(BATCH_SIZE)
val_dataset = tf.data.Dataset.from_tensor_slices((x_test, y_test))
val_dataset = val_dataset.batch(BATCH_SIZE)
```
## Define the Model and the Training Loop
```python
def make_model():
inputs = keras.Input(shape=(784,), name="digits")
x1 = keras.layers.Dense(64, activation="relu")(inputs)
x2 = keras.layers.Dense(64, activation="relu")(x1)
outputs = keras.layers.Dense(10, name="predictions")(x2)
return keras.Model(inputs=inputs, outputs=outputs)
```
```python
def train_step(x, y, model, optimizer, loss_fn, train_acc_metric):
with tf.GradientTape() as tape:
logits = model(x, training=True)
loss_value = loss_fn(y, logits)
grads = tape.gradient(loss_value, model.trainable_weights)
optimizer.apply_gradients(zip(grads, model.trainable_weights))
train_acc_metric.update_state(y, logits)
return loss_value
```
```python
def test_step(x, y, model, loss_fn, val_acc_metric):
val_logits = model(x, training=False)
loss_value = loss_fn(y, val_logits)
val_acc_metric.update_state(y, val_logits)
return loss_value
```
## Add `wandb.log` to your training loop
```python
def train(
train_dataset,
val_dataset,
model,
optimizer,
train_acc_metric,
val_acc_metric,
epochs=10,
log_step=200,
val_log_step=50,
):
for epoch in range(epochs):
print("\nStart of epoch %d" % (epoch,))
train_loss = []
val_loss = []
# Iterate over the batches of the dataset
for step, (x_batch_train, y_batch_train) in enumerate(train_dataset):
loss_value = train_step(
x_batch_train,
y_batch_train,
model,
optimizer,
loss_fn,
train_acc_metric,
)
train_loss.append(float(loss_value))
# Run a validation loop at the end of each epoch
for step, (x_batch_val, y_batch_val) in enumerate(val_dataset):
val_loss_value = test_step(
x_batch_val, y_batch_val, model, loss_fn, val_acc_metric
)
val_loss.append(float(val_loss_value))
# Display metrics at the end of each epoch
train_acc = train_acc_metric.result()
print("Training acc over epoch: %.4f" % (float(train_acc),))
val_acc = val_acc_metric.result()
print("Validation acc: %.4f" % (float(val_acc),))
# Reset metrics at the end of each epoch
train_acc_metric.reset_states()
val_acc_metric.reset_states()
# ⭐: log metrics using wandb.log
wandb.log(
{
"epochs": epoch,
"loss": np.mean(train_loss),
"acc": float(train_acc),
"val_loss": np.mean(val_loss),
"val_acc": float(val_acc),
}
)
```
## Run Training
### Call `wandb.init` to start a run
This lets us know you're launching an experiment,
so we can give it a unique ID and a dashboard.
[Check out the official documentation]({{< relref "/ref/python/init" >}})
```python
# initialize wandb with your project name and optionally with configuration.
# play around with the config values and see the result on your wandb dashboard.
config = {
"learning_rate": 0.001,
"epochs": 10,
"batch_size": 64,
"log_step": 200,
"val_log_step": 50,
"architecture": "CNN",
"dataset": "CIFAR-10",
}
run = wandb.init(project='my-tf-integration', config=config)
config = run.config
# Initialize model.
model = make_model()
# Instantiate an optimizer to train the model.
optimizer = keras.optimizers.SGD(learning_rate=config.learning_rate)
# Instantiate a loss function.
loss_fn = keras.losses.SparseCategoricalCrossentropy(from_logits=True)
# Prepare the metrics.
train_acc_metric = keras.metrics.SparseCategoricalAccuracy()
val_acc_metric = keras.metrics.SparseCategoricalAccuracy()
train(
train_dataset,
val_dataset,
model,
optimizer,
train_acc_metric,
val_acc_metric,
epochs=config.epochs,
log_step=config.log_step,
val_log_step=config.val_log_step,
)
run.finish() # In Jupyter/Colab, let us know you're finished!
```
### Visualize Results
Click on the [**run page**]({{< relref "/guides/models/track/runs/#view-logged-runs" >}}) link above to see your live results.
## Sweep 101
Use Weights & Biases Sweeps to automate hyperparameter optimization and explore the space of possible models.
## [Check out Hyperparameter Optimization in TensorFlow using W&B Sweeps](http://wandb.me/tf-sweeps-colab)
### Benefits of using W&B Sweeps
* **Quick setup**: With just a few lines of code you can run W&B sweeps.
* **Transparent**: We cite all the algorithms we're using, and [our code is open source](https://github.com/wandb/sweeps).
* **Powerful**: Our sweeps are completely customizable and configurable. You can launch a sweep across dozens of machines, and it's just as easy as starting a sweep on your laptop.
{{< img src="/images/tutorials/tensorflow/sweeps.png" alt="Sweep result" >}}
## Example Gallery
See examples of projects tracked and visualized with W&B in our gallery of examples, [Fully Connected →](https://wandb.me/fc)
## Best Practices
1. **Projects**: Log multiple runs to a project to compare them. `wandb.init(project="project-name")`
2. **Groups**: For multiple processes or cross validation folds, log each process as a runs and group them together. `wandb.init(group="experiment-1")`
3. **Tags**: Add tags to track your current baseline or production model.
4. **Notes**: Type notes in the table to track the changes between runs.
5. **Reports**: Take quick notes on progress to share with colleagues and make dashboards and snapshots of your ML projects.
### Advanced Setup
1. [Environment variables]({{< relref "/guides/hosting/env-vars/" >}}): Set API keys in environment variables so you can run training on a managed cluster.
2. [Offline mode]({{< relref "/support/kb-articles/run_wandb_offline.md" >}})
3. [On-prem]({{< relref "/guides/hosting/hosting-options/self-managed" >}}): Install W&B in a private cloud or air-gapped servers in your own infrastructure. We have local installations for everyone from academics to enterprise teams.
4. [Artifacts]({{< relref "/guides/core/artifacts/" >}}): Track and version models and datasets in a streamlined way that automatically picks up your pipeline steps as you train models.
# TensorFlow Sweeps
{{< cta-button colabLink="https://colab.research.google.com/github/wandb/examples/blob/master/colabs/tensorflow/Hyperparameter_Optimization_in_TensorFlow_using_W&B_Sweeps.ipynb" >}}
Use W&B for machine learning experiment tracking, dataset versioning, and project collaboration.
{{< img src="/images/tutorials/huggingface-why.png" alt="" >}}
Use W&B Sweeps to automate hyperparameter optimization and explore model possibilities with interactive dashboards:
{{< img src="/images/tutorials/tensorflow/sweeps.png" alt="" >}}
## Why use sweeps
* **Quick setup**: Run W&B sweeps with a few lines of code.
* **Transparent**: The project cites all algorithms used, and the [code is open source](https://github.com/wandb/wandb/blob/main/wandb/apis/public/sweeps.py).
* **Powerful**: Sweeps provide customization options and can run on multiple machines or a laptop with ease.
For more information, see the [Sweep documentation]({{< relref "/guides/models/sweeps/" >}}).
## What this notebook covers
* Steps to start with W&B Sweep and a custom training loop in TensorFlow.
* Finding best hyperparameters for image classification tasks.
**Note**: Sections starting with _Step_ show necessary code to perform a hyperparameter sweep. The rest sets up a simple example.
## Install, import, and log in
### Install W&B
```bash
pip install wandb
```
### Import W&B and log in
```python
import tqdm
import tensorflow as tf
from tensorflow import keras
from tensorflow.keras.datasets import cifar10
import os
import numpy as np
import pandas as pd
import matplotlib.pyplot as plt
```
```python
import wandb
from wandb.integration.keras import WandbMetricsLogger
wandb.login()
```
{{< alert >}}
If you are new to W&B or not logged in, the link after running `wandb.login()` directs to the sign-up/login page.
{{< /alert >}}
## Prepare dataset
```python
# Prepare the training dataset
(x_train, y_train), (x_test, y_test) = keras.datasets.mnist.load_data()
x_train = x_train / 255.0
x_test = x_test / 255.0
x_train = np.reshape(x_train, (-1, 784))
x_test = np.reshape(x_test, (-1, 784))
```
## Build a classifier MLP
```python
def Model():
inputs = keras.Input(shape=(784,), name="digits")
x1 = keras.layers.Dense(64, activation="relu")(inputs)
x2 = keras.layers.Dense(64, activation="relu")(x1)
outputs = keras.layers.Dense(10, name="predictions")(x2)
return keras.Model(inputs=inputs, outputs=outputs)
def train_step(x, y, model, optimizer, loss_fn, train_acc_metric):
with tf.GradientTape() as tape:
logits = model(x, training=True)
loss_value = loss_fn(y, logits)
grads = tape.gradient(loss_value, model.trainable_weights)
optimizer.apply_gradients(zip(grads, model.trainable_weights))
train_acc_metric.update_state(y, logits)
return loss_value
def test_step(x, y, model, loss_fn, val_acc_metric):
val_logits = model(x, training=False)
loss_value = loss_fn(y, val_logits)
val_acc_metric.update_state(y, val_logits)
return loss_value
```
## Write a training loop
```python
def train(
train_dataset,
val_dataset,
model,
optimizer,
loss_fn,
train_acc_metric,
val_acc_metric,
epochs=10,
log_step=200,
val_log_step=50,
):
for epoch in range(epochs):
print("\nStart of epoch %d" % (epoch,))
train_loss = []
val_loss = []
# Iterate over the batches of the dataset
for step, (x_batch_train, y_batch_train) in tqdm.tqdm(
enumerate(train_dataset), total=len(train_dataset)
):
loss_value = train_step(
x_batch_train,
y_batch_train,
model,
optimizer,
loss_fn,
train_acc_metric,
)
train_loss.append(float(loss_value))
# Run a validation loop at the end of each epoch
for step, (x_batch_val, y_batch_val) in enumerate(val_dataset):
val_loss_value = test_step(
x_batch_val, y_batch_val, model, loss_fn, val_acc_metric
)
val_loss.append(float(val_loss_value))
# Display metrics at the end of each epoch
train_acc = train_acc_metric.result()
print("Training acc over epoch: %.4f" % (float(train_acc),))
val_acc = val_acc_metric.result()
print("Validation acc: %.4f" % (float(val_acc),))
# Reset metrics at the end of each epoch
train_acc_metric.reset_states()
val_acc_metric.reset_states()
# 3️⃣ log metrics using wandb.log
wandb.log(
{
"epochs": epoch,
"loss": np.mean(train_loss),
"acc": float(train_acc),
"val_loss": np.mean(val_loss),
"val_acc": float(val_acc),
}
)
```
## Configure the sweep
Steps to configure the sweep:
* Define the hyperparameters to optimize
* Choose the optimization method: `random`, `grid`, or `bayes`
* Set a goal and metric for `bayes`, like minimizing `val_loss`
* Use `hyperband` for early termination of performing runs
See more in the [W&B Sweeps documentation]({{< relref "/guides/models/sweeps/define-sweep-configuration" >}}).
```python
sweep_config = {
"method": "random",
"metric": {"name": "val_loss", "goal": "minimize"},
"early_terminate": {"type": "hyperband", "min_iter": 5},
"parameters": {
"batch_size": {"values": [32, 64, 128, 256]},
"learning_rate": {"values": [0.01, 0.005, 0.001, 0.0005, 0.0001]},
},
}
```
## Wrap the training loop
Create a function, like `sweep_train`,
which uses `wandb.config` to set hyperparameters before calling `train`.
```python
def sweep_train(config_defaults=None):
# Set default values
config_defaults = {"batch_size": 64, "learning_rate": 0.01}
# Initialize wandb with a sample project name
wandb.init(config=config_defaults) # this gets over-written in the Sweep
# Specify the other hyperparameters to the configuration, if any
wandb.config.epochs = 2
wandb.config.log_step = 20
wandb.config.val_log_step = 50
wandb.config.architecture_name = "MLP"
wandb.config.dataset_name = "MNIST"
# build input pipeline using tf.data
train_dataset = tf.data.Dataset.from_tensor_slices((x_train, y_train))
train_dataset = (
train_dataset.shuffle(buffer_size=1024)
.batch(wandb.config.batch_size)
.prefetch(buffer_size=tf.data.AUTOTUNE)
)
val_dataset = tf.data.Dataset.from_tensor_slices((x_test, y_test))
val_dataset = val_dataset.batch(wandb.config.batch_size).prefetch(
buffer_size=tf.data.AUTOTUNE
)
# initialize model
model = Model()
# Instantiate an optimizer to train the model.
optimizer = keras.optimizers.SGD(learning_rate=wandb.config.learning_rate)
# Instantiate a loss function.
loss_fn = keras.losses.SparseCategoricalCrossentropy(from_logits=True)
# Prepare the metrics.
train_acc_metric = keras.metrics.SparseCategoricalAccuracy()
val_acc_metric = keras.metrics.SparseCategoricalAccuracy()
train(
train_dataset,
val_dataset,
model,
optimizer,
loss_fn,
train_acc_metric,
val_acc_metric,
epochs=wandb.config.epochs,
log_step=wandb.config.log_step,
val_log_step=wandb.config.val_log_step,
)
```
## Initialize sweep and run personal digital assistant
```python
sweep_id = wandb.sweep(sweep_config, project="sweeps-tensorflow")
```
Limit the number of runs with the `count` parameter. Set to 10 for quick execution. Increase as needed.
```python
wandb.agent(sweep_id, function=sweep_train, count=10)
```
## Visualize results
Click on the **Sweep URL** link preceding to view live results.
## Example gallery
Explore projects tracked and visualized with W&B in the [Gallery](https://app.wandb.ai/gallery).
## Best practices
1. **Projects**: Log multiple runs to a project to compare them. `wandb.init(project="project-name")`
2. **Groups**: Log each process as a run for multiple processes or cross-validation folds, and group them. `wandb.init(group='experiment-1')`
3. **Tags**: Use tags to track your baseline or production model.
4. **Notes**: Enter notes in the table to track changes between runs.
5. **Reports**: Use reports for progress notes, sharing with colleagues, and creating ML project dashboards and snapshots.
## Advanced setup
1. [Environment variables]({{< relref "/guides/hosting/env-vars/" >}}): Set API keys for training on a managed cluster.
2. [Offline mode]({{< relref "/support/kb-articles/run_wandb_offline.md" >}})
3. [On-prem]({{< relref "/guides/hosting/hosting-options/self-managed" >}}): Install W&B in a private cloud or air-gapped servers in your infrastructure. Local installations suit academics and enterprise teams.
# 3D brain tumor segmentation with MONAI
{{< cta-button colabLink="https://colab.research.google.com/github/wandb/examples/blob/master/colabs/monai/3d_brain_tumor_segmentation.ipynb" >}}
This tutorial demonstrates how to construct a training workflow of multi-labels 3D brain tumor segmentation task using [MONAI](https://github.com/Project-MONAI/MONAI) and use experiment tracking and data visualization features of [Weights & Biases](https://wandb.ai/site). The tutorial contains the following features:
1. Initialize a Weights & Biases run and synchronize all configs associated with the run for reproducibility.
2. MONAI transform API:
1. MONAI Transforms for dictionary format data.
2. How to define a new transform according to MONAI `transforms` API.
3. How to randomly adjust intensity for data augmentation.
3. Data Loading and Visualization:
1. Load `Nifti` image with metadata, load a list of images and stack them.
2. Cache IO and transforms to accelerate training and validation.
3. Visualize the data using `wandb.Table` and interactive segmentation overlay on Weights & Biases.
4. Training a 3D `SegResNet` model
1. Using the `networks`, `losses`, and `metrics` APIs from MONAI.
2. Training the 3D `SegResNet` model using a PyTorch training loop.
3. Track the training experiment using Weights & Biases.
4. Log and version model checkpoints as model artifacts on Weights & Biases.
5. Visualize and compare the predictions on the validation dataset using `wandb.Table` and interactive segmentation overlay on Weights & Biases.
## Setup and Installation
First, install the latest version of both MONAI and Weights and Biases.
```python
!python -c "import monai" || pip install -q -U "monai[nibabel, tqdm]"
!python -c "import wandb" || pip install -q -U wandb
```
```python
import os
import numpy as np
from tqdm.auto import tqdm
import wandb
from monai.apps import DecathlonDataset
from monai.data import DataLoader, decollate_batch
from monai.losses import DiceLoss
from monai.inferers import sliding_window_inference
from monai.metrics import DiceMetric
from monai.networks.nets import SegResNet
from monai.transforms import (
Activations,
AsDiscrete,
Compose,
LoadImaged,
MapTransform,
NormalizeIntensityd,
Orientationd,
RandFlipd,
RandScaleIntensityd,
RandShiftIntensityd,
RandSpatialCropd,
Spacingd,
EnsureTyped,
EnsureChannelFirstd,
)
from monai.utils import set_determinism
import torch
```
Then, authenticate the Colab instance to use W&B.
```python
wandb.login()
```
## Initialize a W&B Run
Start a new W&B run to start tracking the experiment.
```python
wandb.init(project="monai-brain-tumor-segmentation")
```
Use of proper config system is a recommended best practice for reproducible machine learning. You can track the hyperparameters for every experiment using W&B.
```python
config = wandb.config
config.seed = 0
config.roi_size = [224, 224, 144]
config.batch_size = 1
config.num_workers = 4
config.max_train_images_visualized = 20
config.max_val_images_visualized = 20
config.dice_loss_smoothen_numerator = 0
config.dice_loss_smoothen_denominator = 1e-5
config.dice_loss_squared_prediction = True
config.dice_loss_target_onehot = False
config.dice_loss_apply_sigmoid = True
config.initial_learning_rate = 1e-4
config.weight_decay = 1e-5
config.max_train_epochs = 50
config.validation_intervals = 1
config.dataset_dir = "./dataset/"
config.checkpoint_dir = "./checkpoints"
config.inference_roi_size = (128, 128, 64)
config.max_prediction_images_visualized = 20
```
You also need to set the random seed for modules to enable or turn off deterministic training.
```python
set_determinism(seed=config.seed)
# Create directories
os.makedirs(config.dataset_dir, exist_ok=True)
os.makedirs(config.checkpoint_dir, exist_ok=True)
```
## Data Loading and Transformation
Here, use the `monai.transforms` API to create a custom transform that converts the multi-classes labels into multi-labels segmentation task in one-hot format.
```python
class ConvertToMultiChannelBasedOnBratsClassesd(MapTransform):
"""
Convert labels to multi channels based on brats classes:
label 1 is the peritumoral edema
label 2 is the GD-enhancing tumor
label 3 is the necrotic and non-enhancing tumor core
The possible classes are TC (Tumor core), WT (Whole tumor)
and ET (Enhancing tumor).
Reference: https://github.com/Project-MONAI/tutorials/blob/main/3d_segmentation/brats_segmentation_3d.ipynb
"""
def __call__(self, data):
d = dict(data)
for key in self.keys:
result = []
# merge label 2 and label 3 to construct TC
result.append(torch.logical_or(d[key] == 2, d[key] == 3))
# merge labels 1, 2 and 3 to construct WT
result.append(
torch.logical_or(
torch.logical_or(d[key] == 2, d[key] == 3), d[key] == 1
)
)
# label 2 is ET
result.append(d[key] == 2)
d[key] = torch.stack(result, axis=0).float()
return d
```
Next, set up transforms for training and validation datasets respectively.
```python
train_transform = Compose(
[
# load 4 Nifti images and stack them together
LoadImaged(keys=["image", "label"]),
EnsureChannelFirstd(keys="image"),
EnsureTyped(keys=["image", "label"]),
ConvertToMultiChannelBasedOnBratsClassesd(keys="label"),
Orientationd(keys=["image", "label"], axcodes="RAS"),
Spacingd(
keys=["image", "label"],
pixdim=(1.0, 1.0, 1.0),
mode=("bilinear", "nearest"),
),
RandSpatialCropd(
keys=["image", "label"], roi_size=config.roi_size, random_size=False
),
RandFlipd(keys=["image", "label"], prob=0.5, spatial_axis=0),
RandFlipd(keys=["image", "label"], prob=0.5, spatial_axis=1),
RandFlipd(keys=["image", "label"], prob=0.5, spatial_axis=2),
NormalizeIntensityd(keys="image", nonzero=True, channel_wise=True),
RandScaleIntensityd(keys="image", factors=0.1, prob=1.0),
RandShiftIntensityd(keys="image", offsets=0.1, prob=1.0),
]
)
val_transform = Compose(
[
LoadImaged(keys=["image", "label"]),
EnsureChannelFirstd(keys="image"),
EnsureTyped(keys=["image", "label"]),
ConvertToMultiChannelBasedOnBratsClassesd(keys="label"),
Orientationd(keys=["image", "label"], axcodes="RAS"),
Spacingd(
keys=["image", "label"],
pixdim=(1.0, 1.0, 1.0),
mode=("bilinear", "nearest"),
),
NormalizeIntensityd(keys="image", nonzero=True, channel_wise=True),
]
)
```
### The Dataset
The dataset used for this experiment comes from http://medicaldecathlon.com/. It uses multi-modal multi-site MRI data (FLAIR, T1w, T1gd, T2w) to segment Gliomas, necrotic/active tumour, and oedema. The dataset consists of 750 4D volumes (484 Training + 266 Testing).
Use the `DecathlonDataset` to automatically download and extract the dataset. It inherits MONAI `CacheDataset` which enables you to set `cache_num=N` to cache `N` items for training and use the default arguments to cache all the items for validation, depending on your memory size.
```python
train_dataset = DecathlonDataset(
root_dir=config.dataset_dir,
task="Task01_BrainTumour",
transform=val_transform,
section="training",
download=True,
cache_rate=0.0,
num_workers=4,
)
val_dataset = DecathlonDataset(
root_dir=config.dataset_dir,
task="Task01_BrainTumour",
transform=val_transform,
section="validation",
download=False,
cache_rate=0.0,
num_workers=4,
)
```
{{% alert %}}
**Note:** Instead of applying the `train_transform` to the `train_dataset`, apply `val_transform` to both the training and validation datasets. This is because, before training, you would be visualizing samples from both the splits of the dataset.
{{% /alert %}}
### Visualizing the Dataset
Weights & Biases supports images, video, audio, and more. You can log rich media to explore your results and visually compare our runs, models, and datasets. Use the [segmentation mask overlay system]({{< relref "/guides/models/track/log/media/#image-overlays-in-tables" >}}) to visualize our data volumes. To log segmentation masks in [tables]({{< relref "/guides/models/tables/" >}}), you must provide a `wandb.Image` object for each row in the table.
An example is provided in the pseudocode below:
```python
table = wandb.Table(columns=["ID", "Image"])
for id, img, label in zip(ids, images, labels):
mask_img = wandb.Image(
img,
masks={
"prediction": {"mask_data": label, "class_labels": class_labels}
# ...
},
)
table.add_data(id, img)
wandb.log({"Table": table})
```
Now write a simple utility function that takes a sample image, label, `wandb.Table` object and some associated metadata and populate the rows of a table that would be logged to the Weights & Biases dashboard.
```python
def log_data_samples_into_tables(
sample_image: np.array,
sample_label: np.array,
split: str = None,
data_idx: int = None,
table: wandb.Table = None,
):
num_channels, _, _, num_slices = sample_image.shape
with tqdm(total=num_slices, leave=False) as progress_bar:
for slice_idx in range(num_slices):
ground_truth_wandb_images = []
for channel_idx in range(num_channels):
ground_truth_wandb_images.append(
masks = {
"ground-truth/Tumor-Core": {
"mask_data": sample_label[0, :, :, slice_idx],
"class_labels": {0: "background", 1: "Tumor Core"},
},
"ground-truth/Whole-Tumor": {
"mask_data": sample_label[1, :, :, slice_idx] * 2,
"class_labels": {0: "background", 2: "Whole Tumor"},
},
"ground-truth/Enhancing-Tumor": {
"mask_data": sample_label[2, :, :, slice_idx] * 3,
"class_labels": {0: "background", 3: "Enhancing Tumor"},
},
}
wandb.Image(
sample_image[channel_idx, :, :, slice_idx],
masks=masks,
)
)
table.add_data(split, data_idx, slice_idx, *ground_truth_wandb_images)
progress_bar.update(1)
return table
```
Next, define the `wandb.Table` object and what columns it consists of so that it can populate with the data visualizations.
```python
table = wandb.Table(
columns=[
"Split",
"Data Index",
"Slice Index",
"Image-Channel-0",
"Image-Channel-1",
"Image-Channel-2",
"Image-Channel-3",
]
)
```
Then, loop over the `train_dataset` and `val_dataset` respectively to generate the visualizations for the data samples and populate the rows of the table which to log to the dashboard.
```python
# Generate visualizations for train_dataset
max_samples = (
min(config.max_train_images_visualized, len(train_dataset))
if config.max_train_images_visualized > 0
else len(train_dataset)
)
progress_bar = tqdm(
enumerate(train_dataset[:max_samples]),
total=max_samples,
desc="Generating Train Dataset Visualizations:",
)
for data_idx, sample in progress_bar:
sample_image = sample["image"].detach().cpu().numpy()
sample_label = sample["label"].detach().cpu().numpy()
table = log_data_samples_into_tables(
sample_image,
sample_label,
split="train",
data_idx=data_idx,
table=table,
)
# Generate visualizations for val_dataset
max_samples = (
min(config.max_val_images_visualized, len(val_dataset))
if config.max_val_images_visualized > 0
else len(val_dataset)
)
progress_bar = tqdm(
enumerate(val_dataset[:max_samples]),
total=max_samples,
desc="Generating Validation Dataset Visualizations:",
)
for data_idx, sample in progress_bar:
sample_image = sample["image"].detach().cpu().numpy()
sample_label = sample["label"].detach().cpu().numpy()
table = log_data_samples_into_tables(
sample_image,
sample_label,
split="val",
data_idx=data_idx,
table=table,
)
# Log the table to your dashboard
wandb.log({"Tumor-Segmentation-Data": table})
```
The data appears on the W&B dashboard in an interactive tabular format. We can see each channel of a particular slice from a data volume overlaid with the respective segmentation mask in each row. You can write [Weave queries]({{< relref "/guides/weave" >}}) to filter the data on the table and focus on one particular row.
| {{< img src="/images/tutorials/monai/viz-1.gif" alt="An example of logged table data." >}} |
|:--:|
| **An example of logged table data.** |
Open an image and see how you can interact with each of the segmentation masks using the interactive overlay.
| {{< img src="/images/tutorials/monai/viz-2.gif" alt="An example of visualized segmentation maps." >}} |
|:--:|
| **An example of visualized segmentation maps.* |
{{% alert %}}
**Note:** The labels in the dataset consist of non-overlapping masks across classes. The overlay logs the labels as separate masks in the overlay.
{{% /alert %}}
### Loading the Data
Create the PyTorch DataLoaders for loading the data from the datasets. Before creating the DataLoaders, set the `transform` for `train_dataset` to `train_transform` to pre-process and transform the data for training.
```python
# apply train_transforms to the training dataset
train_dataset.transform = train_transform
# create the train_loader
train_loader = DataLoader(
train_dataset,
batch_size=config.batch_size,
shuffle=True,
num_workers=config.num_workers,
)
# create the val_loader
val_loader = DataLoader(
val_dataset,
batch_size=config.batch_size,
shuffle=False,
num_workers=config.num_workers,
)
```
## Creating the Model, Loss, and Optimizer
This tutorial crates a `SegResNet` model based on the paper [3D MRI brain tumor segmentation using auto-encoder regularization](https://arxiv.org/pdf/1810.11654.pdf). The `SegResNet` model that comes implemented as a PyTorch Module as part of the `monai.networks` API as well as an optimizer and learning rate scheduler.
```python
device = torch.device("cuda:0")
# create model
model = SegResNet(
blocks_down=[1, 2, 2, 4],
blocks_up=[1, 1, 1],
init_filters=16,
in_channels=4,
out_channels=3,
dropout_prob=0.2,
).to(device)
# create optimizer
optimizer = torch.optim.Adam(
model.parameters(),
config.initial_learning_rate,
weight_decay=config.weight_decay,
)
# create learning rate scheduler
lr_scheduler = torch.optim.lr_scheduler.CosineAnnealingLR(
optimizer, T_max=config.max_train_epochs
)
```
Define the loss as multi-label `DiceLoss` using the `monai.losses` API and the corresponding dice metrics using the `monai.metrics` API.
```python
loss_function = DiceLoss(
smooth_nr=config.dice_loss_smoothen_numerator,
smooth_dr=config.dice_loss_smoothen_denominator,
squared_pred=config.dice_loss_squared_prediction,
to_onehot_y=config.dice_loss_target_onehot,
sigmoid=config.dice_loss_apply_sigmoid,
)
dice_metric = DiceMetric(include_background=True, reduction="mean")
dice_metric_batch = DiceMetric(include_background=True, reduction="mean_batch")
post_trans = Compose([Activations(sigmoid=True), AsDiscrete(threshold=0.5)])
# use automatic mixed-precision to accelerate training
scaler = torch.cuda.amp.GradScaler()
torch.backends.cudnn.benchmark = True
```
Define a small utility for mixed-precision inference. This will be useful during the validation step of the training process and when you want to run the model after training.
```python
def inference(model, input):
def _compute(input):
return sliding_window_inference(
inputs=input,
roi_size=(240, 240, 160),
sw_batch_size=1,
predictor=model,
overlap=0.5,
)
with torch.cuda.amp.autocast():
return _compute(input)
```
## Training and Validation
Before training, define the metric properties which will later be logged with `wandb.log()` for tracking the training and validation experiments.
```python
wandb.define_metric("epoch/epoch_step")
wandb.define_metric("epoch/*", step_metric="epoch/epoch_step")
wandb.define_metric("batch/batch_step")
wandb.define_metric("batch/*", step_metric="batch/batch_step")
wandb.define_metric("validation/validation_step")
wandb.define_metric("validation/*", step_metric="validation/validation_step")
batch_step = 0
validation_step = 0
metric_values = []
metric_values_tumor_core = []
metric_values_whole_tumor = []
metric_values_enhanced_tumor = []
```
### Execute Standard PyTorch Training Loop
```python
# Define a W&B Artifact object
artifact = wandb.Artifact(
name=f"{wandb.run.id}-checkpoint", type="model"
)
epoch_progress_bar = tqdm(range(config.max_train_epochs), desc="Training:")
for epoch in epoch_progress_bar:
model.train()
epoch_loss = 0
total_batch_steps = len(train_dataset) // train_loader.batch_size
batch_progress_bar = tqdm(train_loader, total=total_batch_steps, leave=False)
# Training Step
for batch_data in batch_progress_bar:
inputs, labels = (
batch_data["image"].to(device),
batch_data["label"].to(device),
)
optimizer.zero_grad()
with torch.cuda.amp.autocast():
outputs = model(inputs)
loss = loss_function(outputs, labels)
scaler.scale(loss).backward()
scaler.step(optimizer)
scaler.update()
epoch_loss += loss.item()
batch_progress_bar.set_description(f"train_loss: {loss.item():.4f}:")
## Log batch-wise training loss to W&B
wandb.log({"batch/batch_step": batch_step, "batch/train_loss": loss.item()})
batch_step += 1
lr_scheduler.step()
epoch_loss /= total_batch_steps
## Log batch-wise training loss and learning rate to W&B
wandb.log(
{
"epoch/epoch_step": epoch,
"epoch/mean_train_loss": epoch_loss,
"epoch/learning_rate": lr_scheduler.get_last_lr()[0],
}
)
epoch_progress_bar.set_description(f"Training: train_loss: {epoch_loss:.4f}:")
# Validation and model checkpointing step
if (epoch + 1) % config.validation_intervals == 0:
model.eval()
with torch.no_grad():
for val_data in val_loader:
val_inputs, val_labels = (
val_data["image"].to(device),
val_data["label"].to(device),
)
val_outputs = inference(model, val_inputs)
val_outputs = [post_trans(i) for i in decollate_batch(val_outputs)]
dice_metric(y_pred=val_outputs, y=val_labels)
dice_metric_batch(y_pred=val_outputs, y=val_labels)
metric_values.append(dice_metric.aggregate().item())
metric_batch = dice_metric_batch.aggregate()
metric_values_tumor_core.append(metric_batch[0].item())
metric_values_whole_tumor.append(metric_batch[1].item())
metric_values_enhanced_tumor.append(metric_batch[2].item())
dice_metric.reset()
dice_metric_batch.reset()
checkpoint_path = os.path.join(config.checkpoint_dir, "model.pth")
torch.save(model.state_dict(), checkpoint_path)
# Log and versison model checkpoints using W&B artifacts.
artifact.add_file(local_path=checkpoint_path)
wandb.log_artifact(artifact, aliases=[f"epoch_{epoch}"])
# Log validation metrics to W&B dashboard.
wandb.log(
{
"validation/validation_step": validation_step,
"validation/mean_dice": metric_values[-1],
"validation/mean_dice_tumor_core": metric_values_tumor_core[-1],
"validation/mean_dice_whole_tumor": metric_values_whole_tumor[-1],
"validation/mean_dice_enhanced_tumor": metric_values_enhanced_tumor[-1],
}
)
validation_step += 1
# Wait for this artifact to finish logging
artifact.wait()
```
Instrumenting the code with `wandb.log` not only enables tracking all metrics associated with the training and validation process, but also logs all system metrics (our CPU and GPU in this case) on the W&B dashboard.
| {{< img src="/images/tutorials/monai/viz-3.gif" alt="An example of training and validation process tracking on W&B." >}} |
|:--:|
| **An example of training and validation process tracking on W&B.** |
Navigate to the artifacts tab in the W&B run dashboard to access the different versions of model checkpoint artifacts logged during training.
| {{< img src="/images/tutorials/monai/viz-4.gif" alt="An example of model checkpoints logging and versioning on W&B." >}} |
|:--:|
| **An example of model checkpoints logging and versioning on W&B.** |
## Inference
Using the artifacts interface, you can select which version of the artifact is the best model checkpoint, in this case, the mean epoch-wise training loss. You can also explore the entire lineage of the artifact and use the version that you need.
| {{< img src="/images/tutorials/monai/viz-5.gif" alt="An example of model artifact tracking on W&B." >}} |
|:--:|
| **An example of model artifact tracking on W&B.** |
Fetch the version of the model artifact with the best epoch-wise mean training loss and load the checkpoint state dictionary to the model.
```python
model_artifact = wandb.use_artifact(
"geekyrakshit/monai-brain-tumor-segmentation/d5ex6n4a-checkpoint:v49",
type="model",
)
model_artifact_dir = model_artifact.download()
model.load_state_dict(torch.load(os.path.join(model_artifact_dir, "model.pth")))
model.eval()
```
### Visualizing Predictions and Comparing with the Ground Truth Labels
Create another utility function to visualize the predictions of the pre-trained model and compare them with the corresponding ground-truth segmentation mask using the interactive segmentation mask overlay,.
```python
def log_predictions_into_tables(
sample_image: np.array,
sample_label: np.array,
predicted_label: np.array,
split: str = None,
data_idx: int = None,
table: wandb.Table = None,
):
num_channels, _, _, num_slices = sample_image.shape
with tqdm(total=num_slices, leave=False) as progress_bar:
for slice_idx in range(num_slices):
wandb_images = []
for channel_idx in range(num_channels):
wandb_images += [
wandb.Image(
sample_image[channel_idx, :, :, slice_idx],
masks={
"ground-truth/Tumor-Core": {
"mask_data": sample_label[0, :, :, slice_idx],
"class_labels": {0: "background", 1: "Tumor Core"},
},
"prediction/Tumor-Core": {
"mask_data": predicted_label[0, :, :, slice_idx] * 2,
"class_labels": {0: "background", 2: "Tumor Core"},
},
},
),
wandb.Image(
sample_image[channel_idx, :, :, slice_idx],
masks={
"ground-truth/Whole-Tumor": {
"mask_data": sample_label[1, :, :, slice_idx],
"class_labels": {0: "background", 1: "Whole Tumor"},
},
"prediction/Whole-Tumor": {
"mask_data": predicted_label[1, :, :, slice_idx] * 2,
"class_labels": {0: "background", 2: "Whole Tumor"},
},
},
),
wandb.Image(
sample_image[channel_idx, :, :, slice_idx],
masks={
"ground-truth/Enhancing-Tumor": {
"mask_data": sample_label[2, :, :, slice_idx],
"class_labels": {0: "background", 1: "Enhancing Tumor"},
},
"prediction/Enhancing-Tumor": {
"mask_data": predicted_label[2, :, :, slice_idx] * 2,
"class_labels": {0: "background", 2: "Enhancing Tumor"},
},
},
),
]
table.add_data(split, data_idx, slice_idx, *wandb_images)
progress_bar.update(1)
return table
```
Log the prediction results to the prediction table.
```python
# create the prediction table
prediction_table = wandb.Table(
columns=[
"Split",
"Data Index",
"Slice Index",
"Image-Channel-0/Tumor-Core",
"Image-Channel-1/Tumor-Core",
"Image-Channel-2/Tumor-Core",
"Image-Channel-3/Tumor-Core",
"Image-Channel-0/Whole-Tumor",
"Image-Channel-1/Whole-Tumor",
"Image-Channel-2/Whole-Tumor",
"Image-Channel-3/Whole-Tumor",
"Image-Channel-0/Enhancing-Tumor",
"Image-Channel-1/Enhancing-Tumor",
"Image-Channel-2/Enhancing-Tumor",
"Image-Channel-3/Enhancing-Tumor",
]
)
# Perform inference and visualization
with torch.no_grad():
config.max_prediction_images_visualized
max_samples = (
min(config.max_prediction_images_visualized, len(val_dataset))
if config.max_prediction_images_visualized > 0
else len(val_dataset)
)
progress_bar = tqdm(
enumerate(val_dataset[:max_samples]),
total=max_samples,
desc="Generating Predictions:",
)
for data_idx, sample in progress_bar:
val_input = sample["image"].unsqueeze(0).to(device)
val_output = inference(model, val_input)
val_output = post_trans(val_output[0])
prediction_table = log_predictions_into_tables(
sample_image=sample["image"].cpu().numpy(),
sample_label=sample["label"].cpu().numpy(),
predicted_label=val_output.cpu().numpy(),
data_idx=data_idx,
split="validation",
table=prediction_table,
)
wandb.log({"Predictions/Tumor-Segmentation-Data": prediction_table})
# End the experiment
wandb.finish()
```
Use the interactive segmentation mask overlay to analyze and compare the predicted segmentation masks and the ground-truth labels for each class.
| {{< img src="/images/tutorials/monai/viz-6.gif" alt="An example of predictions and ground-truth visualization on W&B." >}} |
|:--:|
| **An example of predictions and ground-truth visualization on W&B.** |
## Acknowledgements and more resources
* [MONAI Tutorial: Brain tumor 3D segmentation with MONAI](https://github.com/Project-MONAI/tutorials/blob/main/3d_segmentation/brats_segmentation_3d.ipynb)
* [WandB Report: Brain Tumor Segmentation using MONAI and WandB](https://wandb.ai/geekyrakshit/brain-tumor-segmentation/reports/Brain-Tumor-Segmentation-using-MONAI-and-WandB---Vmlldzo0MjUzODIw)
# Keras
{{< cta-button colabLink="https://colab.research.google.com/github/wandb/examples/blob/master/colabs/keras/Use_WandbMetricLogger_in_your_Keras_workflow.ipynb" >}}
Use Weights & Biases for machine learning experiment tracking, dataset versioning, and project collaboration.
{{< img src="/images/tutorials/huggingface-why.png" alt="" >}}
This Colab notebook introduces the `WandbMetricsLogger` callback. Use this callback for [Experiment Tracking]({{< relref "/guides/models/track" >}}). It will log your training and validation metrics along with system metrics to Weights and Biases.
## Setup and Installation
First, let us install the latest version of Weights and Biases. We will then authenticate this colab instance to use W&B.
```shell
pip install -qq -U wandb
```
```python
import os
import tensorflow as tf
from tensorflow.keras import layers
from tensorflow.keras import models
import tensorflow_datasets as tfds
# Weights and Biases related imports
import wandb
from wandb.integration.keras import WandbMetricsLogger
```
If this is your first time using W&B or you are not logged in, the link that appears after running `wandb.login()` will take you to sign-up/login page. Signing up for a [free account](https://wandb.ai/signup) is as easy as a few clicks.
```python
wandb.login()
```
## Hyperparameters
Use of proper config system is a recommended best practice for reproducible machine learning. We can track the hyperparameters for every experiment using W&B. In this colab we will be using simple Python `dict` as our config system.
```python
configs = dict(
num_classes=10,
shuffle_buffer=1024,
batch_size=64,
image_size=28,
image_channels=1,
earlystopping_patience=3,
learning_rate=1e-3,
epochs=10,
)
```
## Dataset
In this colab, we will be using [CIFAR100](https://www.tensorflow.org/datasets/catalog/cifar100) dataset from TensorFlow Dataset catalog. We aim to build a simple image classification pipeline using TensorFlow/Keras.
```python
train_ds, valid_ds = tfds.load("fashion_mnist", split=["train", "test"])
```
```python
AUTOTUNE = tf.data.AUTOTUNE
def parse_data(example):
# Get image
image = example["image"]
# image = tf.image.convert_image_dtype(image, dtype=tf.float32)
# Get label
label = example["label"]
label = tf.one_hot(label, depth=configs["num_classes"])
return image, label
def get_dataloader(ds, configs, dataloader_type="train"):
dataloader = ds.map(parse_data, num_parallel_calls=AUTOTUNE)
if dataloader_type == "train":
dataloader = dataloader.shuffle(configs["shuffle_buffer"])
dataloader = dataloader.batch(configs["batch_size"]).prefetch(AUTOTUNE)
return dataloader
```
```python
trainloader = get_dataloader(train_ds, configs)
validloader = get_dataloader(valid_ds, configs, dataloader_type="valid")
```
## Model
```python
def get_model(configs):
backbone = tf.keras.applications.mobilenet_v2.MobileNetV2(
weights="imagenet", include_top=False
)
backbone.trainable = False
inputs = layers.Input(
shape=(configs["image_size"], configs["image_size"], configs["image_channels"])
)
resize = layers.Resizing(32, 32)(inputs)
neck = layers.Conv2D(3, (3, 3), padding="same")(resize)
preprocess_input = tf.keras.applications.mobilenet.preprocess_input(neck)
x = backbone(preprocess_input)
x = layers.GlobalAveragePooling2D()(x)
outputs = layers.Dense(configs["num_classes"], activation="softmax")(x)
return models.Model(inputs=inputs, outputs=outputs)
```
```python
tf.keras.backend.clear_session()
model = get_model(configs)
model.summary()
```
## Compile Model
```python
model.compile(
optimizer="adam",
loss="categorical_crossentropy",
metrics=[
"accuracy",
tf.keras.metrics.TopKCategoricalAccuracy(k=5, name="top@5_accuracy"),
],
)
```
## Train
```python
# Initialize a W&B run
run = wandb.init(project="intro-keras", config=configs)
# Train your model
model.fit(
trainloader,
epochs=configs["epochs"],
validation_data=validloader,
callbacks=[
WandbMetricsLogger(log_freq=10)
], # Notice the use of WandbMetricsLogger here
)
# Close the W&B run
run.finish()
```
# Keras models
{{< cta-button colabLink="https://colab.research.google.com/github/wandb/examples/blob/master/colabs/keras/Use_WandbModelCheckpoint_in_your_Keras_workflow.ipynb" >}}
Use Weights & Biases for machine learning experiment tracking, dataset versioning, and project collaboration.
{{< img src="/images/tutorials/huggingface-why.png" alt="" >}}
This Colab notebook introduces the `WandbModelCheckpoint` callback. Use this callback to log your model checkpoints to Weight and Biases [Artifacts]({{< relref "/guides/core/artifacts/" >}}).
## Setup and Installation
First, let us install the latest version of Weights and Biases. We will then authenticate this colab instance to use W&B.
```python
!pip install -qq -U wandb
```
```python
import os
import tensorflow as tf
from tensorflow.keras import layers
from tensorflow.keras import models
import tensorflow_datasets as tfds
# Weights and Biases related imports
import wandb
from wandb.integration.keras import WandbMetricsLogger
from wandb.integration.keras import WandbModelCheckpoint
```
If this is your first time using W&B or you are not logged in, the link that appears after running `wandb.login()` will take you to sign-up/login page. Signing up for a [free account](https://wandb.ai/signup) is as easy as a few clicks.
```python
wandb.login()
```
## Hyperparameters
Use of proper config system is a recommended best practice for reproducible machine learning. We can track the hyperparameters for every experiment using W&B. In this colab we will be using simple Python `dict` as our config system.
```python
configs = dict(
num_classes = 10,
shuffle_buffer = 1024,
batch_size = 64,
image_size = 28,
image_channels = 1,
earlystopping_patience = 3,
learning_rate = 1e-3,
epochs = 10
)
```
## Dataset
In this colab, we will be using [CIFAR100](https://www.tensorflow.org/datasets/catalog/cifar100) dataset from TensorFlow Dataset catalog. We aim to build a simple image classification pipeline using TensorFlow/Keras.
```python
train_ds, valid_ds = tfds.load('fashion_mnist', split=['train', 'test'])
```
```python
AUTOTUNE = tf.data.AUTOTUNE
def parse_data(example):
# Get image
image = example["image"]
# image = tf.image.convert_image_dtype(image, dtype=tf.float32)
# Get label
label = example["label"]
label = tf.one_hot(label, depth=configs["num_classes"])
return image, label
def get_dataloader(ds, configs, dataloader_type="train"):
dataloader = ds.map(parse_data, num_parallel_calls=AUTOTUNE)
if dataloader_type=="train":
dataloader = dataloader.shuffle(configs["shuffle_buffer"])
dataloader = (
dataloader
.batch(configs["batch_size"])
.prefetch(AUTOTUNE)
)
return dataloader
```
```python
trainloader = get_dataloader(train_ds, configs)
validloader = get_dataloader(valid_ds, configs, dataloader_type="valid")
```
## Model
```python
def get_model(configs):
backbone = tf.keras.applications.mobilenet_v2.MobileNetV2(weights='imagenet', include_top=False)
backbone.trainable = False
inputs = layers.Input(shape=(configs["image_size"], configs["image_size"], configs["image_channels"]))
resize = layers.Resizing(32, 32)(inputs)
neck = layers.Conv2D(3, (3,3), padding="same")(resize)
preprocess_input = tf.keras.applications.mobilenet.preprocess_input(neck)
x = backbone(preprocess_input)
x = layers.GlobalAveragePooling2D()(x)
outputs = layers.Dense(configs["num_classes"], activation="softmax")(x)
return models.Model(inputs=inputs, outputs=outputs)
```
```python
tf.keras.backend.clear_session()
model = get_model(configs)
model.summary()
```
## Compile Model
```python
model.compile(
optimizer = "adam",
loss = "categorical_crossentropy",
metrics = ["accuracy", tf.keras.metrics.TopKCategoricalAccuracy(k=5, name='top@5_accuracy')]
)
```
## Train
```python
# Initialize a W&B run
run = wandb.init(
project = "intro-keras",
config = configs
)
# Train your model
model.fit(
trainloader,
epochs = configs["epochs"],
validation_data = validloader,
callbacks = [
WandbMetricsLogger(log_freq=10),
WandbModelCheckpoint(filepath="models/") # Notice the use of WandbModelCheckpoint here
]
)
# Close the W&B run
run.finish()
```
# Keras tables
{{< cta-button colabLink="https://colab.research.google.com/github/wandb/examples/blob/master/colabs/keras/Use_WandbEvalCallback_in_your_Keras_workflow.ipynb" >}}
Use Weights & Biases for machine learning experiment tracking, dataset versioning, and project collaboration.
{{< img src="/images/tutorials/huggingface-why.png" alt="" >}}
This Colab notebook introduces the `WandbEvalCallback` which is an abstract callback that be inherited to build useful callbacks for model prediction visualization and dataset visualization.
## Setup and Installation
First, let us install the latest version of Weights and Biases. We will then authenticate this colab instance to use W&B.
```shell
pip install -qq -U wandb
```
```python
import os
import numpy as np
import tensorflow as tf
from tensorflow.keras import layers
from tensorflow.keras import models
import tensorflow_datasets as tfds
# Weights and Biases related imports
import wandb
from wandb.integration.keras import WandbMetricsLogger
from wandb.integration.keras import WandbModelCheckpoint
from wandb.integration.keras import WandbEvalCallback
```
If this is your first time using W&B or you are not logged in, the link that appears after running `wandb.login()` will take you to sign-up/login page. Signing up for a [free account](https://wandb.ai/signup) is as easy as a few clicks.
```python
wandb.login()
```
## Hyperparameters
Use of proper config system is a recommended best practice for reproducible machine learning. We can track the hyperparameters for every experiment using W&B. In this colab we will be using simple Python `dict` as our config system.
```python
configs = dict(
num_classes=10,
shuffle_buffer=1024,
batch_size=64,
image_size=28,
image_channels=1,
earlystopping_patience=3,
learning_rate=1e-3,
epochs=10,
)
```
## Dataset
In this colab, we will be using [CIFAR100](https://www.tensorflow.org/datasets/catalog/cifar100) dataset from TensorFlow Dataset catalog. We aim to build a simple image classification pipeline using TensorFlow/Keras.
```python
train_ds, valid_ds = tfds.load("fashion_mnist", split=["train", "test"])
```
```
AUTOTUNE = tf.data.AUTOTUNE
def parse_data(example):
# Get image
image = example["image"]
# image = tf.image.convert_image_dtype(image, dtype=tf.float32)
# Get label
label = example["label"]
label = tf.one_hot(label, depth=configs["num_classes"])
return image, label
def get_dataloader(ds, configs, dataloader_type="train"):
dataloader = ds.map(parse_data, num_parallel_calls=AUTOTUNE)
if dataloader_type=="train":
dataloader = dataloader.shuffle(configs["shuffle_buffer"])
dataloader = (
dataloader
.batch(configs["batch_size"])
.prefetch(AUTOTUNE)
)
return dataloader
```
```python
trainloader = get_dataloader(train_ds, configs)
validloader = get_dataloader(valid_ds, configs, dataloader_type="valid")
```
## Model
```python
def get_model(configs):
backbone = tf.keras.applications.mobilenet_v2.MobileNetV2(
weights="imagenet", include_top=False
)
backbone.trainable = False
inputs = layers.Input(
shape=(configs["image_size"], configs["image_size"], configs["image_channels"])
)
resize = layers.Resizing(32, 32)(inputs)
neck = layers.Conv2D(3, (3, 3), padding="same")(resize)
preprocess_input = tf.keras.applications.mobilenet.preprocess_input(neck)
x = backbone(preprocess_input)
x = layers.GlobalAveragePooling2D()(x)
outputs = layers.Dense(configs["num_classes"], activation="softmax")(x)
return models.Model(inputs=inputs, outputs=outputs)
```
```python
tf.keras.backend.clear_session()
model = get_model(configs)
model.summary()
```
## Compile Model
```python
model.compile(
optimizer="adam",
loss="categorical_crossentropy",
metrics=[
"accuracy",
tf.keras.metrics.TopKCategoricalAccuracy(k=5, name="top@5_accuracy"),
],
)
```
## `WandbEvalCallback`
The `WandbEvalCallback` is an abstract base class to build Keras callbacks for primarily model prediction visualization and secondarily dataset visualization.
This is a dataset and task agnostic abstract callback. To use this, inherit from this base callback class and implement the `add_ground_truth` and `add_model_prediction` methods.
The `WandbEvalCallback` is a utility class that provides helpful methods to:
- create data and prediction `wandb.Table` instances,
- log data and prediction Tables as `wandb.Artifact`,
- logs the data table `on_train_begin`,
- logs the prediction table `on_epoch_end`.
As an example, we have implemented `WandbClfEvalCallback` below for an image classification task. This example callback:
- logs the validation data (`data_table`) to W&B,
- performs inference and logs the prediction (`pred_table`) to W&B on every epoch end.
## How the memory footprint is reduced
We log the `data_table` to W&B when the `on_train_begin` method is ivoked. Once it's uploaded as a W&B Artifact, we get a reference to this table which can be accessed using `data_table_ref` class variable. The `data_table_ref` is a 2D list that can be indexed like `self.data_table_ref[idx][n]` where `idx` is the row number while `n` is the column number. Let's see the usage in the example below.
```python
class WandbClfEvalCallback(WandbEvalCallback):
def __init__(
self, validloader, data_table_columns, pred_table_columns, num_samples=100
):
super().__init__(data_table_columns, pred_table_columns)
self.val_data = validloader.unbatch().take(num_samples)
def add_ground_truth(self, logs=None):
for idx, (image, label) in enumerate(self.val_data):
self.data_table.add_data(idx, wandb.Image(image), np.argmax(label, axis=-1))
def add_model_predictions(self, epoch, logs=None):
# Get predictions
preds = self._inference()
table_idxs = self.data_table_ref.get_index()
for idx in table_idxs:
pred = preds[idx]
self.pred_table.add_data(
epoch,
self.data_table_ref.data[idx][0],
self.data_table_ref.data[idx][1],
self.data_table_ref.data[idx][2],
pred,
)
def _inference(self):
preds = []
for image, label in self.val_data:
pred = self.model(tf.expand_dims(image, axis=0))
argmax_pred = tf.argmax(pred, axis=-1).numpy()[0]
preds.append(argmax_pred)
return preds
```
## Train
```python
# Initialize a W&B run
run = wandb.init(project="intro-keras", config=configs)
# Train your model
model.fit(
trainloader,
epochs=configs["epochs"],
validation_data=validloader,
callbacks=[
WandbMetricsLogger(log_freq=10),
WandbClfEvalCallback(
validloader,
data_table_columns=["idx", "image", "ground_truth"],
pred_table_columns=["epoch", "idx", "image", "ground_truth", "prediction"],
), # Notice the use of WandbEvalCallback here
],
)
# Close the W&B run
run.finish()
```
# XGBoost Sweeps
{{< cta-button colabLink="https://colab.research.google.com/github/wandb/examples/blob/master/colabs/boosting/Using_W&B_Sweeps_with_XGBoost.ipynb" >}}
Use Weights & Biases for machine learning experiment tracking, dataset versioning, and project collaboration.
{{< img src="/images/tutorials/huggingface-why.png" alt="" >}}
Squeezing the best performance out of tree-based models requires
[selecting the right hyperparameters](https://blog.cambridgespark.com/hyperparameter-tuning-in-xgboost-4ff9100a3b2f).
How many `early_stopping_rounds`? What should the `max_depth` of a tree be?
Searching through high dimensional hyperparameter spaces to find the most performant model can get unwieldy very fast.
Hyperparameter sweeps provide an organized and efficient way to conduct a battle royale of models and crown a winner.
They enable this by automatically searching through combinations of hyperparameter values to find the most optimal values.
In this tutorial we'll see how you can run sophisticated hyperparameter sweeps on XGBoost models in 3 easy steps using Weights and Biases.
For a teaser, check out the plots below:
{{< img src="/images/tutorials/xgboost_sweeps/sweeps_xgboost.png" alt="sweeps_xgboost" >}}
## Sweeps: An Overview
Running a hyperparameter sweep with Weights & Biases is very easy. There are just 3 simple steps:
1. **Define the sweep:** we do this by creating a dictionary-like object that specifies the sweep: which parameters to search through, which search strategy to use, which metric to optimize.
2. **Initialize the sweep:** with one line of code we initialize the sweep and pass in the dictionary of sweep configurations:
`sweep_id = wandb.sweep(sweep_config)`
3. **Run the sweep agent:** also accomplished with one line of code, we call w`andb.agent()` and pass the `sweep_id` along with a function that defines your model architecture and trains it:
`wandb.agent(sweep_id, function=train)`
That's all there is to running a hyperparameter sweep.
In the notebook below, we'll walk through these 3 steps in more detail.
We highly encourage you to fork this notebook, tweak the parameters, or try the model with your own dataset.
### Resources
- [Sweeps docs →]({{< relref "/guides/models/sweeps/" >}})
- [Launching from the command line →](https://www.wandb.com/articles/hyperparameter-tuning-as-easy-as-1-2-3)
```python
!pip install wandb -qU
```
```python
import wandb
wandb.login()
```
## 1. Define the Sweep
Weights & Biases sweeps give you powerful levers to configure your sweeps exactly how you want them, with just a few lines of code. The sweeps config can be defined as
[a dictionary or a YAML file]({{< relref "/guides/models/sweeps/define-sweep-configuration" >}}).
Let's walk through some of them together:
* **Metric**: This is the metric the sweeps are attempting to optimize. Metrics can take a `name` (this metric should be logged by your training script) and a `goal` (`maximize` or `minimize`).
* **Search Strategy**: Specified using the `"method"` key. We support several different search strategies with sweeps.
* **Grid Search**: Iterates over every combination of hyperparameter values.
* **Random Search**: Iterates over randomly chosen combinations of hyperparameter values.
* **Bayesian Search**: Creates a probabilistic model that maps hyperparameters to probability of a metric score, and chooses parameters with high probability of improving the metric. The objective of Bayesian optimization is to spend more time in picking the hyperparameter values, but in doing so trying out fewer hyperparameter values.
* **Parameters**: A dictionary containing the hyperparameter names, and discrete values, a range, or distributions from which to pull their values on each iteration.
For details, see the [list of all sweep configuration options]({{< relref "/guides/models/sweeps/define-sweep-configuration" >}}).
```python
sweep_config = {
"method": "random", # try grid or random
"metric": {
"name": "accuracy",
"goal": "maximize"
},
"parameters": {
"booster": {
"values": ["gbtree","gblinear"]
},
"max_depth": {
"values": [3, 6, 9, 12]
},
"learning_rate": {
"values": [0.1, 0.05, 0.2]
},
"subsample": {
"values": [1, 0.5, 0.3]
}
}
}
```
## 2. Initialize the Sweep
Calling `wandb.sweep` starts a Sweep Controller --
a centralized process that provides settings of the `parameters` to any who query it
and expects them to return performance on `metrics` via `wandb` logging.
```python
sweep_id = wandb.sweep(sweep_config, project="XGBoost-sweeps")
```
### Define your training process
Before we can run the sweep,
we need to define a function that creates and trains the model --
the function that takes in hyperparameter values and spits out metrics.
We'll also need `wandb` to be integrated into our script.
There's three main components:
* `wandb.init()`: Initialize a new W&B run. Each run is single execution of the training script.
* `wandb.config`: Save all your hyperparameters in a config object. This lets you use [our app](https://wandb.ai) to sort and compare your runs by hyperparameter values.
* `wandb.log()`: Logs metrics and custom objects, such as images, videos, audio files, HTML, plots, or point clouds.
We also need to download the data:
```python
!wget https://raw.githubusercontent.com/jbrownlee/Datasets/master/pima-indians-diabetes.data.csv
```
```python
# XGBoost model for Pima Indians dataset
from numpy import loadtxt
from xgboost import XGBClassifier
from sklearn.model_selection import train_test_split
from sklearn.metrics import accuracy_score
# load data
def train():
config_defaults = {
"booster": "gbtree",
"max_depth": 3,
"learning_rate": 0.1,
"subsample": 1,
"seed": 117,
"test_size": 0.33,
}
wandb.init(config=config_defaults) # defaults are over-ridden during the sweep
config = wandb.config
# load data and split into predictors and targets
dataset = loadtxt("pima-indians-diabetes.data.csv", delimiter=",")
X, Y = dataset[:, :8], dataset[:, 8]
# split data into train and test sets
X_train, X_test, y_train, y_test = train_test_split(X, Y,
test_size=config.test_size,
random_state=config.seed)
# fit model on train
model = XGBClassifier(booster=config.booster, max_depth=config.max_depth,
learning_rate=config.learning_rate, subsample=config.subsample)
model.fit(X_train, y_train)
# make predictions on test
y_pred = model.predict(X_test)
predictions = [round(value) for value in y_pred]
# evaluate predictions
accuracy = accuracy_score(y_test, predictions)
print(f"Accuracy: {accuracy:.0%}")
wandb.log({"accuracy": accuracy})
```
## 3. Run the Sweep with an agent
Now, we call `wandb.agent` to start up our sweep.
You can call `wandb.agent` on any machine where you're logged into W&B that has
- the `sweep_id`,
- the dataset and `train` function
and that machine will join the sweep.
> _Note_: a `random` sweep will by defauly run forever,
trying new parameter combinations until the cows come home --
or until you [turn the sweep off from the app UI]({{< relref "/guides/models/sweeps/sweeps-ui" >}}).
You can prevent this by providing the total `count` of runs you'd like the `agent` to complete.
```python
wandb.agent(sweep_id, train, count=25)
```
## Visualize your results
Now that your sweep is finished, it's time to look at the results.
Weights & Biases will generate a number of useful plots for you automatically.
### Parallel coordinates plot
This plot maps hyperparameter values to model metrics. It’s useful for honing in on combinations of hyperparameters that led to the best model performance.
This plot seems to indicate that using a tree as our learner slightly,
but not mind-blowingly,
outperforms using a simple linear model as our learner.
{{< img src="/images/tutorials/xgboost_sweeps/sweeps_xgboost2.png" alt="sweeps_xgboost" >}}
### Hyperparameter importance plot
The hyperparameter importance plot shows which hyperparameter values had the biggest impact
on your metrics.
We report both the correlation (treating it as a linear predictor)
and the feature importance (after training a random forest on your results)
so you can see which parameters had the biggest effect
and whether that effect was positive or negative.
Reading this chart, we see quantitative confirmation
of the trend we noticed in the parallel coordinates chart above:
the largest impact on validation accuracy came from the choice of
learner, and the `gblinear` learners were generally worse than `gbtree` learners.
{{< img src="/images/tutorials/xgboost_sweeps/sweeps_xgboost3.png" alt="sweeps_xgboost" >}}
These visualizations can help you save both time and resources running expensive hyperparameter optimizations by honing in on the parameters (and value ranges) that are the most important, and thereby worthy of further exploration.