

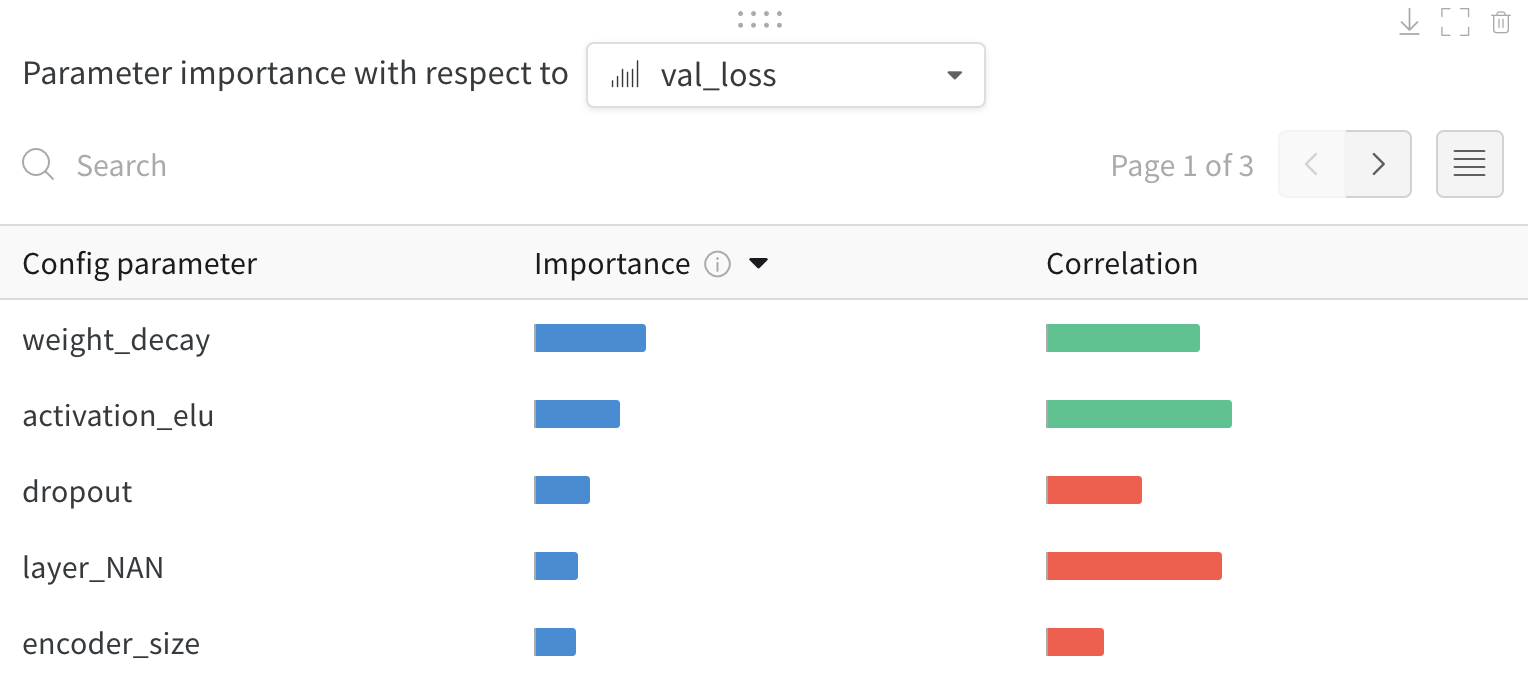
val_loss). A high correlation means that when the hyperparameter has a higher value, the metric also has higher values, and vice versa. Correlation is a useful metric, but it can’t capture second-order interactions between inputs, and it can get messy when you compare inputs with different ranges.
W&B also calculates an importance metric. W&B trains a random forest with the hyperparameters as inputs and the metric as the target output, then reports the feature importance values for the random forest.
A conversation with Jeremy Howard inspired this technique. Jeremy pioneered the use of random forest feature importances to explore hyperparameter spaces at Fast.ai. For more information about the motivation behind this analysis, see the Fast.ai lesson 4 lecture and the Fast.ai lesson 4 forum notes.
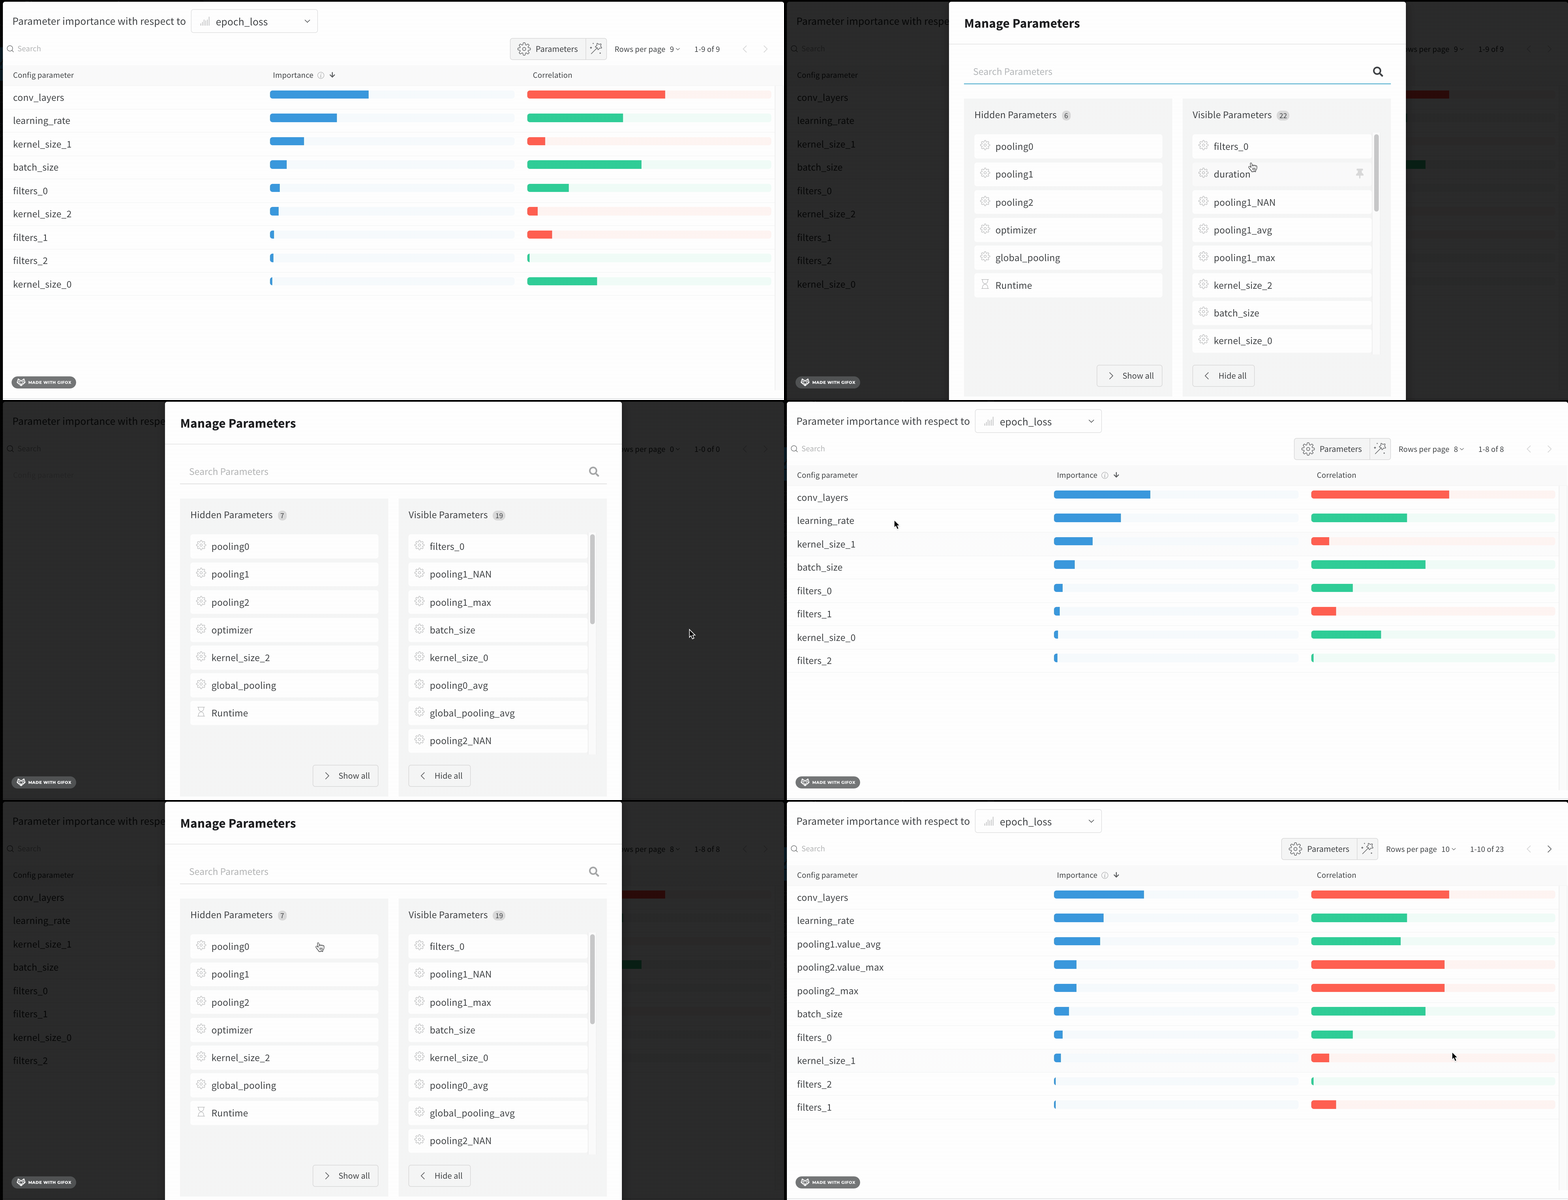
The hyperparameter importance panel untangles the complicated interactions between highly correlated hyperparameters. In doing so, it helps you fine-tune your hyperparameter searches by showing you which of your hyperparameters matter the most for predicting model performance.
Create a hyperparameter importance panel
To add a hyperparameter importance panel to your workspace:- Navigate to your W&B project.
- Select the Add panels button.
- Expand the CHARTS dropdown, then choose Parallel coordinates from the dropdown.
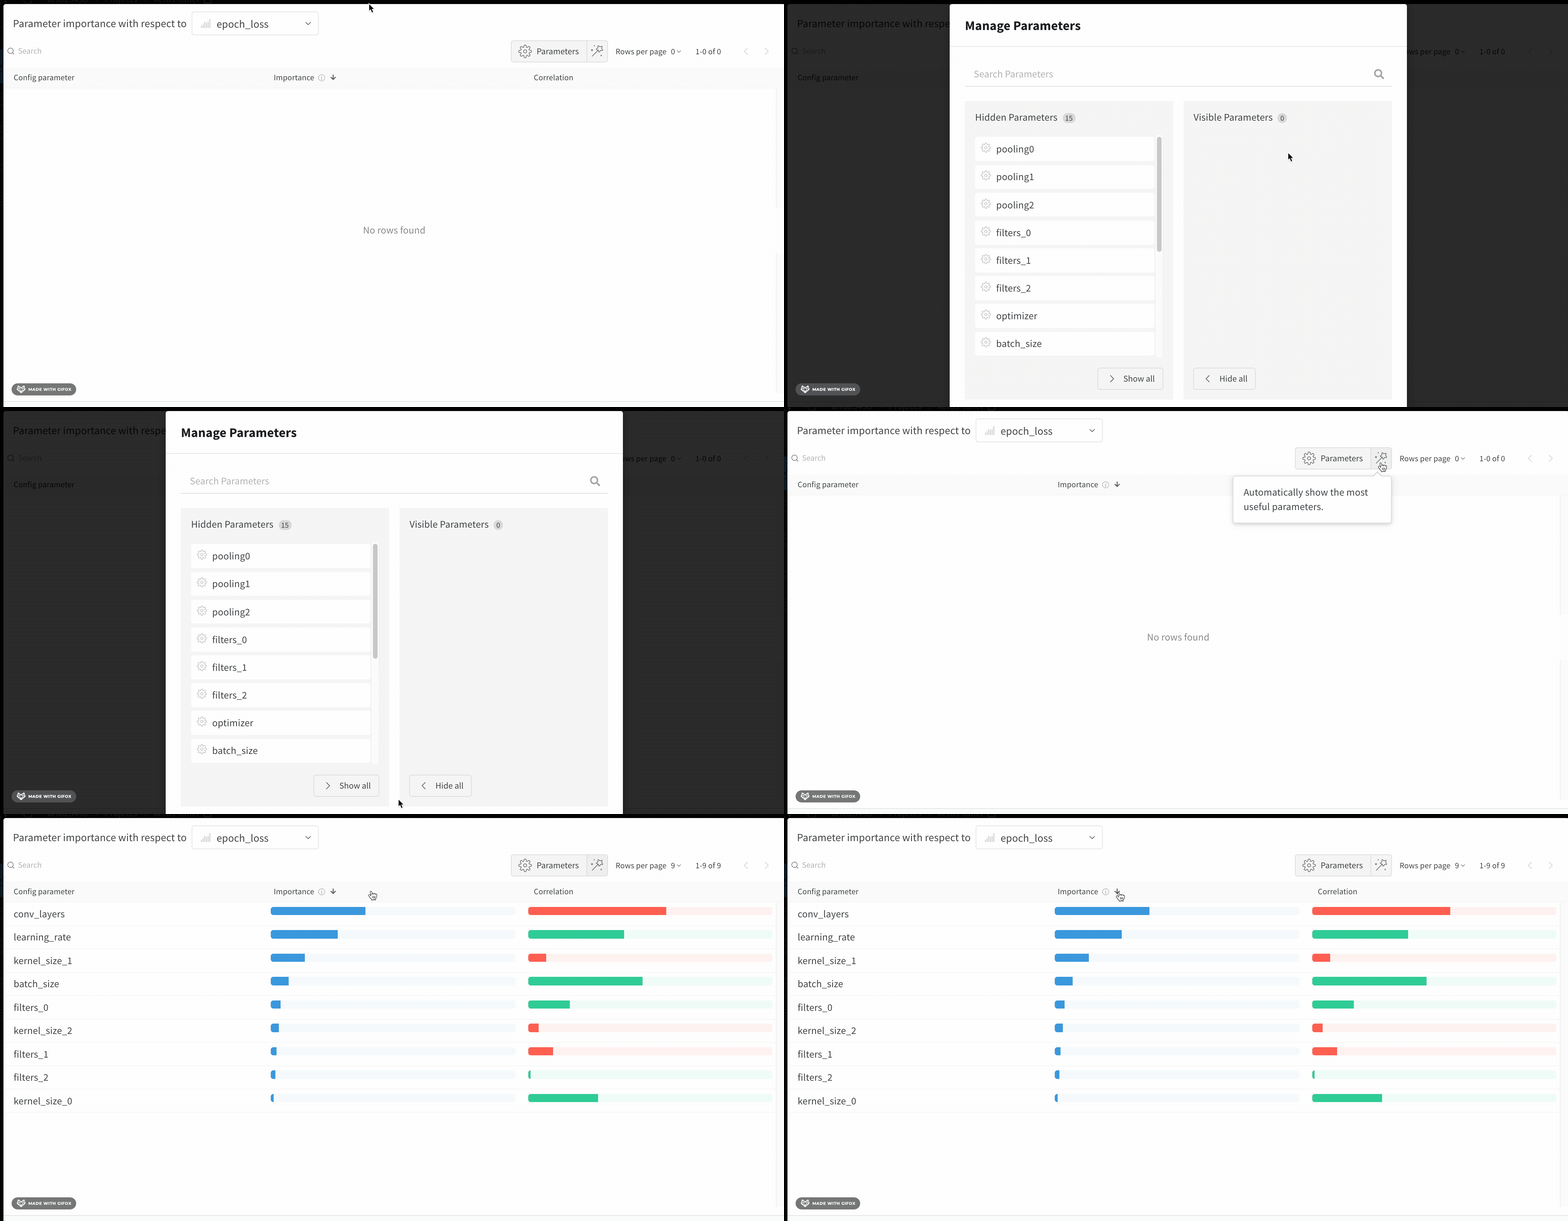
If an empty panel appears, make sure that your runs are ungrouped.
Interpret a hyperparameter importance panel
The following sections describe how to read the importance and correlation values shown in the panel so you can act on them in your next sweep.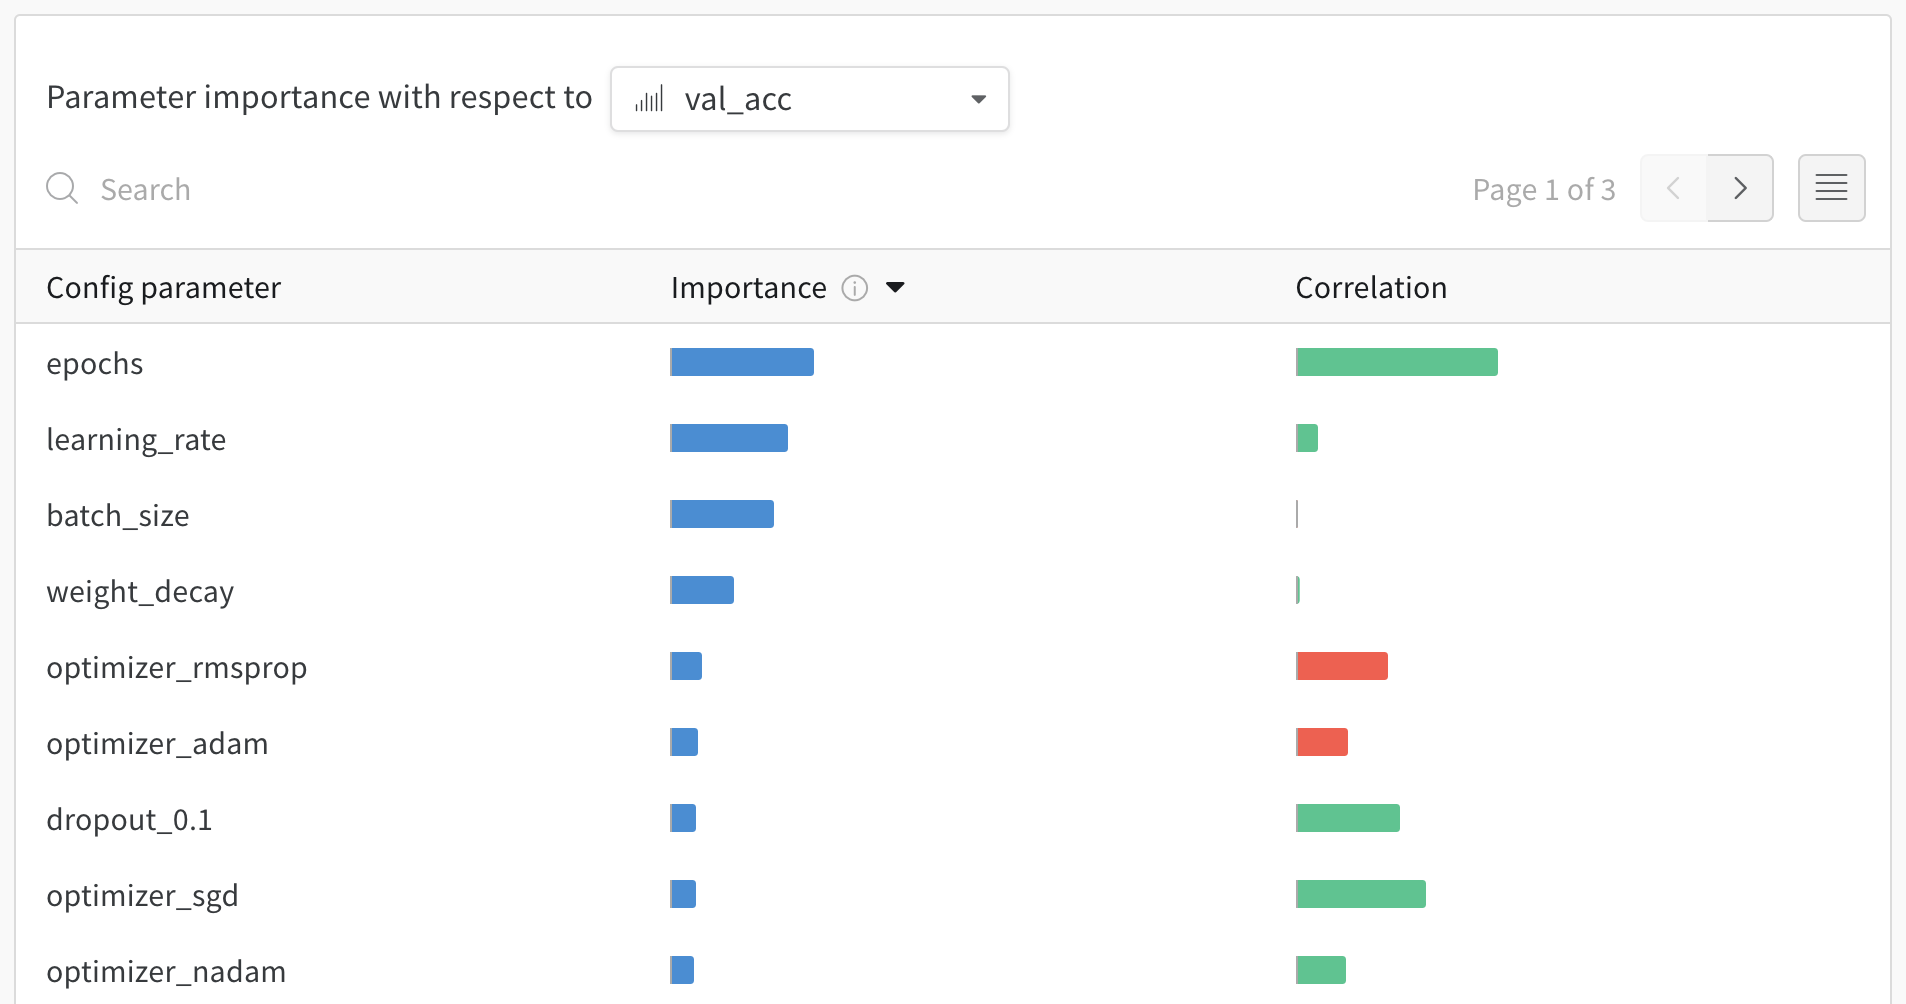
wandb.Run.config object in your training script. It also shows the feature importances and correlations of these config parameters with respect to the model metric you select (val_loss in this case).
Importance
The importance column shows you the degree to which each hyperparameter was useful in predicting the chosen metric. Imagine a scenario where you start tuning many hyperparameters and use this plot to focus on which ones merit further exploration. You can then limit subsequent sweeps to the most important hyperparameters, which helps you find a better model faster and at lower cost.W&B calculates importances using a tree-based model rather than a linear model, because tree-based models are more tolerant of both categorical data and data that isn’t normalized.
epochs, learning_rate, batch_size, and weight_decay were important.
Correlations
Correlations capture linear relationships between individual hyperparameters and metric values. They answer the question of whether a relationship exists between using a hyperparameter, such as the SGD optimizer, and theval_loss (in this case, the answer is yes). Correlation values range from -1 to 1, where positive values represent positive linear correlation, negative values represent negative linear correlation, and a value of 0 represents no correlation. Generally, a value greater than 0.7 in either direction represents strong correlation.
You might use this graph to further explore the values that have a higher correlation to your metric (in this case you might pick stochastic gradient descent or adam over rmsprop or nadam) or train for more epochs.
- Correlations show evidence of association, not necessarily causation.
- Correlations are sensitive to outliers, which might turn a strong relationship into a moderate one, especially when the sample size of hyperparameters tried is small.
- Correlations only capture linear relationships between hyperparameters and metrics. Correlations don’t capture strong polynomial relationships.