Enable code saving
Configure code saving for your team or organization. Team and organization controls are documented in Configure privacy settings.By default, W&B disables code saving for all teams. Before you can turn it on for a team, an organization admin must enable it at the organization level. See the Organization section.
Team
To enable code saving for a team as a team admin, navigate to the Settings page, then go to the Privacy section, and configure Enable code saving by default for runs in that team. This option is available only when an organization admin has not enforced code saving restrictions for the whole organization. For navigation steps, see Configure privacy settings for a team.Organization
To enable code saving for an organization as an organization admin, navigate to Settings, go to the Privacy section, and turn on Enforce default code saving restrictions so code saving stays off by default for every team. While this enforcement is on, team admins cannot turn on Enable code saving by default for a team. For the full list of organization controls, see Enforce privacy settings for all teams.Save code
Capture source code that produced a run as an artifact. The code artifact is viewable within your project’s workspace. There are two ways to save code: a fine-grained approach and an automatic approach.Fine grain control
Usewandb.Run.log_code() to log specific files or directories as an artifact.
By default, W&B walks through the current directory and logs all files that end with .py.
The following example shows how to use wandb.Run.log_code() to log the current directory:
wandb.Run.log_code() with include_fn= and exclude_fn= parameters to specify which files to include and exclude when you log code:
Automatically capture code
Usewandb.init(settings=wandb.Settings(code_dir=)) to automatically capture all code in the current directory and subdirectories. By default, W&B captures:
- Files ending in
.py - requirements.txt
- Dockerfile
- Excludes anything under
wandb/or.wandb/
. with the path to the directory that you want to capture.
View local changes
W&B generates diff files when you log code with staged or unstaged changes in your Git repository, and you can view the changes in the W&B UI. W&B names the diff filesdiff.patch or diff_<sha>.patch. These files contain local code changes that are not yet committed to Git, relative to HEAD.
To view diff files:
- Navigate to your project’s workspace.
- In the left sidebar, click Workspace.
- In the run selector, select the run whose diff you want to view.
- On the run Overview page, select the Files tab.
- From the list of files, select the
diff.patchordiff_<sha>.patchfile. - Select a file from the list to expand the diff for that file.
-
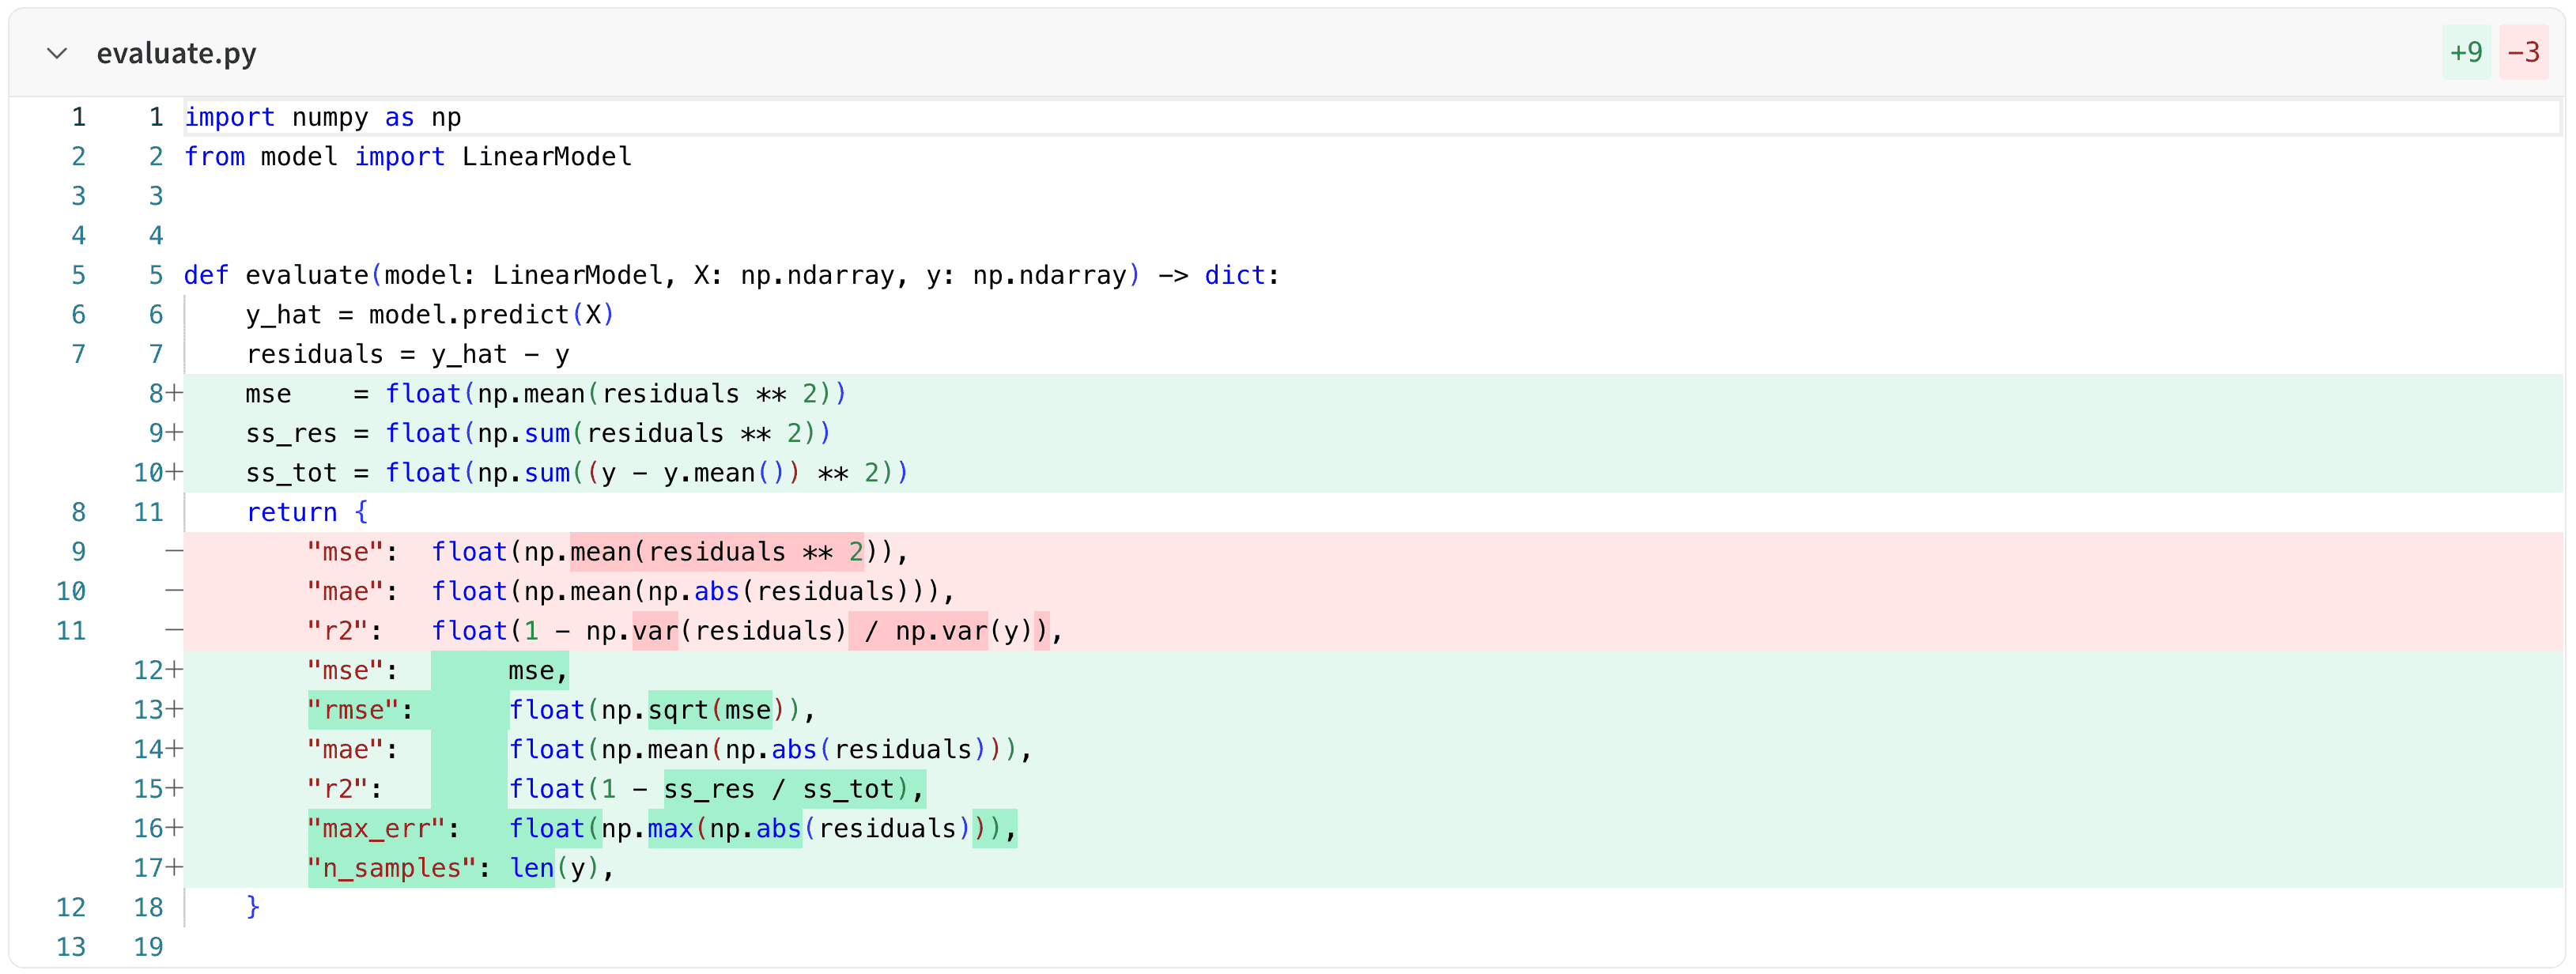
Unified view shows the diff in a single pane:
-
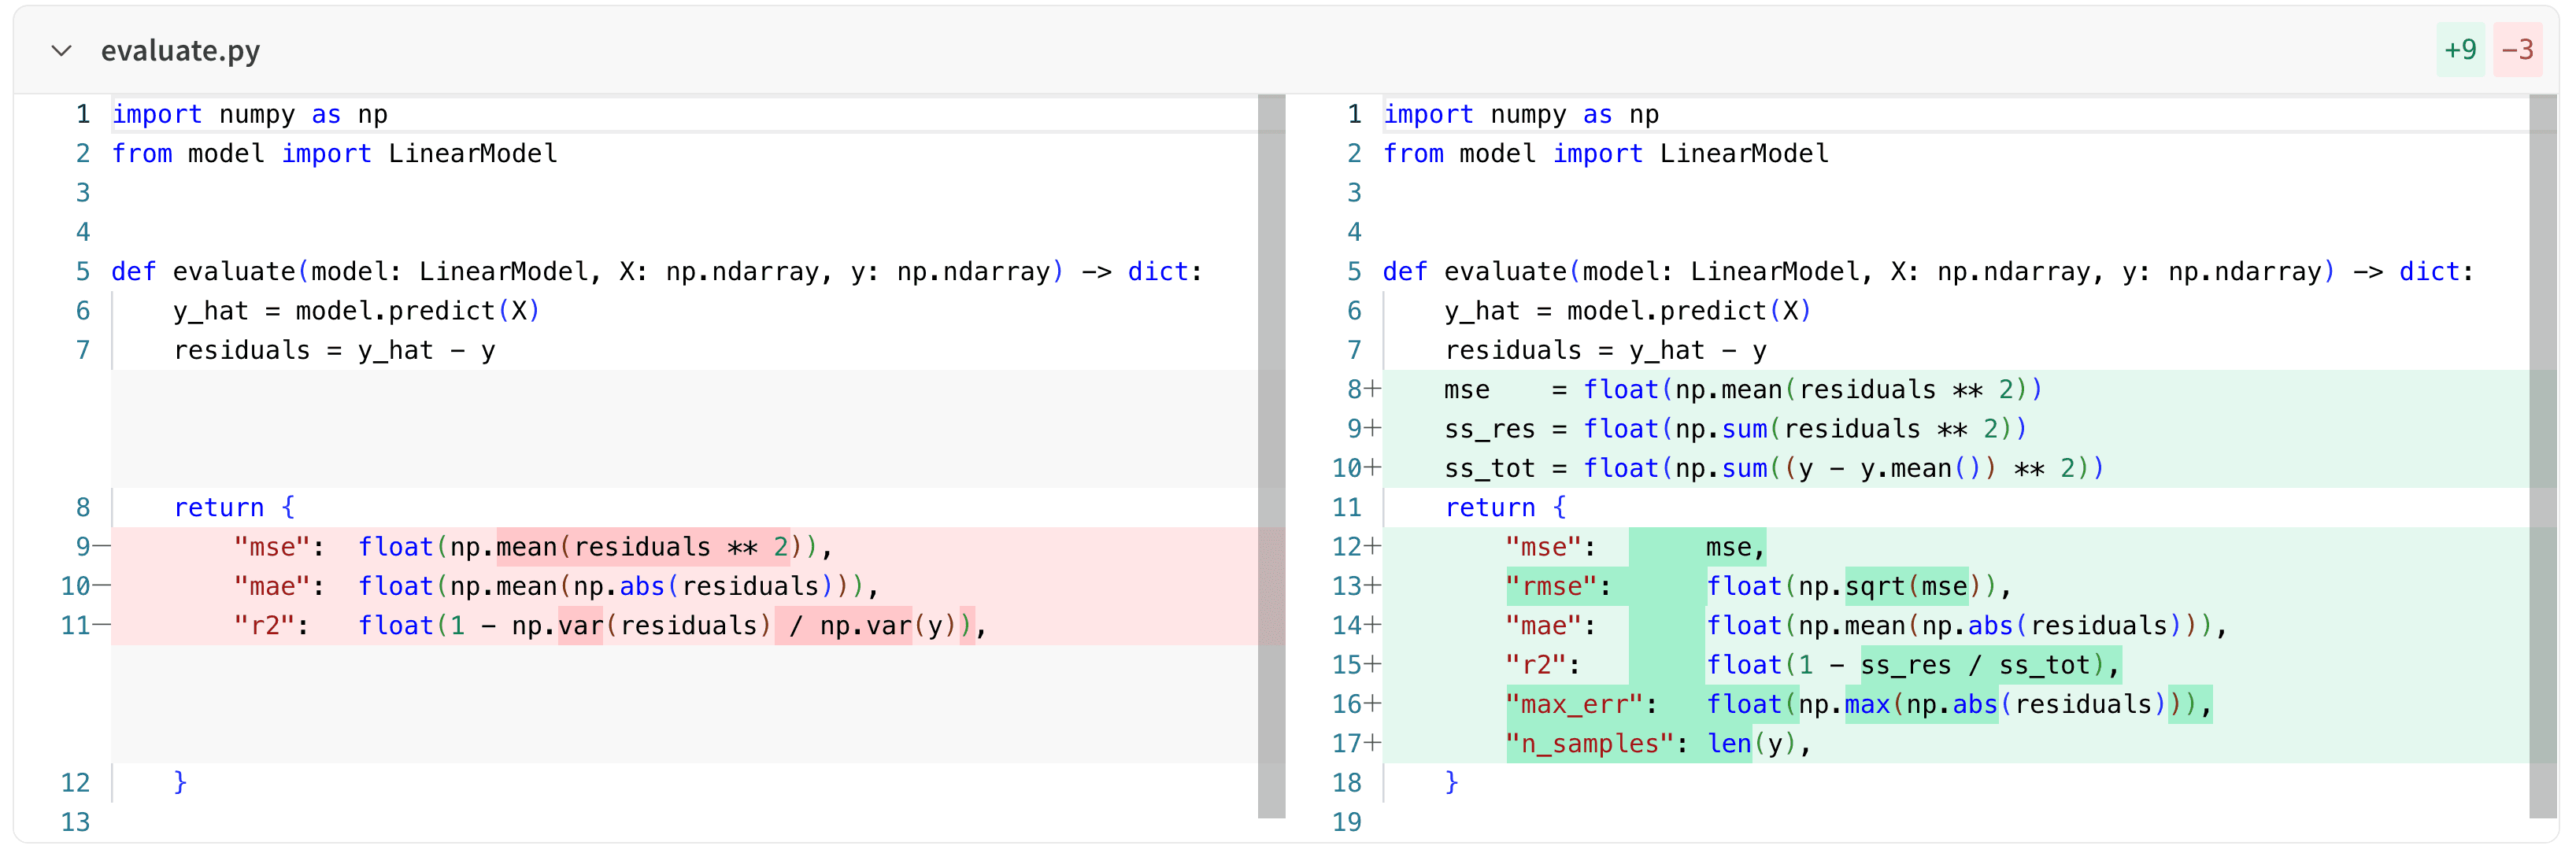
Split view shows the diff in two panes, side-by-side:
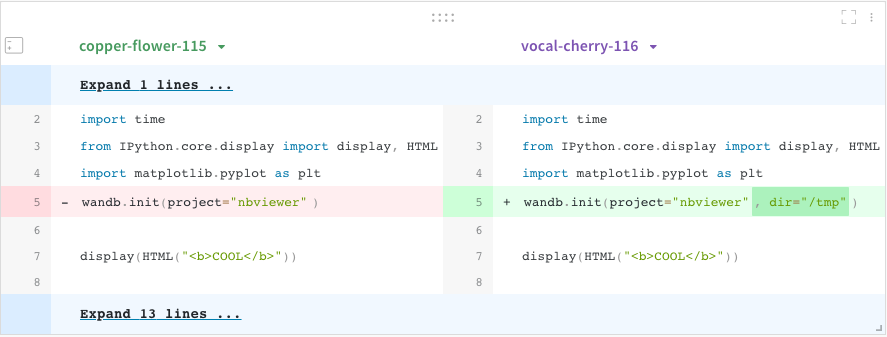
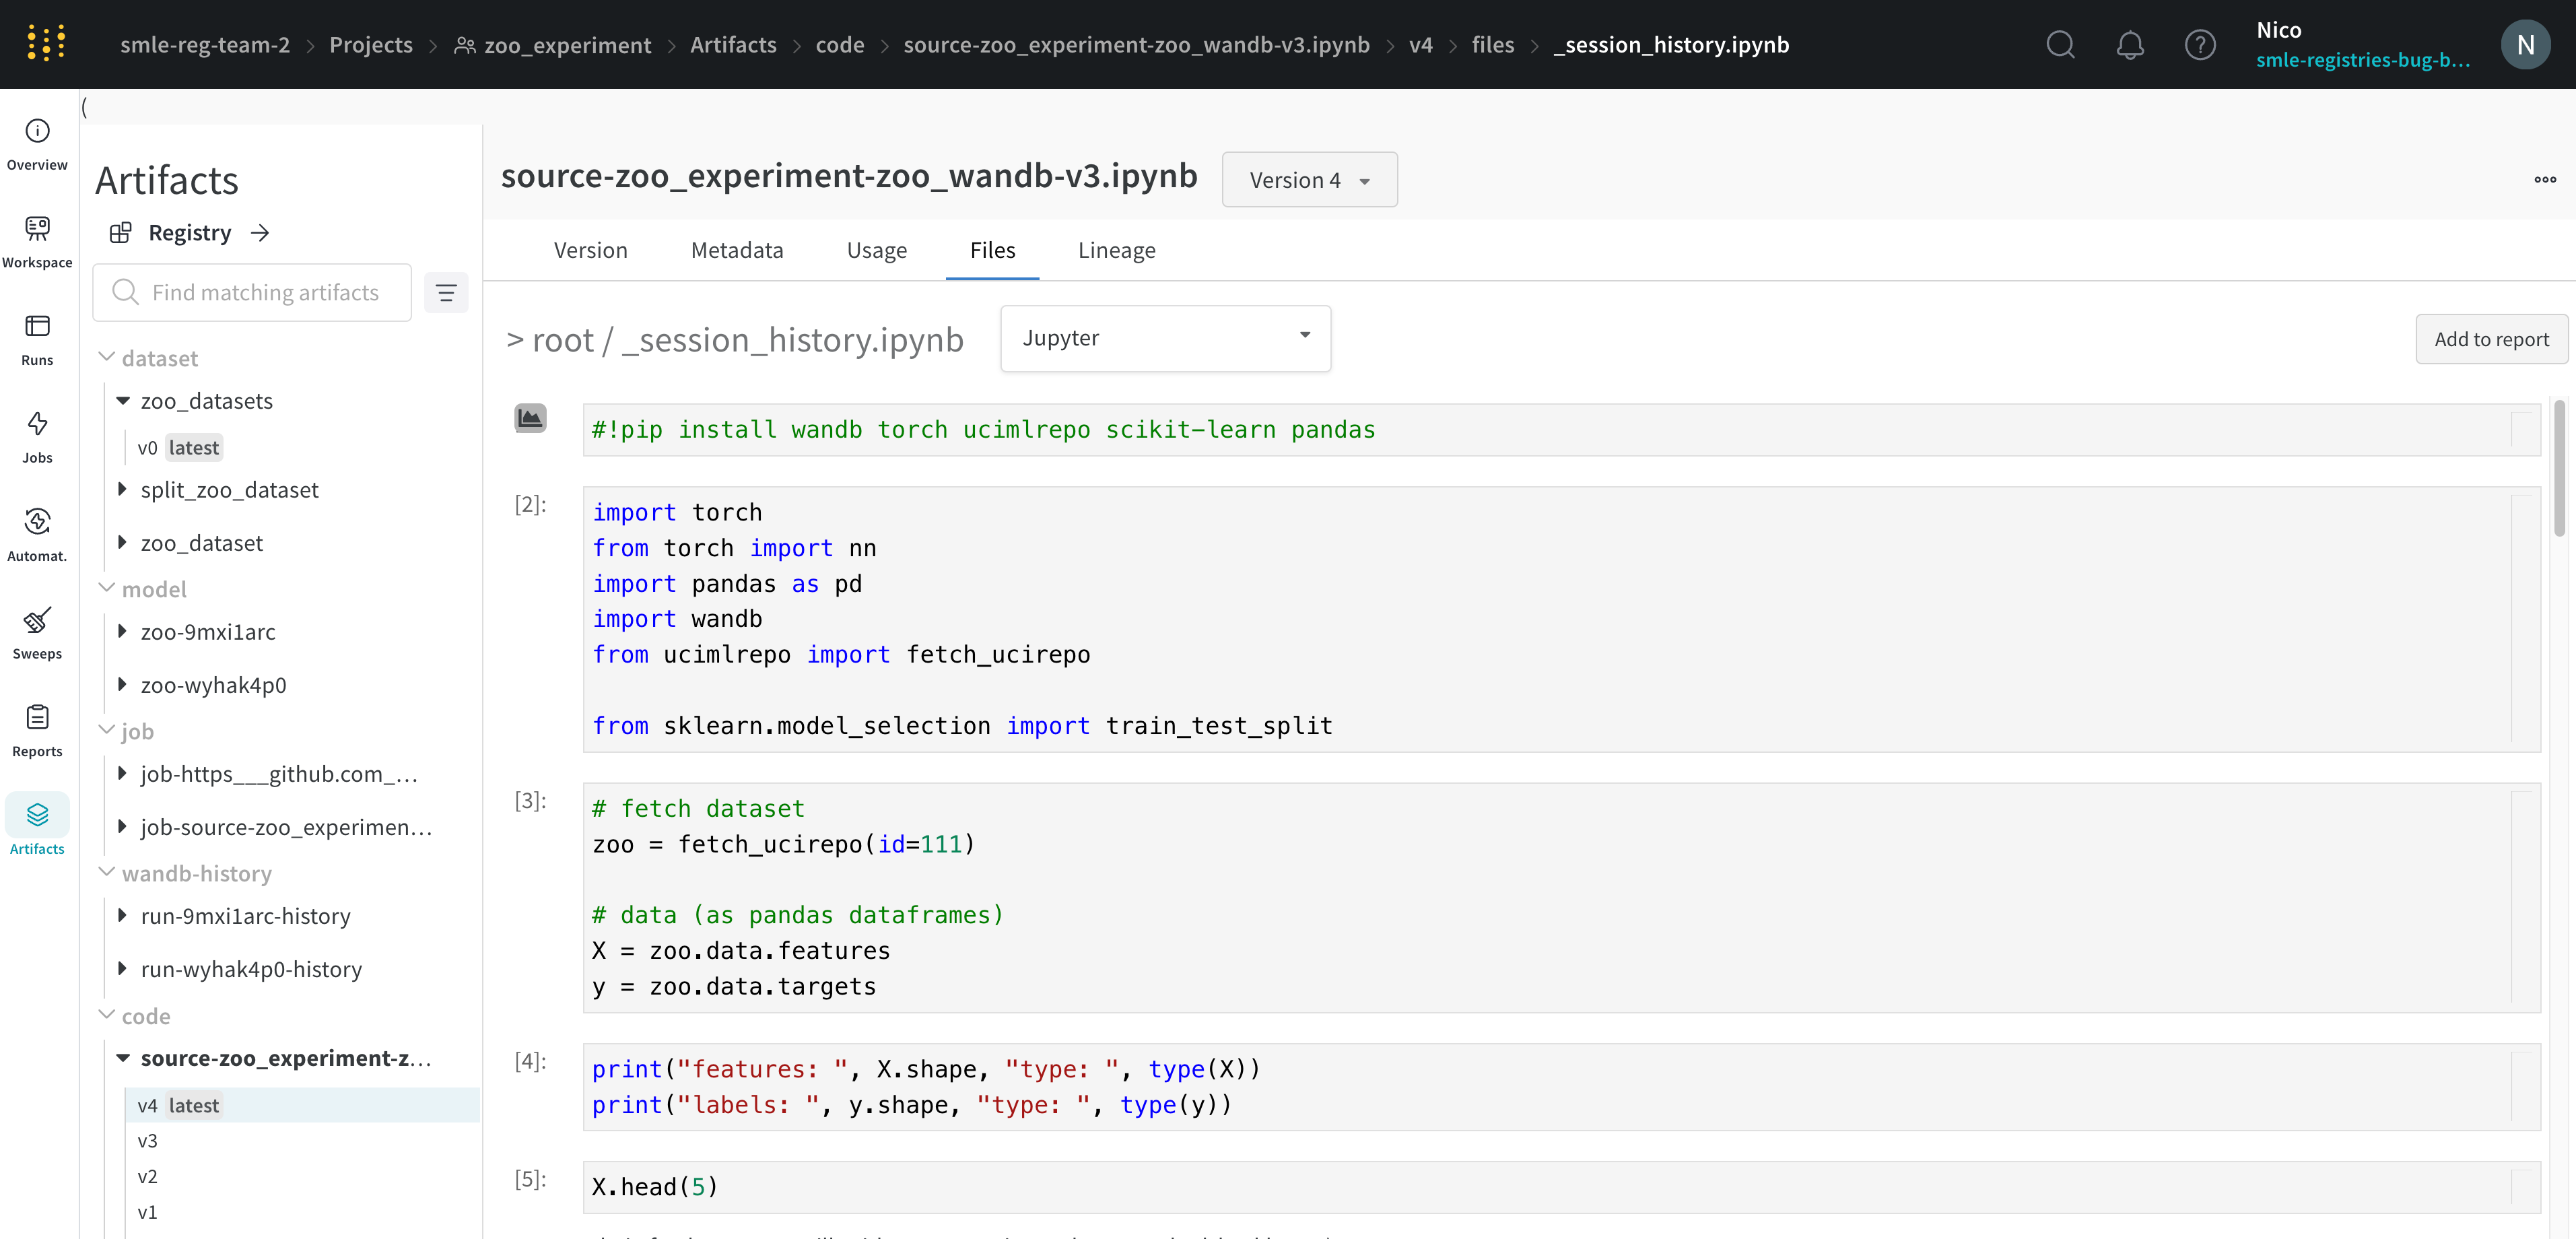
Jupyter session history
W&B saves the history of code executed in your Jupyter notebook session. When you callwandb.init() inside of Jupyter, W&B adds a hook to automatically save a Jupyter notebook containing the history of code executed in your current session.
- Navigate to your project’s workspace that contains your code.
- Select the Artifacts tab in the project sidebar.
- Expand the code artifact.
- Select the Files tab.
display method. This lets you see exactly what code ran within Jupyter in a given run. When possible, W&B also saves the most recent version of the notebook, which you find in the code directory as well.
Compare code across runs
Compare code used in different W&B runs:- Select the Add panels button in the top right corner of the page.
- Expand TEXT AND CODE dropdown and select Code.