Logging considerations
Usewandb.Run.log() to track experiment metrics.
Distinct metric count
For faster performance, keep the total number of distinct metrics in a project under 10,000.W&B automatically flattens nested values. This means that if you pass a dictionary, W&B turns it into a dot-separated name. For config values, W&B supports 3 dots in the name. For summary values, W&B supports 4 dots.
Value width
Limit the size of a single logged value to under 1 MB and the total size of a singlewandb.Run.log() call to under 25 MB. This limit does not apply to wandb.Media types like wandb.Image, wandb.Audio, etc.
Data is saved and tracked even if you log values wider than the recommended amount. However, your plots may load more slowly.
Metric frequency
Pick a logging frequency that is appropriate to the metric you are logging. As a general rule of thumb, log wider values less frequently than narrower values. W&B recommends:- Scalars: <100,000 logged points per metric
- Media: <50,000 logged points per metric
- Histograms: <10,000 logged points per metric
W&B continues to accept your logged data but pages may load more slowly if you exceed guidelines.
Config size
Limit the total size of your run config to less than 10 MB. Logging large values could slow down your project workspaces and runs table operations.Workspace considerations
Run count
To reduce loading times, keep the total number of runs in a single project under:- 100,000 on SaaS Cloud
- 10,000 on Dedicated Cloud or Self-Managed
Workspace performance
This section gives tips for optimizing the performance of your workspace.Panel count
By default, a workspace is automatic, and generates standard panels for each logged key. If a workspace for a large project includes panels for many logged keys, the workspace may be slow to load and use. To improve performance, you can:- Reset the workspace to manual mode, which includes no panels by default.
- Use Quick add to selectively add panels for the logged keys you need to visualize.
Deleting unused panels one at a time has little impact on performance. Instead, reset the workspace and selectively add back only those panels you need.
Section count
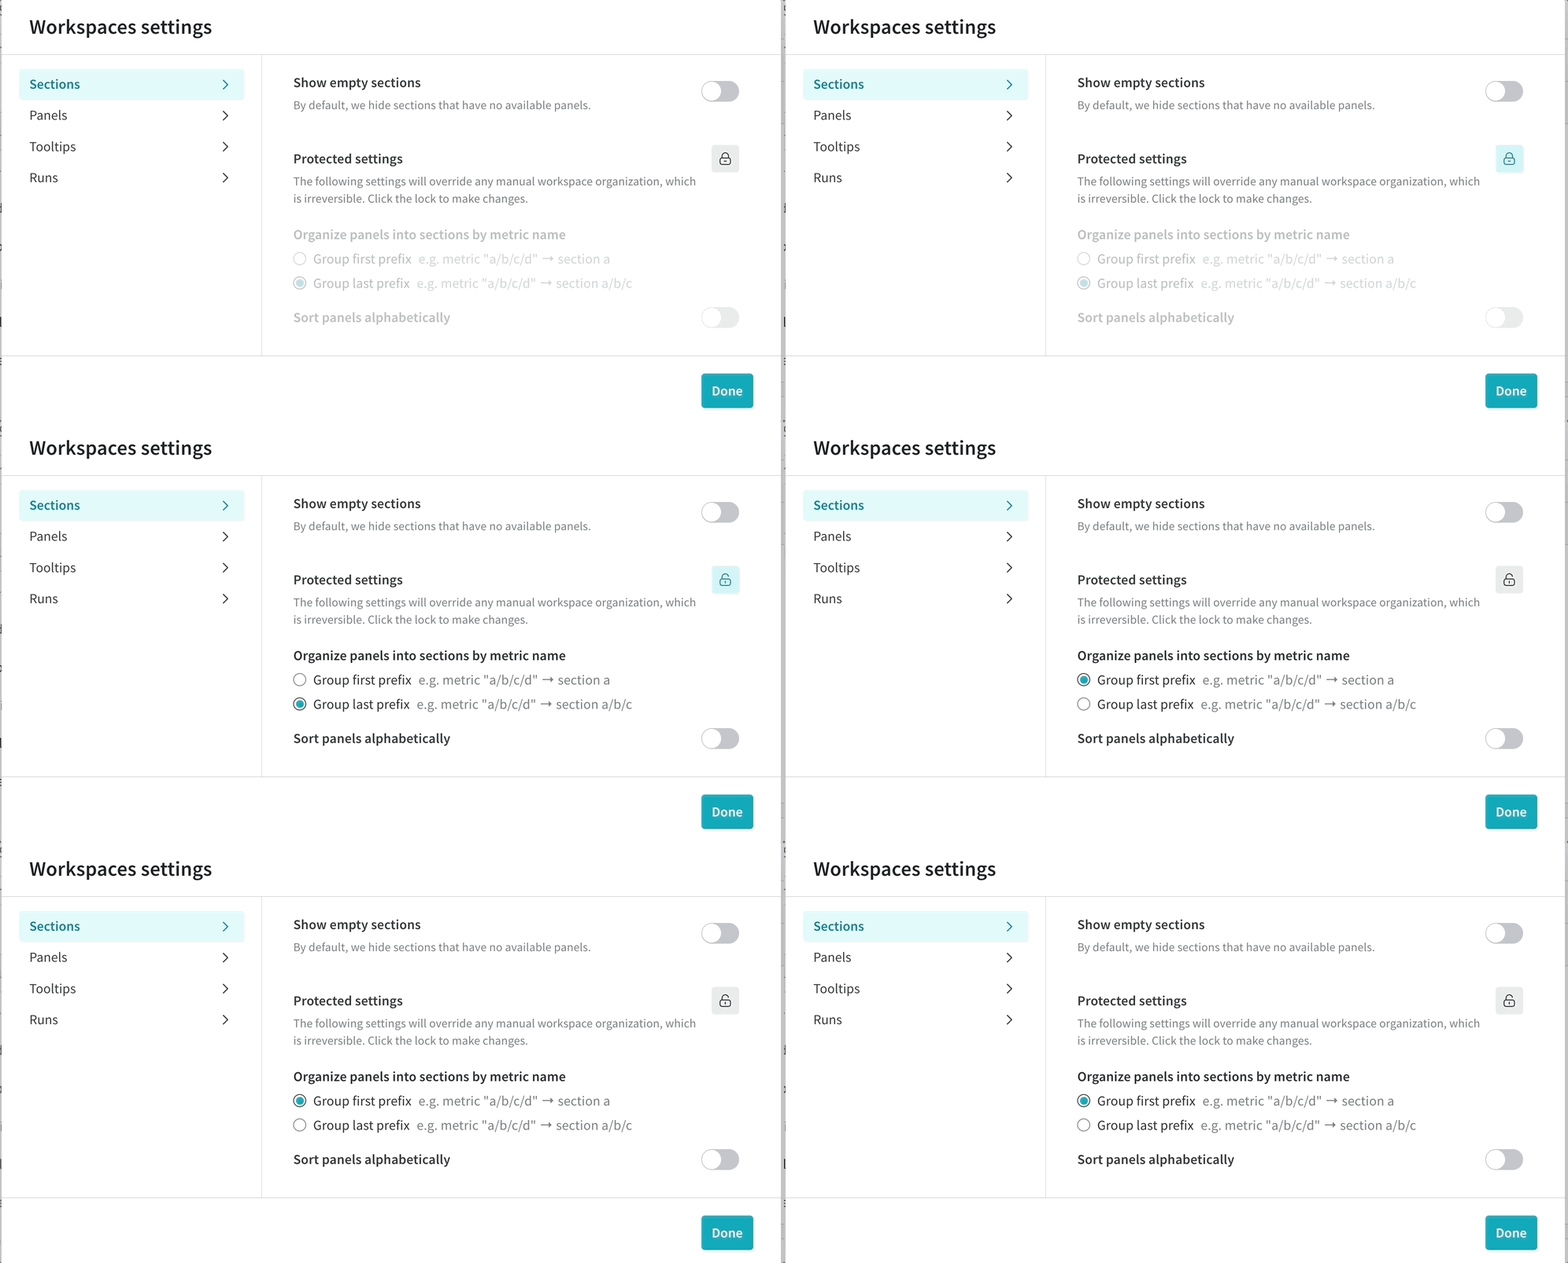
Having hundreds of sections in a workspace can hurt performance. Consider creating sections based on high-level groupings of metrics and avoiding an anti-pattern of one section for each metric. If you find you have too many sections and performance is slow, consider the workspace setting to create sections by prefix rather than suffix, which can result in fewer sections and better performance.
Metric count
When logging between 5000 and 100,000 metrics per run, W&B recommends using a manual workspace. In Manual mode, you can easily add and remove panels in bulk as you choose to explore different sets of metrics. With a more focused set of plots, the workspace loads faster. Metrics that are not plotted are still collected and stored as usual. To reset a workspace to manual mode, click the workspace’s action () menu, then click Reset workspace. Resetting a workspace has no impact on stored metrics for runs. See workspace panel management.File count
Keep the total number of files uploaded for a single run under 1,000. You can use W&B Artifacts when you need to log a large number of files. Exceeding 1,000 files in a single run can slow down your run pages.Reports vs. Workspaces
A report is a free-form composition of arbitrary arrangements of panels, text, and media, allowing you to easily share your insights with colleagues. By contrast, a workspace allows high-density and performant analysis of dozens to thousands of metrics across hundreds to hundreds of thousands of runs. Workspaces have optimized caching, querying, and loading capabilities, when compared to reports. Workspaces are recommended for a project that is used primarily for analysis, rather than presentation, or when you need to show 20 or more plots together.Python script performance
There are a few ways that the performance of your python script is reduced:- The size of your data is too large. Large data sizes could introduce a >1 ms overhead to the training loop.
- The speed of your network and how the W&B backend is configured
- If you call
wandb.Run.log()more than a few times per second. This is due to a small latency added to the training loop every timewandb.Run.log()is called.
Is frequent logging slowing your training runs down? Check out this Colab for methods to get better performance by changing your logging strategy.
Rate limits
W&B SaaS Cloud API implements a rate limit to maintain system integrity and ensure availability. This measure prevents any single user from monopolizing available resources in the shared infrastructure, ensuring that the service remains accessible to all users. You may encounter a lower rate limit for a variety of reasons.Rate limits are subject to change.
429 Rate limit exceeded error and the response includes rate limit HTTP headers.
Rate limit HTTP headers
The preceding table describes rate limit HTTP headers:| Header name | Description |
|---|---|
| RateLimit-Limit | The amount of quota available per time window, scaled in the range of 0 to 1000 |
| RateLimit-Remaining | The amount of quota in the current rate limit window, scaled in the range of 0 and 1000 |
| RateLimit-Reset | The number of seconds until the current quota resets |
Rate limits on metric logging API
wandb.Run.log() logs your training data to W&B. This API is engaged through either online or offline syncing. In either case, it imposes a rate limit quota limit in a rolling time window. This includes limits on total request size and request rate, where latter refers to the number of requests in a time duration.
W&B applies rate limits per W&B project. So if you have 3 projects in a team, each project has its own rate limit quota. Users on Paid plans have higher rate limits than Free plans.
If you encounter a rate limit, you receive a HTTP 429 Rate limit exceeded error and the response includes rate limit HTTP headers.
Suggestions for staying under the metrics logging API rate limit
Exceeding the rate limit may delayrun.finish() until the rate limit resets. To avoid this, consider the following strategies:
- Update your W&B Python SDK version: Ensure you are using the latest version of the W&B Python SDK. The W&B Python SDK is regularly updated and includes enhanced mechanisms for gracefully retrying requests and optimizing quota usage.
- Reduce metric logging frequency: Minimize the frequency of logging metrics to conserve your quota. For example, you can modify your code to log metrics every five epochs instead of every epoch:
- Manual data syncing: W&B store your run data locally if you are rate limited. You can manually sync your data with the command
wandb sync <run-file-path>. For more details, see thewandb syncreference.
Rate limits on GraphQL API
The W&B Models UI and SDK’s public API make GraphQL requests to the server for querying and modifying data. For all GraphQL requests in SaaS Cloud, W&B applies rate limits per IP address for unauthorized requests and per user for authorized requests. The limit is based on request rate (request per second) within a fixed time window, where your pricing plan determines the default limits. For relevant SDK requests that specify a project path (for example, reports, runs, artifacts), W&B applies rate limits per project, measured by database query time. Users on Teams and Enterprise plans receive higher rate limits than those on the Free plan. When you hit the rate limit while using the W&B Models SDK’s public API, you see a relevant message indicating the error in the standard output. If you encounter a rate limit, you receive a HTTP429 Rate limit exceeded error and the response includes rate limit HTTP headers.
Suggestions for staying under the GraphQL API rate limit
If you are fetching a large volume of data using the W&B Models SDK’s public API, consider waiting at least one second between requests. If you receive a HTTP429 Rate limit exceeded error or see RateLimit-Remaining=0 in the response headers, wait for the number of seconds specified in RateLimit-Reset before retrying.
Browser considerations
The W&B app can be memory-intensive and performs best in Chrome. Depending on your computer’s memory, having W&B active in 3+ tabs at once can cause performance to degrade. If you encounter unexpectedly slow performance, consider closing other tabs or applications.Reporting performance issues to W&B
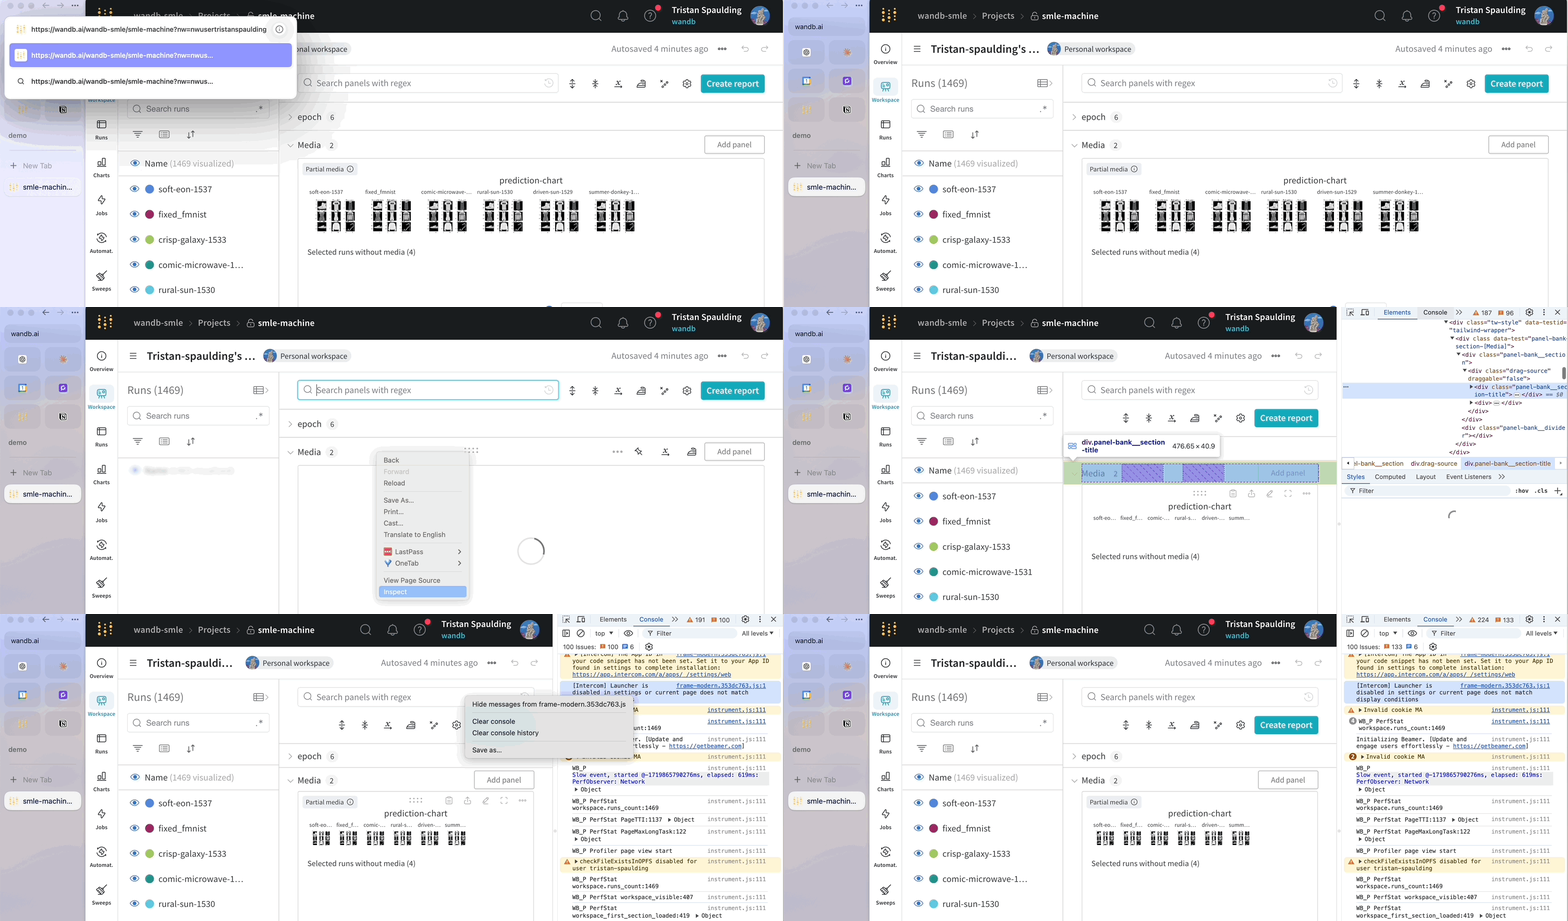
W&B takes performance seriously and investigates every report of lag. To expedite investigation, when reporting slow loading times consider invoking W&B’s built-in performance logger that captures key metrics and performance events. Append the URL parameter&PERF_LOGGING to a page that is loading slowly, then share the output of your console with your account team or Support.
