wandb.plot の method を使用して、wandb.Run.log() でチャートをトラッキングできます。これには、トレーニング中に時間の経過とともに変化するチャートも含まれます。custom charting framework の詳細については、custom charts walkthrough を参照してください。
基本チャート
wandb.Tableオブジェクトを作成し、可視化したいデータを追加します。- W&B に組み込まれている ヘルパー関数 のいずれかを使用して、プロットを生成します。
wandb.Run.log()を使ってプロットをログします。
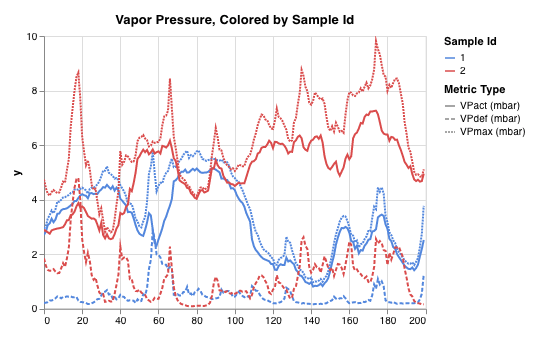
- 折れ線グラフ
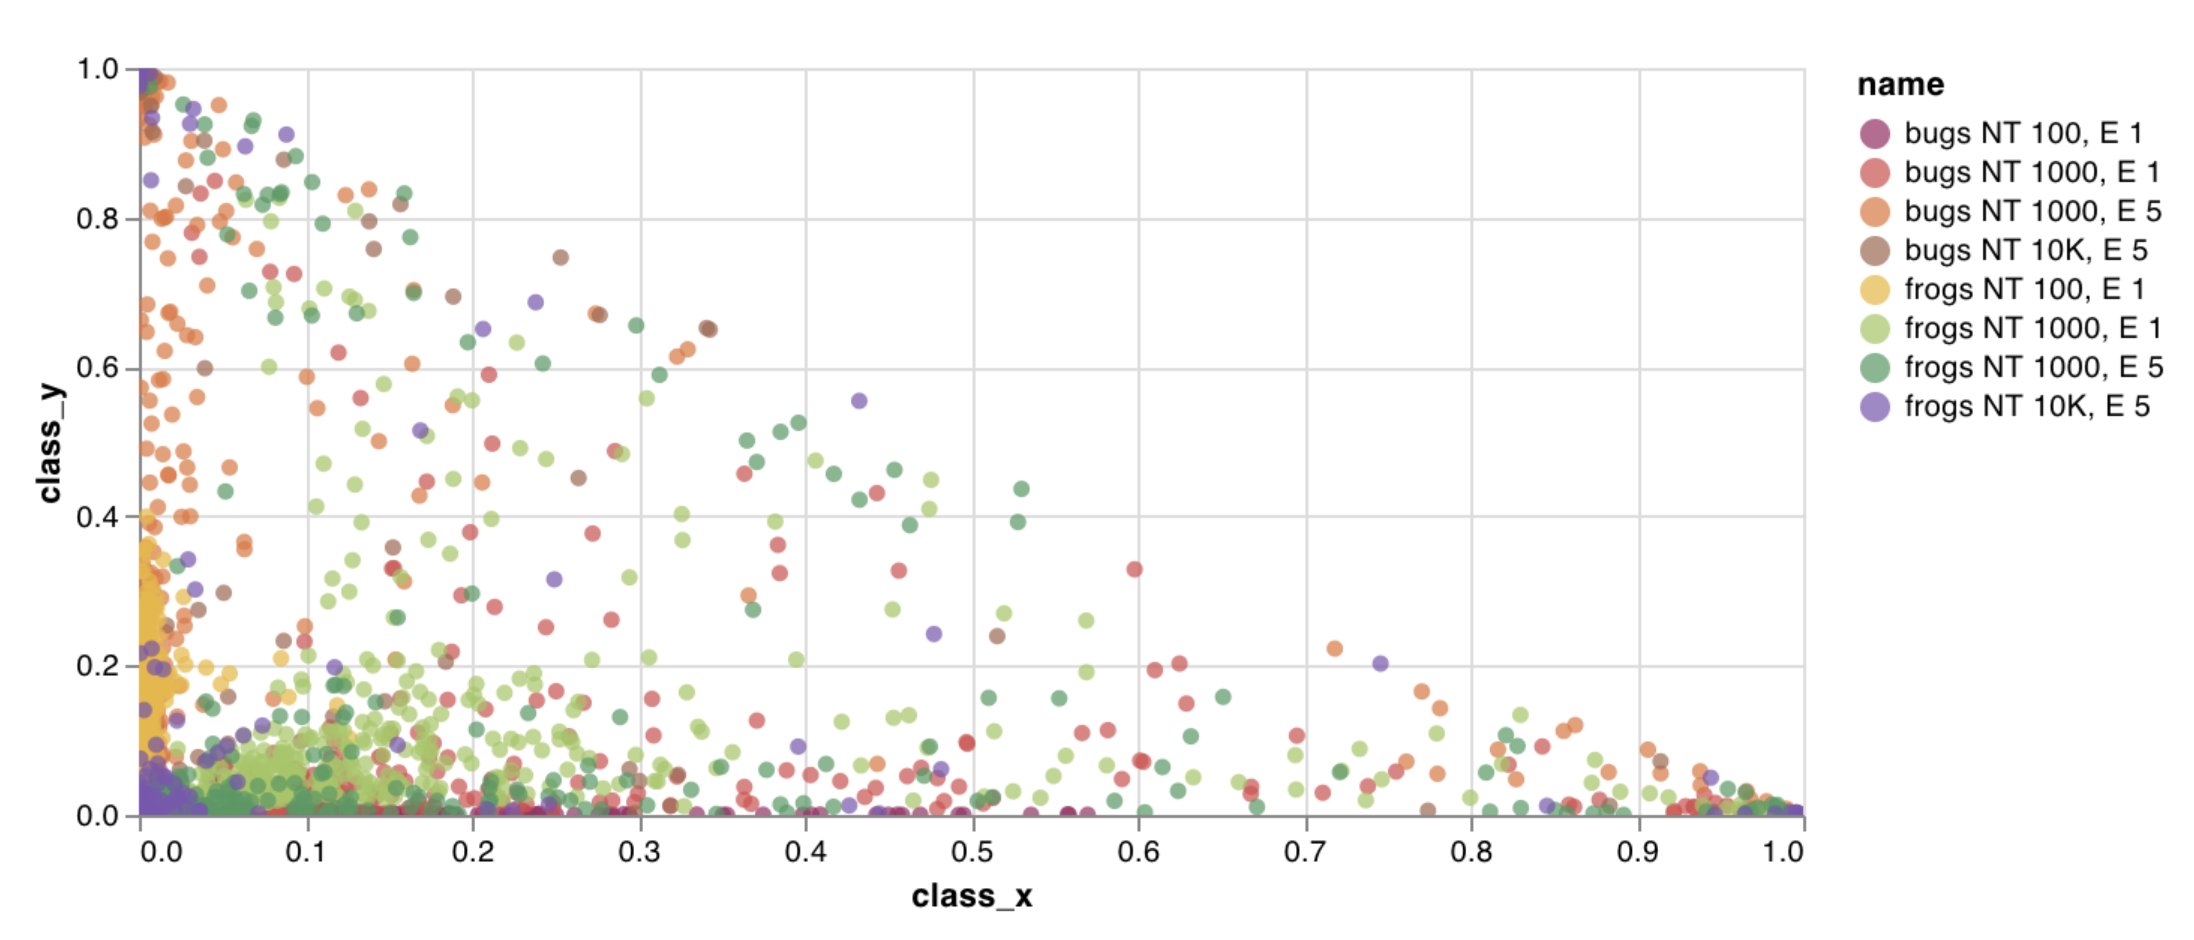
- 散布図
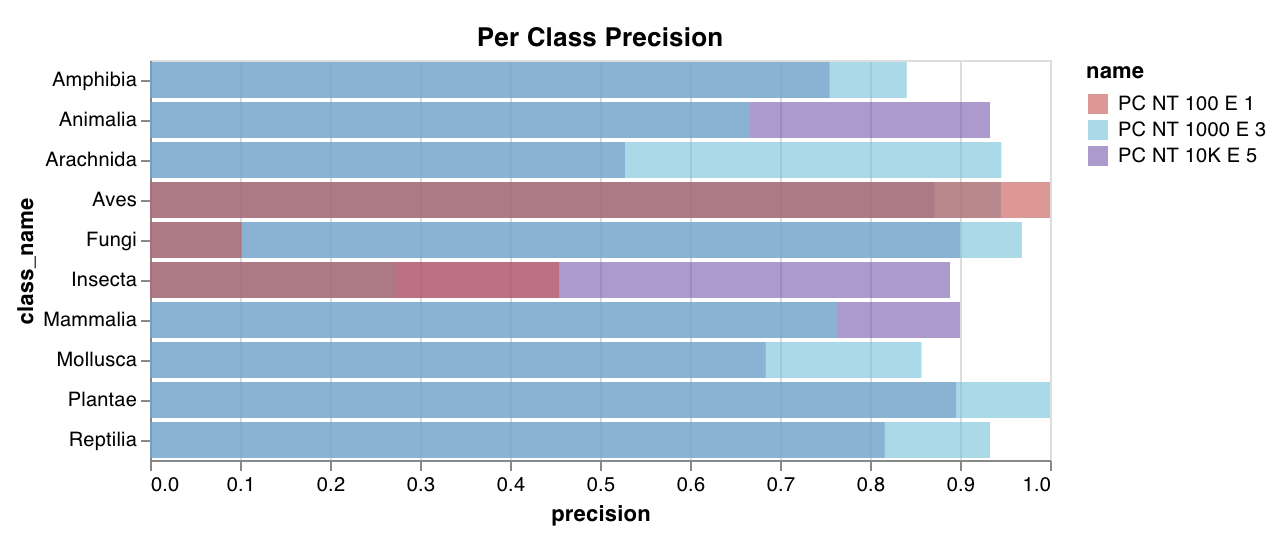
- 棒グラフ
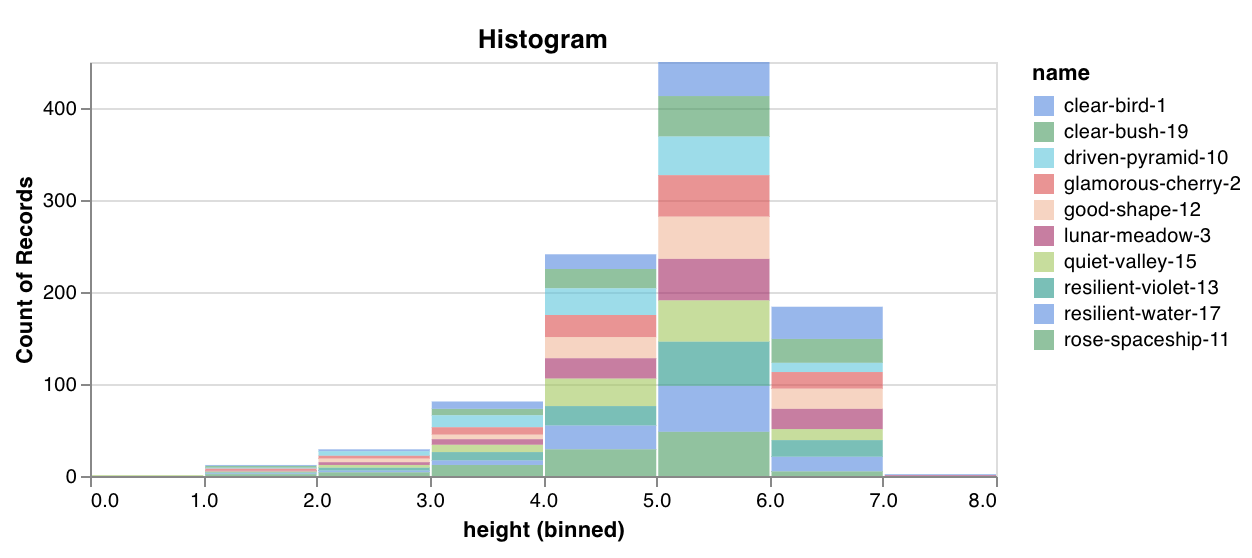
- ヒストグラム
- 複数折れ線
任意の軸上で接続され順序付けられた点のリストからなる、カスタム折れ線グラフをログします。これを使用すると、任意の2次元に対する曲線をログできます。2つの値のリストを互いにプロットする場合は、それぞれのリストの値の数が完全に一致している必要があります。たとえば、各点には x と y の両方が必要です。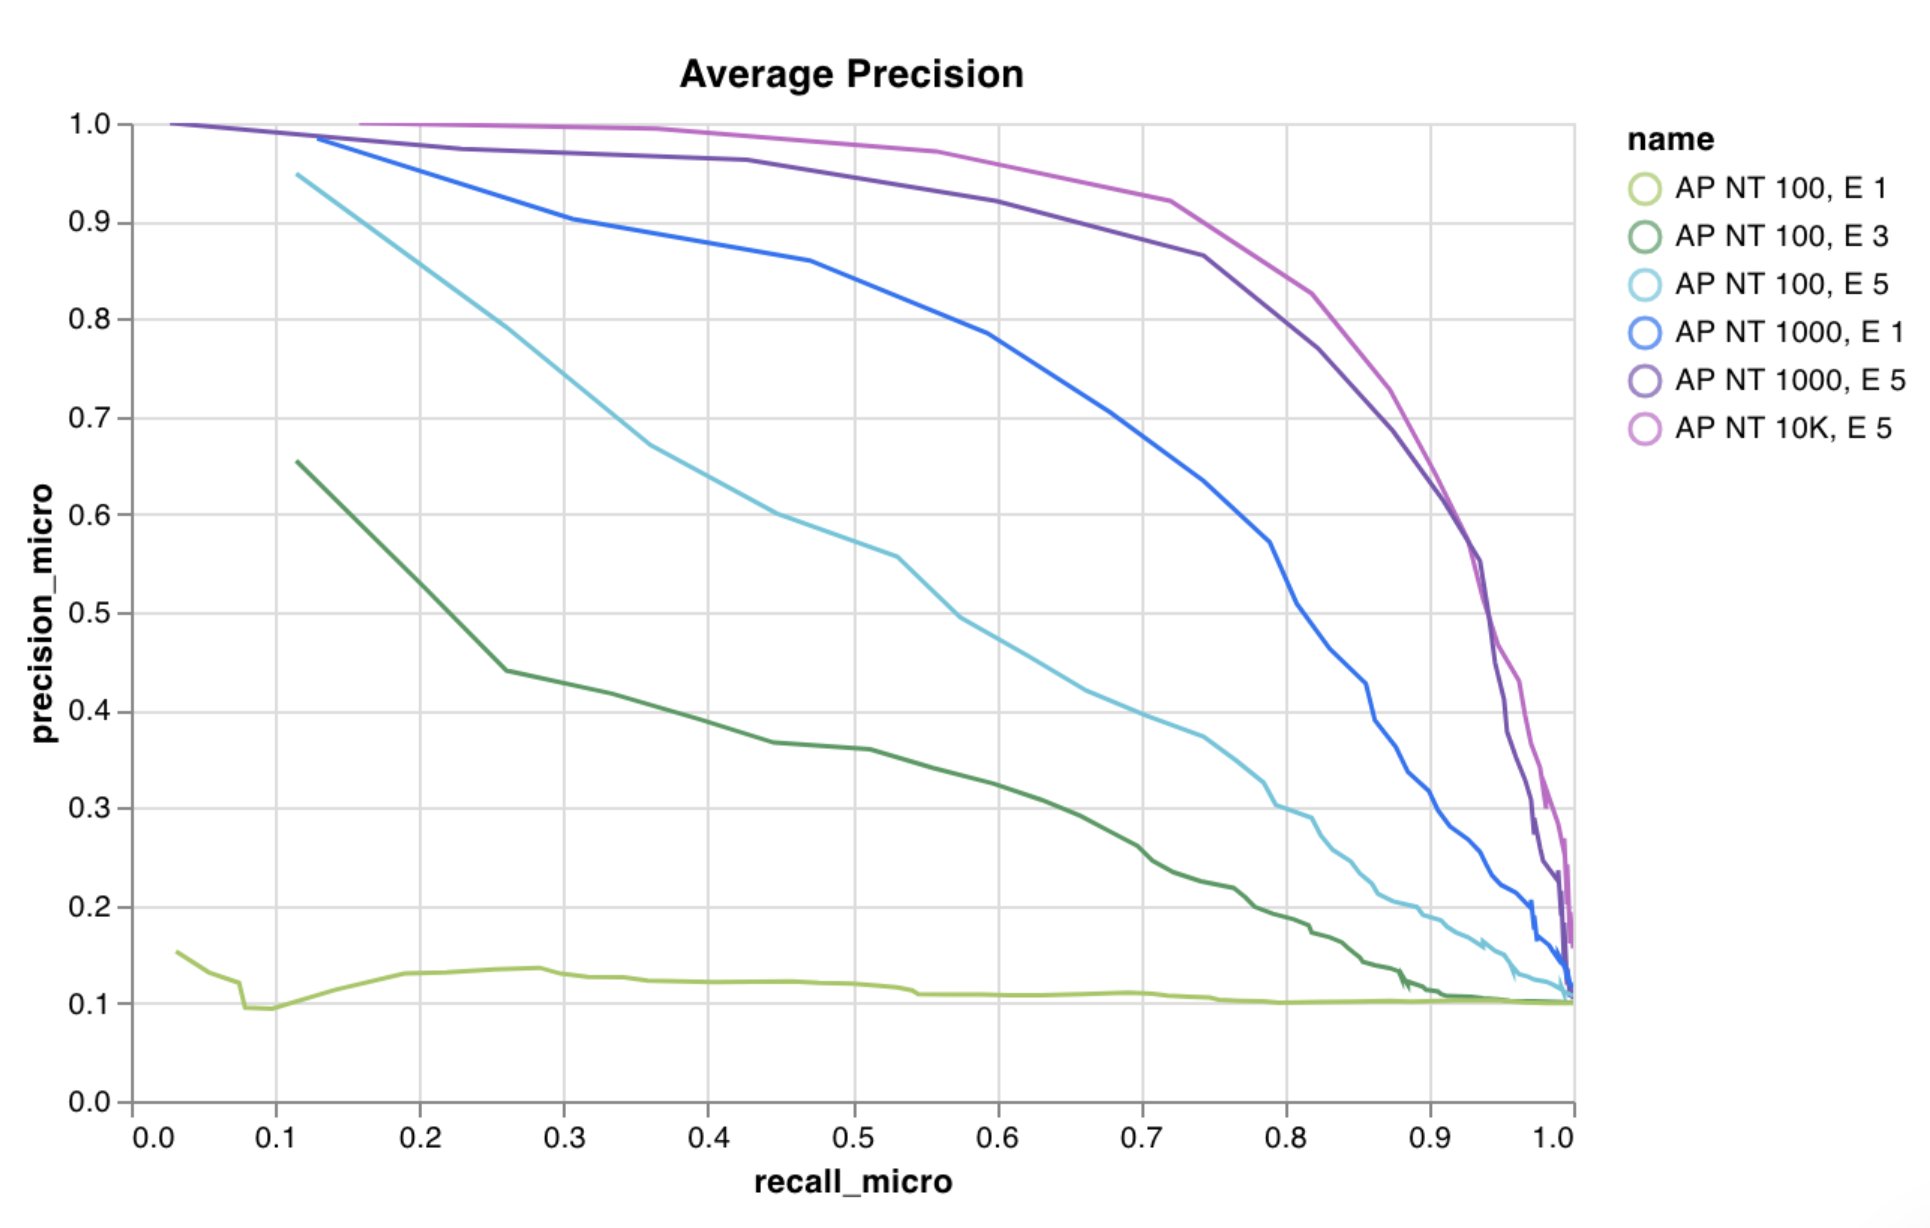
モデル評価用チャート
wandb.plot() method が用意されており、スクリプトから直接すばやくチャートをログして、UI で必要な情報を正確に確認できます。
- 適合率-再現率曲線
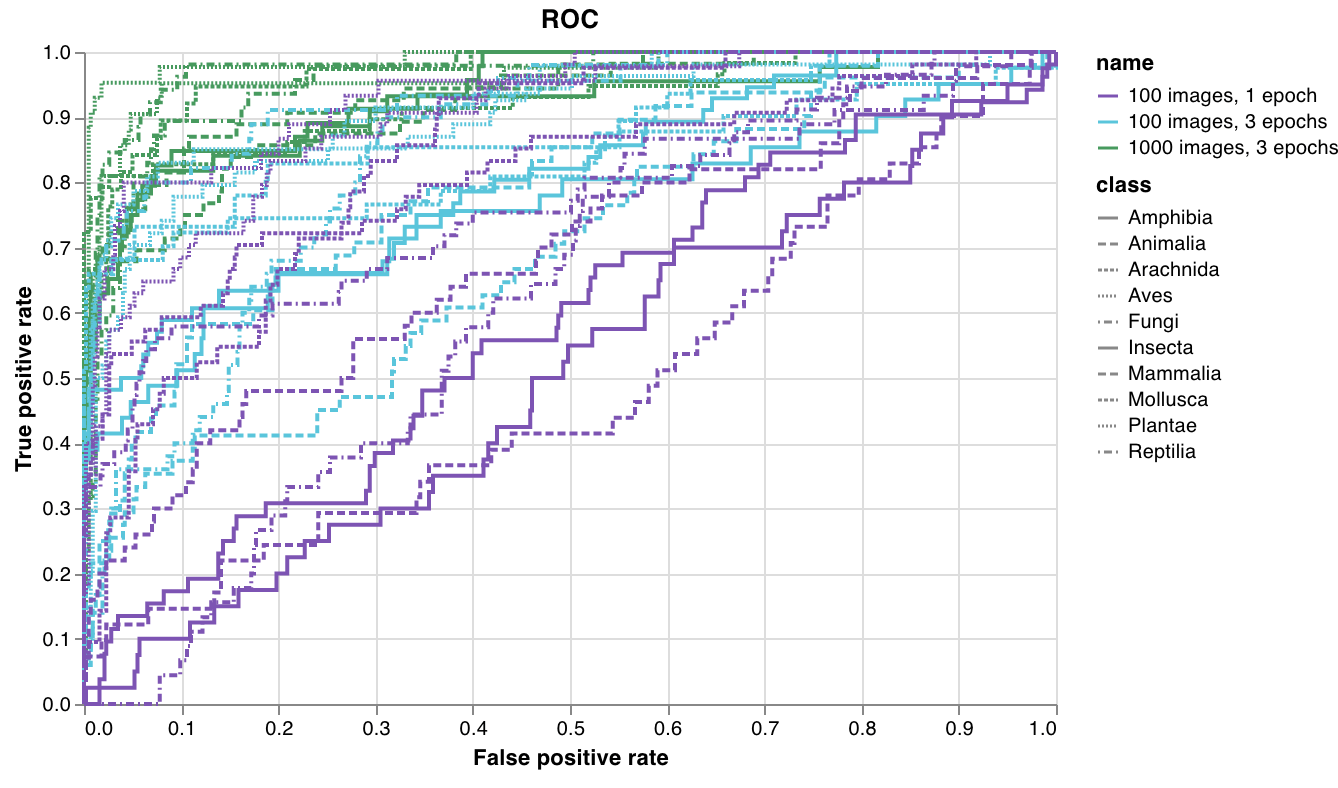
- ROC曲線
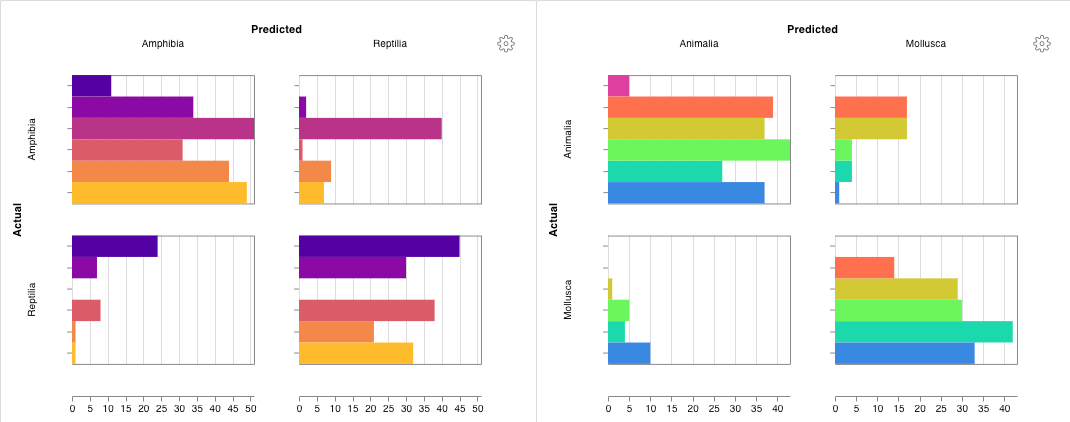
- 混同行列
1行でPrecision-Recall curveを作成できます:コードから次の情報にアクセスできる場合は、いつでもこれをログできます。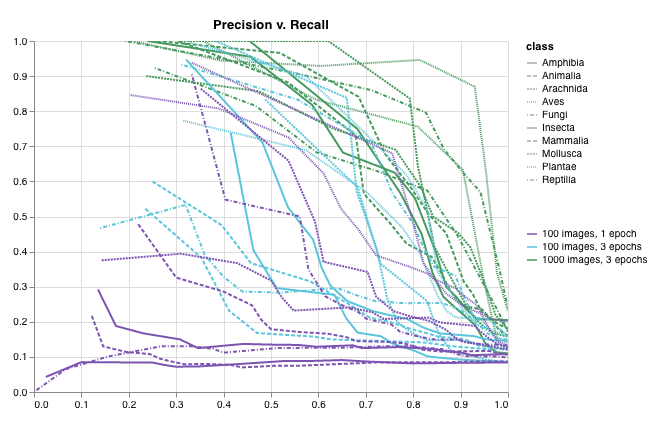
- 一連のサンプルに対するモデルの予測スコア (
predictions) 。 - それらのサンプルに対応する正解ラベル (
ground_truth) 。 - (任意) ラベルまたはクラス名のリスト。たとえば、ラベルインデックス 0 が cat、1 が dog、2 が bird を表す場合は、
labels=["cat", "dog", "bird"]。 - (任意) プロットに表示するラベルのサブセット (リスト形式のまま) 。
インタラクティブなカスタムチャート
Matplotlib と Plotly のプロット
wandb.plot() で W&B のカスタムチャートを使う代わりに、matplotlib や Plotly で生成したチャートをログできます。
matplotlib のプロットまたは図オブジェクトを wandb.Run.log() に渡すだけです。デフォルトでは、プロットは Plotly のプロットに変換されます。プロットを画像としてログしたい場合は、wandb.Image にプロットを渡してください。Plotly のチャートも直接受け付けています。
「You attempted to log an empty plot」のようなエラーが表示される場合は、
fig = plt.figure() を使って図をプロットとは別に保持し、その後 wandb.Run.log() の call で fig をログしてください。