This page covers a previous approach to monitoring production traffic. For new implementations, use Signals under Weave for Agents. See View agent signals.
- Automated scoring: Every incoming production trace is automatically processed and scored on common quality issues and errors.
- Infrastructure: Processing is powered by CoreWeave compute and CoreWeave GPUs for scalability across millions of traces.
- Gain behavioral insight. Move beyond system metrics to understand if your agent is hallucinating, failing to follow conversation patterns, or losing grounding in its evidence.
- Accelerate the research loop. Use the scores and failure analyses generated by signals to identify weaknesses, which you can use to research model improvement, data annotation, or reinforcement learning.
Available signals
W&B Weave offers monitors with built-in signals: preset scorers that evaluate production traces for common quality issues and errors by default, with no custom setup. Each built-in signal uses a benchmarked LLM prompt to classify traces and saves the results as comma-delimited tags representing the detected issues. Signals use a Serverless Inference model to score traces, so you don’t need external API keys. W&B Weave provides 13 preset signals organized into two groups.Quality signals
Quality signals evaluate successful root-level traces for output quality and safety issues.Error signals
Error signals categorize failed traces by root cause to help you identify and resolve infrastructure and application issues.How signals work
Each signal uses an LLM-as-a-judge approach to classify traces:- Trace selection: Quality signals evaluate successful root-level traces. Error signals evaluate failed traces. Weave doesn’t score child spans and intermediate Calls.
- Prompt construction: Weave constructs a prompt that includes the trace metadata, inputs, outputs, exception details (if any), and the operation’s source code. Weave appends the signal’s classifier prompt with instructions for the specific issue to detect.
- LLM scoring: For each signal, a Serverless Inference model performs a binary classification (whether that issue is present on the trace). Detected issues are returned as comma-delimited string tags (for example,
"Low-quality, User-frustration, Forgetful").
Add a signal from the Monitors page
Adding a signal turns on automated scoring so that Weave evaluates new production traces against that signal’s criteria. To enable signals:- Navigate to wandb.ai and then open your Weave project.
- In the Weave project sidebar, select Monitors.
- To add a signal to a project with no Monitors enabled, click on its card to activate its checkbox, then click Setup monitors.
- To add signals to an existing Monitor, select Browse signals at the top-right on the Monitors page. This opens the Add signals drawer, which lists available signals grouped by category (such as Quality classifiers and Error classifiers), each with a checkbox. You can select individual signals, use Enable all for a group, or select Create custom signal. Then select Add signals at the bottom of the drawer.
Manage active signals
After your signals are running, you can review which ones are active or turn off signals you no longer need. To view or remove active signals:- From the Monitors page, select the Manage signals () button. This opens a drawer listing all currently active signals grouped by category.
- Hover over a signal and select the Remove signal () button to deactivate the signal.
Use built-in signals
After signals are active and scoring your traces, you can review the results in several places across Weave. You can also set up alerts when Weave detects issues. The following sections describe where to find signal results and how to act on them.See tagged Call traces on the Traces page
If you trace individual functions as Ops with the@weave.op decorator, Weave stores signal results as feedback on the Call object. You can query these results from the Traces page.
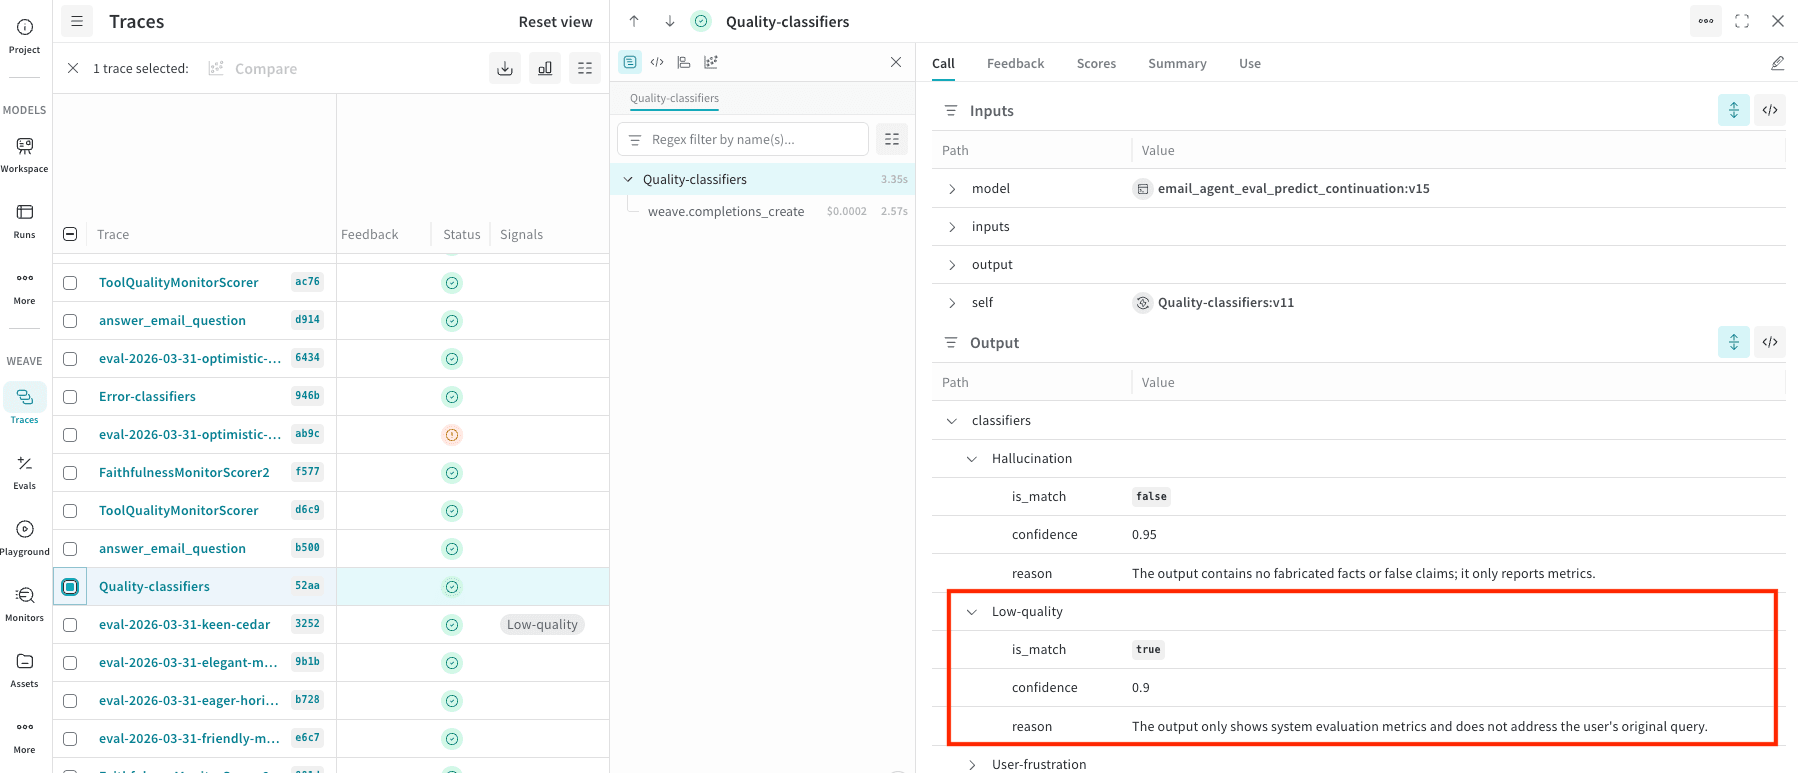
You can scan your traces for certain behavior in the Traces page using the Signals column. The Signals column shows tags when their criteria are met. Hover over these tags to see the confidence in the score and the reasoning.
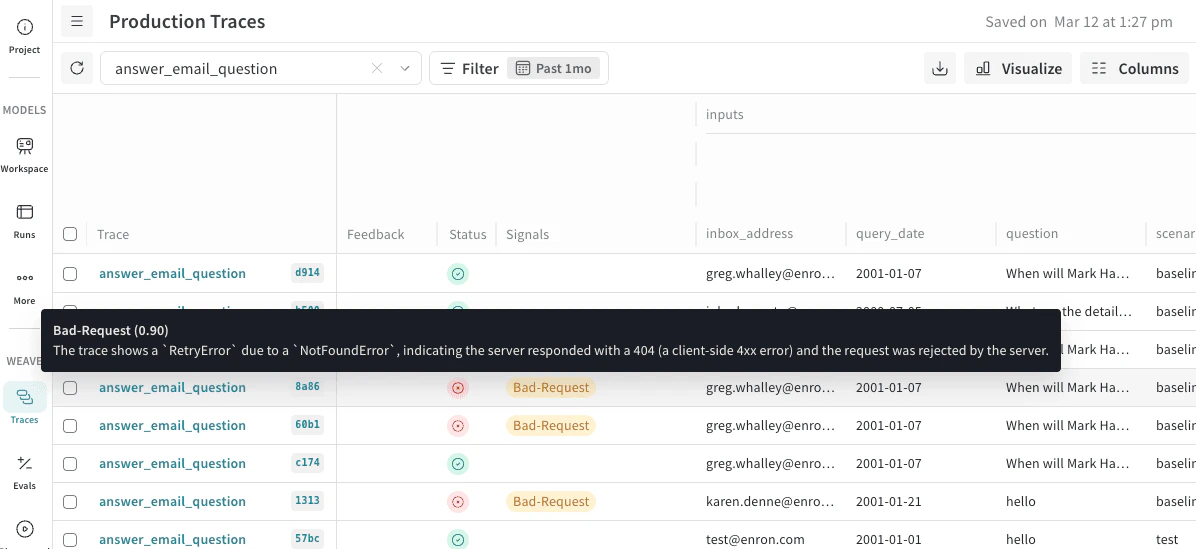
classifier_meta for the reasoning. For example, the following screenshot shows a Quality-classifiers signal with Low-quality match and confidence (0.9) with a reason for this rating.
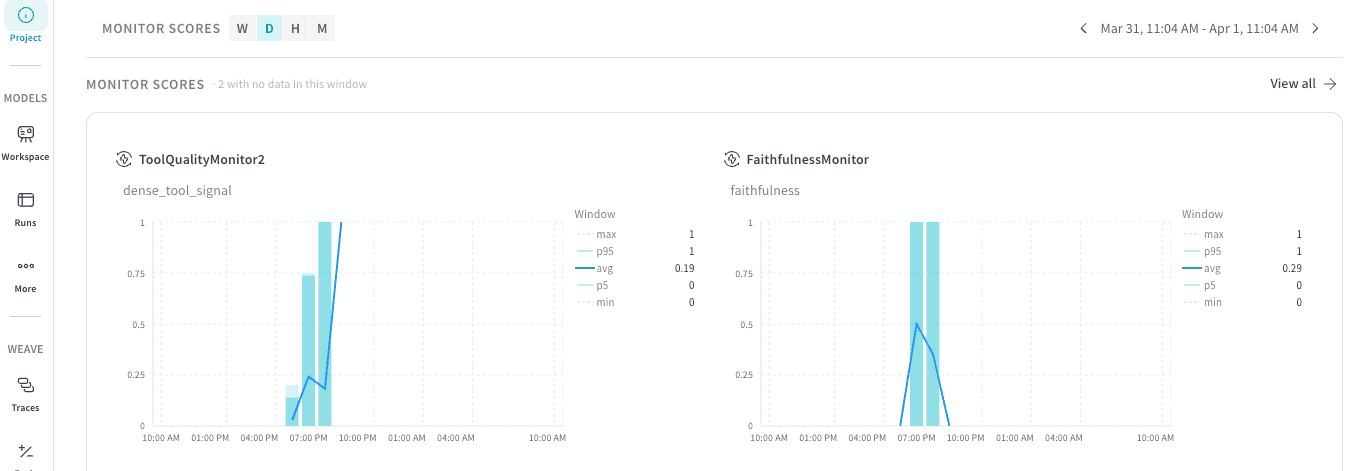
See signals in the project dashboard
You can also review signals at a project level:- In the project sidebar, select Project.
- At the top of the Project dashboard, select the Weave tab.
- In the Weave dashboard panels, locate Monitor Scores.
Alert on signals
Beyond reviewing signals in the UI, Weave can notify you when signals trigger. You can set up automated triggers that notify your team through tools such as Slack when an agent’s performance drops below a certain threshold. To get notified when a signal is triggered, set up an automation.For specific monitoring beyond what the built-in signals provide, see Set up custom monitors.