메인 콘텐츠로 건너뛰기
Weave Leaderboards를 사용하면 여러 메트릭에 걸쳐 여러 모델을 평가하고 비교하여 정확도, 생성 품질, 지연 시간 또는 맞춤형 평가 로직을 측정할 수 있습니다. 리더보드를 사용하면 한곳에서 모델 성능을 시각화하고, 시간에 따른 변화를 추적하며, 팀 전체 벤치마크에 대한 합의를 이끌어낼 수 있습니다. 이 가이드에서는 팀이 공유 벤치마크를 기준으로 모델 버전을 비교할 수 있도록 리더보드를 생성, 설정, 게시하는 방법을 설명합니다. 리더보드는 다음과 같은 경우에 적합합니다.
  • 모델 성능 저하 추적.
  • 공유 평가 워크플로 조율.
리더보드 생성은 Weave UI와 Weave Python SDK에서만 지원됩니다. TypeScript 사용자는 Weave UI를 사용해 리더보드를 생성하고 관리할 수 있습니다.

리더보드 만들기

Weave UI 또는 프로그래밍 방식으로 리더보드를 만들 수 있습니다. 일회성 비교에는 UI 방식을 선택하고, 자동화된 평가 워크플로에 리더보드 생성을 통합하려면 Python SDK를 사용하세요.

UI 사용

Weave UI를 사용해 대화형으로 리더보드를 만들고 사용자 지정하려면 다음과 같이 하세요.
  1. Weave UI에서 Leaders 섹션으로 이동합니다. 보이지 않으면 MoreLeaders를 클릭합니다.
  2. + New Leaderboard를 클릭합니다.
  3. Leaderboard Title 필드에 설명적인 이름(예: summarization-benchmark-v1)을 입력합니다.
  4. 필요에 따라 이 리더보드에서 무엇을 비교하는지 설명하는 내용을 추가합니다.
  5. 표시할 평가와 메트릭을 정의하려면 열 추가를 수행합니다.
  6. 레이아웃이 준비되면 리더보드를 저장하고 게시하여 다른 사람과 공유합니다.

열 추가

열은 각 모델별로 리더보드에 표시할 내용을 정의합니다. 리더보드의 각 열은 특정 평가의 메트릭을 나타냅니다. 열을 설정하려면 다음을 지정합니다.
  • 평가: 드롭다운에서 평가 run을 선택합니다(미리 생성되어 있어야 함).
  • Scorer: 해당 평가에 사용된 채점 함수(예: jaccard_similarity 또는 simple_accuracy)를 선택합니다.
  • 메트릭: 표시할 summary 메트릭(예: mean 또는 true_fraction)을 선택합니다.
열을 더 추가하려면 Add Column을 클릭합니다. 열을 편집하려면 오른쪽의 액션 () 메뉴를 클릭합니다. 다음 작업을 할 수 있습니다.
  • 앞이나 뒤로 이동. 열 순서를 변경합니다.
  • 복제. 열 정의를 복사합니다.
  • 삭제. 열을 제거합니다.
  • 오름차순 정렬. 리더보드의 기본 정렬을 설정합니다(다시 클릭하면 내림차순으로 전환됨).

Python SDK 사용

코드에서 리더보드를 정의, 게시, 조회하려면 Python SDK를 사용하세요. 이 방식을 사용하면 평가 코드와 함께 리더보드 버전을 관리하고 자동화된 워크플로의 일부로 실행할 수 있습니다.
바로 실행할 수 있는 전체 코드 예제가 필요하신가요? 엔드투엔드 Python 예제를 참조하세요.
리더보드를 생성하고 게시하려면 다음과 같이 하세요.
  1. 테스트 데이터셋을 정의합니다. 기본 제공 Dataset을 사용하거나, 입력과 타깃 목록을 직접 정의할 수 있습니다:
    dataset = [
        {"input": "...", "target": "..."},
        ...
    ]
    
  2. 하나 이상의 scorers를 정의합니다:
    @weave.op
    def jaccard_similarity(target: str, output: str) -> float:
        ...
    
  3. Evaluation을 생성합니다:
    evaluation = weave.Evaluation(
        name="My Eval",
        dataset=dataset,
        scorers=[jaccard_similarity],
    )
    
  4. 평가할 모델을 정의합니다:
    @weave.op
    def my_model(input: str) -> str:
        ...
    
  5. 평가를 실행합니다:
     async def run_all():
         await evaluation.evaluate(model_vanilla)
         await evaluation.evaluate(model_humanlike)
         await evaluation.evaluate(model_messy)
    
    asyncio.run(run_all())
    
  6. 리더보드를 생성합니다:
    spec = leaderboard.Leaderboard(
        name="My Leaderboard",
        description="Evaluating models on X task",
        columns=[
            leaderboard.LeaderboardColumn(
                evaluation_object_ref=get_ref(evaluation).uri(),
                scorer_name="jaccard_similarity",
                summary_metric_path="mean",
            )
        ]
    )
    
  7. 리더보드를 게시합니다.
    weave.publish(spec)
    
  8. 결과를 조회합니다:
    results = leaderboard.get_leaderboard_results(spec, client)
    print(results)
    
게시 후 리더보드는 Weave UI의 Leaders 탭에서 확인할 수 있으며, 여기에서 팀이 모델 성능을 보고 비교할 수 있습니다.

End-to-end Python 예제

다음 예제에서는 Weave Evaluations를 사용해 맞춤형 메트릭으로 공유 데이터셋에서 세 가지 요약 모델을 비교하는 리더보드를 만듭니다. 작은 벤치마크를 만든 뒤 각 모델을 평가하고, Jaccard similarity로 각 모델의 점수를 매긴 다음, 결과를 Weave 리더보드에 게시합니다.
import weave
from weave.flow import leaderboard
from weave.trace.ref_util import get_ref
import asyncio

client = weave.init("leaderboard-demo")

dataset = [
    {
        "input": "Weave is a tool for building interactive LLM apps. It offers observability, trace inspection, and versioning.",
        "target": "Weave helps developers build and observe LLM applications."
    },
    {
        "input": "The OpenAI GPT-4o model can process text, audio, and vision inputs, making it a multimodal powerhouse.",
        "target": "GPT-4o is a multimodal model for text, audio, and images."
    },
    {
        "input": "The W&B team recently added native support for agents and evaluations in Weave.",
        "target": "W&B added agents and evals to Weave."
    }
]

@weave.op
def jaccard_similarity(target: str, output: str) -> float:
    target_tokens = set(target.lower().split())
    output_tokens = set(output.lower().split())
    intersection = len(target_tokens & output_tokens)
    union = len(target_tokens | output_tokens)
    return intersection / union if union else 0.0

evaluation = weave.Evaluation(
    name="Summarization Quality",
    dataset=dataset,
    scorers=[jaccard_similarity],
)

@weave.op
def model_vanilla(input: str) -> str:
    return input[:50]

@weave.op
def model_humanlike(input: str) -> str:
    if "Weave" in input:
        return "Weave helps developers build and observe LLM applications."
    elif "GPT-4o" in input:
        return "GPT-4o supports text, audio, and vision input."
    else:
        return "W&B added agent support to Weave."

@weave.op
def model_messy(input: str) -> str:
    return "Summarizer summarize models model input text LLMs."

async def run_all():
    await evaluation.evaluate(model_vanilla)
    await evaluation.evaluate(model_humanlike)
    await evaluation.evaluate(model_messy)

asyncio.run(run_all())

spec = leaderboard.Leaderboard(
    name="Summarization Model Comparison",
    description="Evaluate summarizer models using Jaccard similarity on three short samples.",
    columns=[
        leaderboard.LeaderboardColumn(
            evaluation_object_ref=get_ref(evaluation).uri(),
            scorer_name="jaccard_similarity",
            summary_metric_path="mean",
        )
    ]
)

weave.publish(spec)

results = leaderboard.get_leaderboard_results(spec, client)
print(results)

리더보드 보기 및 해석

스크립트가 리더보드를 게시한 후에는 Weave UI에서 결과를 확인하고 모델 성능을 나란히 비교합니다:
  1. Weave UI에서 Leaders 탭으로 이동합니다. 보이지 않으면 More를 클릭한 다음 Leaders를 선택합니다.
  2. 리더보드 이름(예: Summarization Model Comparison)을 클릭합니다.
리더보드 테이블에서 각 행은 특정 모델(model_humanlike, model_vanilla, model_messy)을 나타냅니다. mean 열은 모델의 출력과 레퍼런스 요약 간의 평균 Jaccard 유사도를 보여줍니다.
Weave UI의 리더보드
이 예제에서는:
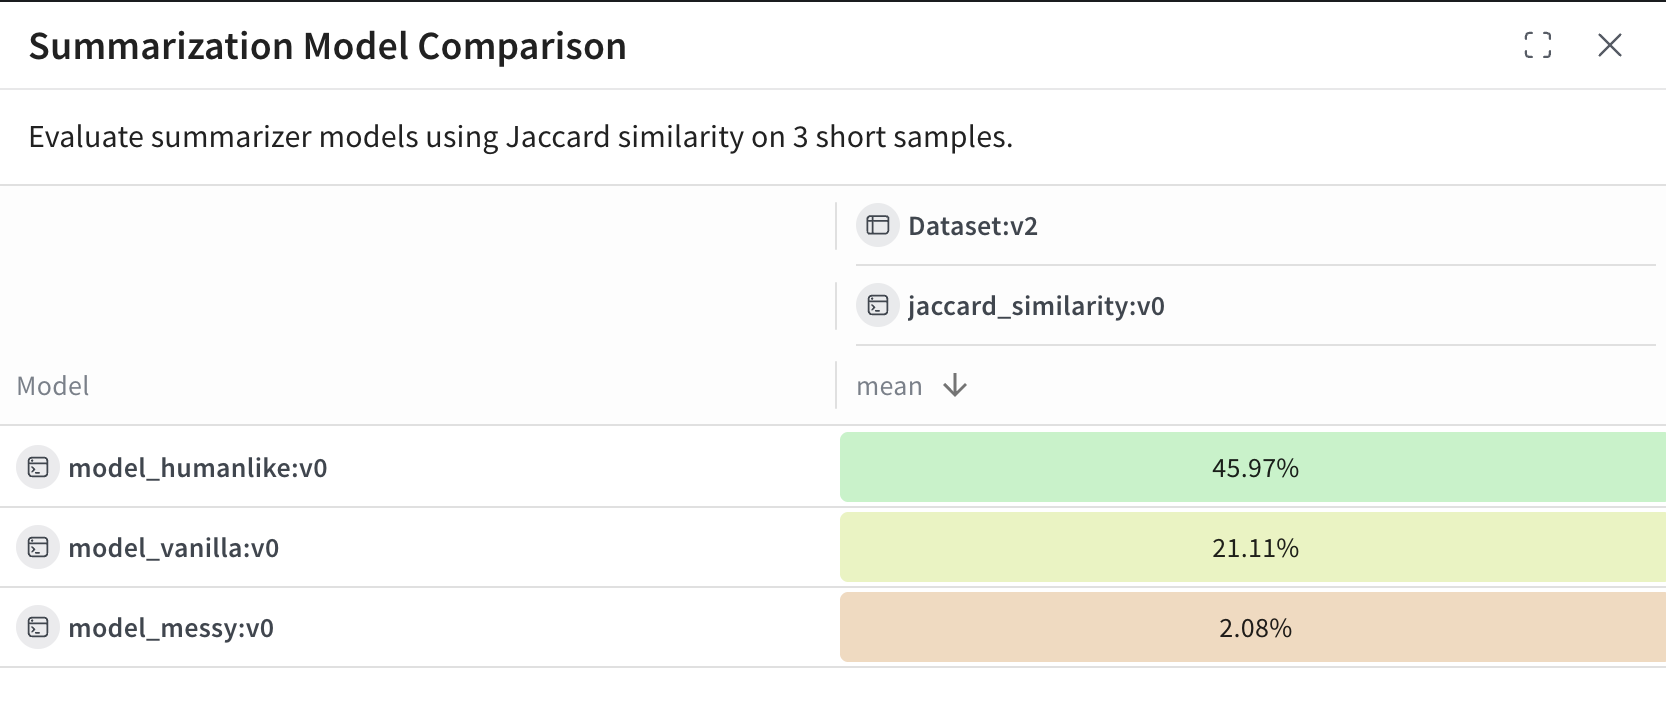
  • model_humanlike가 약 46퍼센트의 중첩률로 가장 좋은 성능을 보입니다.
  • model_vanilla(단순한 잘라내기 방식)는 약 21퍼센트를 기록합니다.
  • model_messy는 의도적으로 성능이 나쁘게 만든 모델로, 약 2퍼센트의 점수를 기록합니다.