- Automatic tracking of LLM library calls.
- Tracking of custom functions with
weave.op. - Manual Call tracking using the API directly.
Automatic tracking of LLM library calls
Weave integrates automatically with many common libraries and frameworks, such asopenai, anthropic, cohere, mistral, and LangChain. Import the LLM or framework library and initialize your Weave project. Weave then automatically traces all Calls made to the LLM or platform to your project without any additional code changes. For a complete list of supported library integrations, see Integrations overview.
- Python
- TypeScript
Track custom functions
LLM applications often have additional logic, such as pre-processing and post-processing, prompts, and more, that you want to track. Use this approach when you want Weave to capture your own functions alongside the LLM calls it traces automatically.- Python
- TypeScript
Weave lets you manually track these Calls using the You can also track methods on classes.
@weave.op decorator. For example:Track class and object methods
In addition to standalone functions, you can track class and object methods. You can track any method in a class by decorating the method withweave.op.
- Python
- TypeScript
Trace parallel (multi-threaded) function calls
By default, parallel Calls all appear in Weave as separate root Calls, which makes the trace hierarchy hard to follow. To get correct nesting under the same parent Op, use aThreadPoolExecutor.
- Python
- TypeScript
The following code sample demonstrates the use of
ThreadPoolExecutor.
The first function, func, is a simple Op that takes x and returns x+1. The second function, outer, is another Op that accepts a list of inputs.
Inside outer, the use of ThreadPoolExecutor and exc.map(func, inputs) means that each call to func still carries the same parent trace context.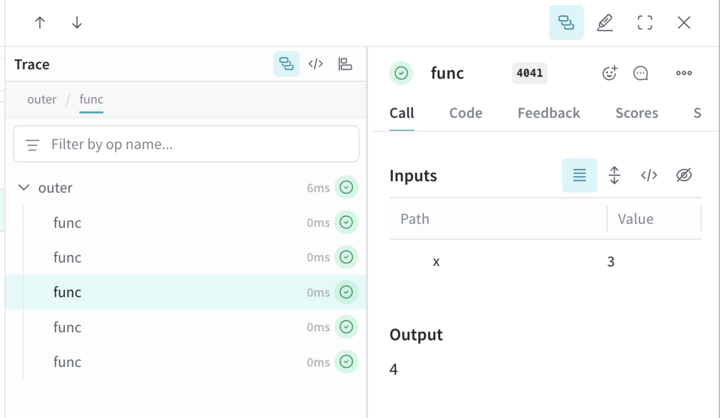
Manual Call tracking
If neither automatic integration nor theweave.op decorator fits your workflow, you can manually create Calls using the API directly. This approach gives you full control over when a Call starts and ends, at the cost of more boilerplate.
- Python
- TypeScript
- HTTP API