

Access the Compare evaluations view
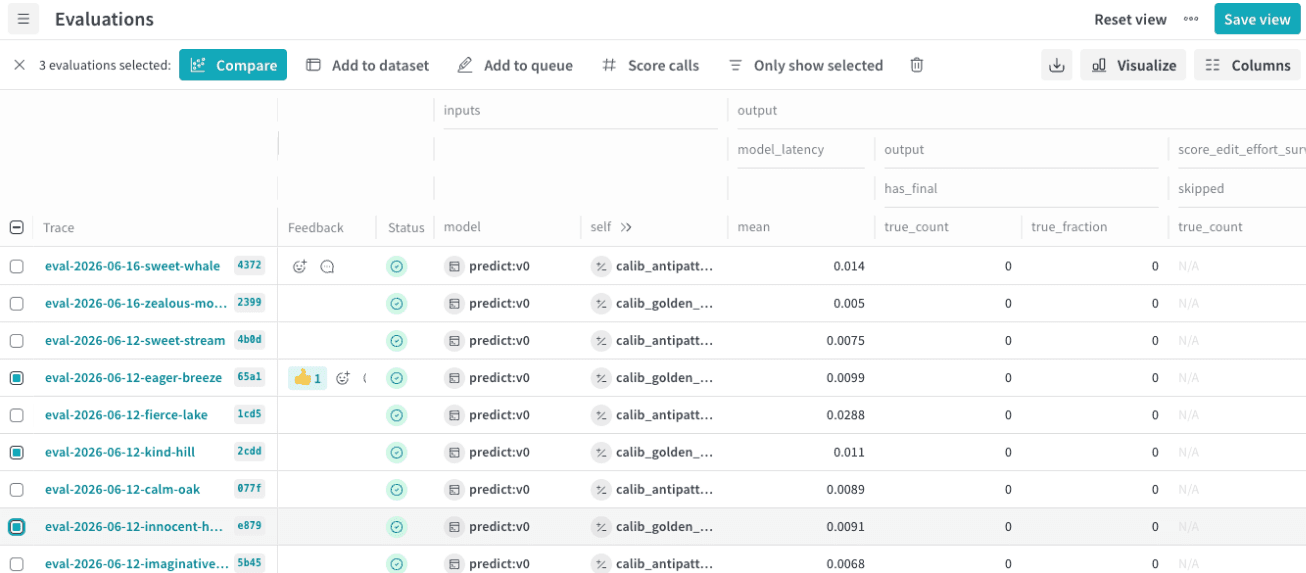
To open the Compare evaluations view:- In the Weave project sidebar, select Evals.
- In the evaluations table, select the checkboxes for two or more evaluations that you want to compare.
- In the evaluation table toolbar, select Compare.
Review the comparison
The Compare evaluations view has two tabs:- Summary: Aggregate charts for each metric on the compared evaluations, followed by a properties and metrics table.
- Dataset results: A per-example results table for comparing outputs row by row, plus scatter plots for spotting divergences when you compare two evaluations.
Summary tab
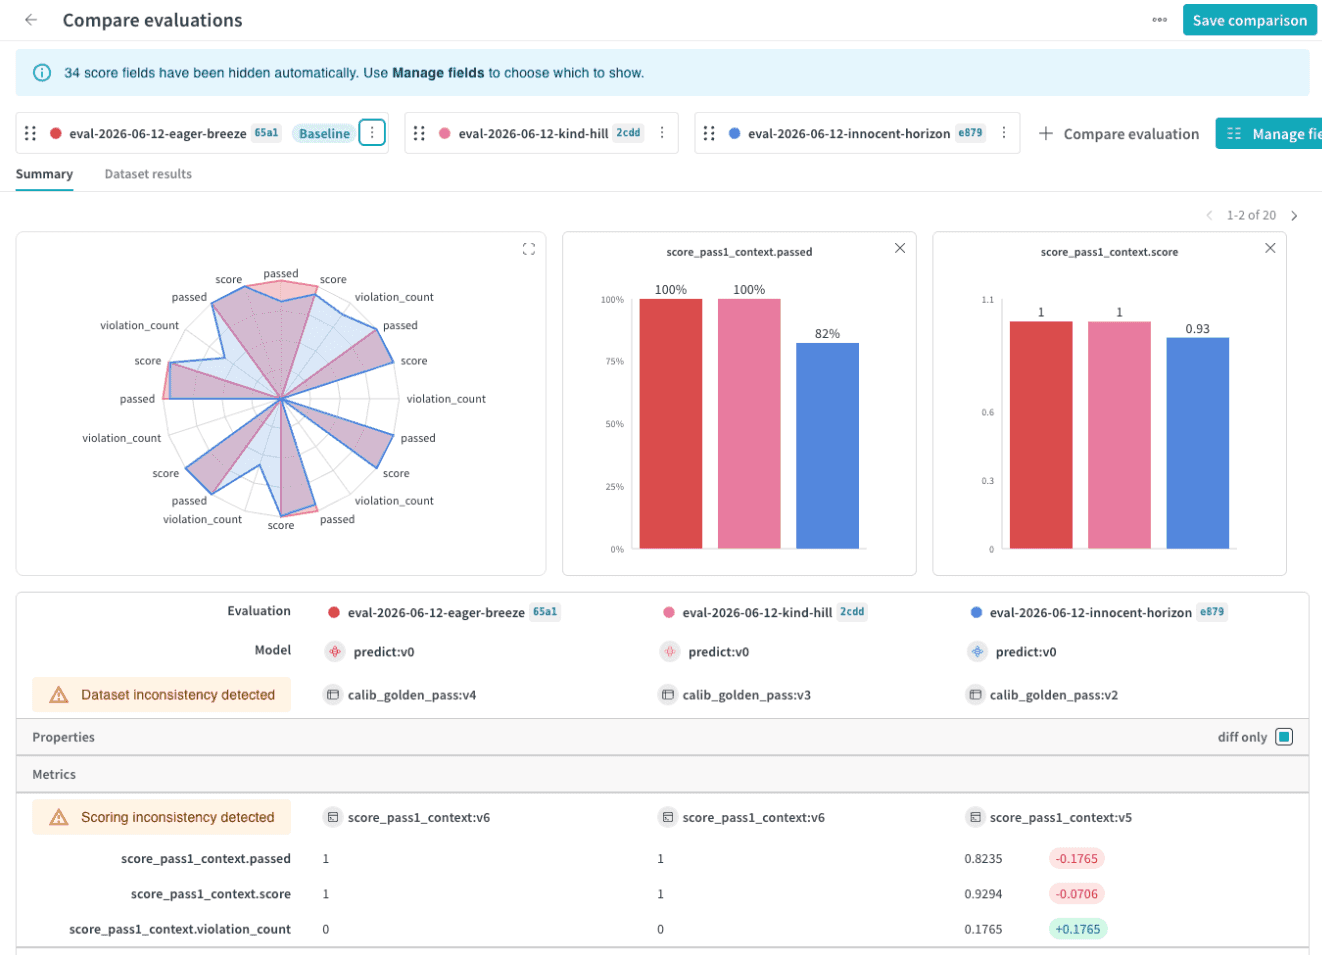
The Summary tab opens by default. It contains two areas:- Charts: A radar chart that plots all metric values across the compared evaluations, followed by per-metric charts (bar charts for numeric metrics and coverage charts for pass/fail metrics).
- Properties and metrics table: A table below the charts that lists each evaluation’s configuration and aggregate scores.
- Evaluation: The evaluation ID.
- Model: The model version scored by the evaluation.
- Dataset: The dataset version used to run the evaluation.
- Properties: Any additional properties recorded on the evaluation.
- Metrics: The aggregate value for each metric produced by the evaluation’s scorers.
- Dataset inconsistency detected: The dataset varies across the compared evaluations. Aggregate metrics may not be directly comparable, and the Dataset results tab is limited to examples in the intersection of the datasets.
- Scoring inconsistency detected: The scorer varies across the compared evaluations. The scoring logic differs between evaluations, so compare the results with care.
Dataset results tab
Select Dataset results to compare individual dataset examples across the selected evaluations. Each row corresponds to one dataset example and shows the dataset input alongside each evaluation’s output and scorer metrics, so you can inspect where a specific example diverges. Select a row to open a side-by-side detail view. When you compare exactly two evaluations, the tab shows two scatter plots above the table. In each plot, a point represents a dataset example, positioned by its metric value in each of the two evaluations, so examples where the evaluations diverge stand out. Select (brush) a region of points to filter the examples shown in the table, and use the Dimension menu on each plot to choose which metric it plots. The Dataset results tab requires that the compared evaluations share dataset rows. If their datasets have no rows in common, no results table is displayed.Customize the Compare evaluations view
In the Compare evaluations view, you can adjust how evaluations are ordered and which evaluations are included in the comparison. The following sections describe the available actions.Set a baseline
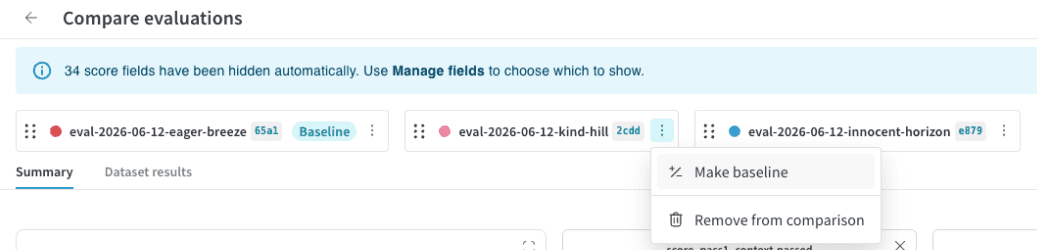
By default, the leftmost evaluation in the comparison bar is the baseline, and every other evaluation is compared against it. You can designate a different evaluation as the baseline when you want a specific evaluation as the reference point for all comparisons. To set an evaluation as the baseline:- In the comparison bar, hold the pointer over the evaluation that you want to set as the baseline.
-
Click the action () menu to the right of the ID.
-
In the list, select Make baseline. The UI refreshes with the baseline evaluation in the leftmost position in the comparison bar and
Baselinenext to the ID.
Change the comparison order
Drag the evaluations in the comparison bar to reorder them. This also reorders the corresponding columns in the comparison table. To change the comparison order:- In the comparison bar, hold the pointer over the ID that you want to reorder.
- Click and hold the six dots to the left of the ID and drag it to the left or the right as needed.
- Place the ID in the desired ordering. The comparison data refreshes with an updated comparison ordering.
Remove from comparison
This option is only available when comparing three or more evaluations. To remove an evaluation from the comparison:- In the comparison bar, find the evaluation that you want to remove from the comparison.
- Click the action () menu to the right of the ID.
- In the list, select Remove from comparison. The UI refreshes with an updated table that no longer includes the removed evaluation.