Decide how users install W&B
Before you start, decide whether W&B should be a required dependency or an optional feature of your library. This choice affects how you import the W&B Python SDK (wandb), how you document installation, and how you handle environments where wandb isn’t present.
Require W&B as a dependency
If W&B is central to your library’s functionality, addwandb to your dependencies so that it’s installed automatically alongside your library:
Make W&B optional on installation
If W&B is an optional feature, allow your library to run without it installed so that users who don’t need experiment tracking can still use your code. You can either importwandb conditionally in Python or declare it as an optional dependency in pyproject.toml.
- Python
- pyproject.toml
Detect whether
wandb is available and raise a clear error if a user enables W&B features without installing it:Authenticate users
W&B uses API keys to authenticate users and machines. Before users can log runs from your library, they must generate an API key and make it available to thewandb client.
Create an API key
An API key authenticates a client or machine to W&B. Generate an API key from your user profile so that you can use it for the login steps that follow.For a more streamlined approach, go to User Settings and create an API key. Copy the API key immediately and save it in a secure location such as a password manager.
- Click your user profile icon in the upper right corner.
- Select User Settings, then scroll to the API Keys section.
Install and log in to W&B
After you have an API key, install thewandb library locally and log in so that subsequent runs can authenticate to W&B. Choose the tab that matches your environment.
- Command Line
- Python
- Python notebook
-
Set the
WANDB_API_KEYenvironment variable to your API key. Replace values enclosed in<>with your own: -
Install the
wandblibrary and log in:
Start a run
After you set up authentication, the next step is to start a W&B run so that your library has somewhere to log metrics, configs, and artifacts. A run represents a single unit of computation, such as a training experiment. Most libraries create one run per training job. For more information about runs, see W&B Runs. Initialize a run withwandb.init() and specify a name for your project and your team entity (team name). If you don’t specify a project, W&B stores your run in a default project called “uncategorized”. Replace values enclosed in <> with your own:
run.finish() to close the run and log all the data to W&B. Closing the run guarantees that all metrics, configs, and artifacts are uploaded before the process exits.
Set wandb as an optional dependency
If you want to make wandb optional at runtime, so that users can run your library without producing W&B runs, use one of the following approaches:
- Define a
wandbflag. - Set
wandbto bedisabledinwandb.init(). - Set
wandbto be offline. This still runswandb, but doesn’t communicate back to W&B over the internet.
wandb flag such as:
- Python
- Bash
wandb to be disabled in wandb.init():
- Python
- Bash
wandb to be offline:
- Environment Variable
- Bash
Define a run config
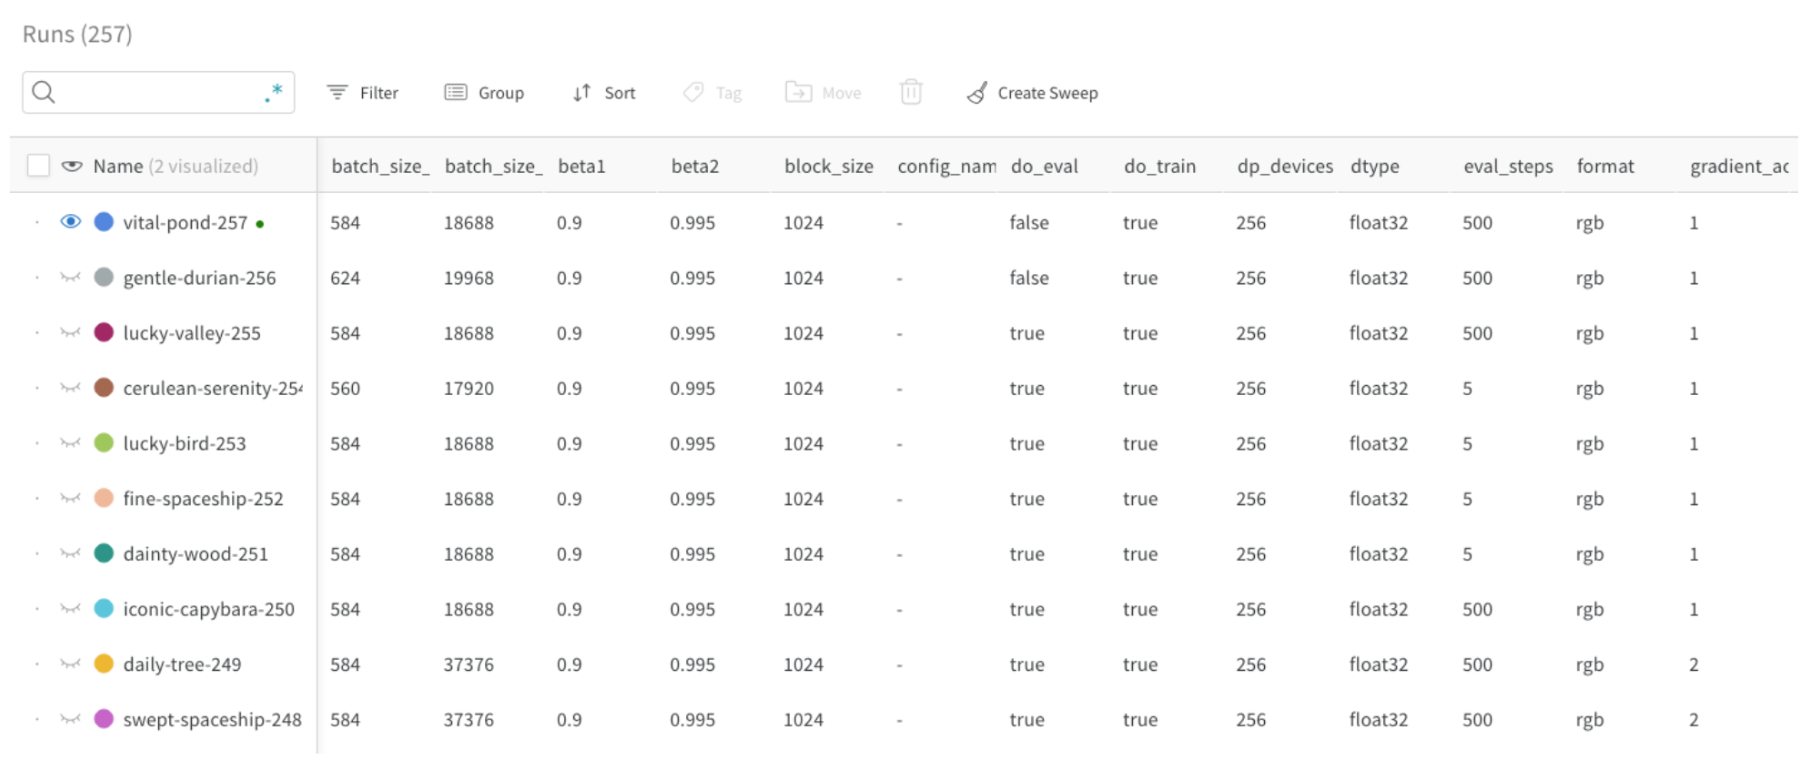
After you initialize a run, you can attach a configuration dictionary that records the hyperparameters and other metadata associated with that run. Logging a config makes runs easier to compare, filter, and reproduce later. Provide a configuration dictionary when you initialize your run to log hyperparameters and other metadata to W&B. Use W&B to compare runs based on their config parameters and filter them in the Runs table. You can also use these parameters to group runs together in W&B. For example, in the following image, the batch size (batch_size) is defined as a config parameter and is visible (see first column) in the Runs table. This lets users filter and compare runs based on their batch size:
- Model name, version, architecture parameters, and hyperparameters.
- Dataset name, version, number of training or validation examples.
- Training parameters such as learning rate, batch size, and optimizer.
Update the run config
Some configuration values, such as model parameter counts, might not be known when you callwandb.init(). If values aren’t available at initialization time, update the config later with wandb.Run.config.update. For example, you might want to add a model’s parameters after you instantiate the model:
Log metrics and data
After you start and configure a run, you can begin logging metrics and other data so that W&B records them against the run.Log metrics
To log scalar metrics such as loss or accuracy, create a dictionary where each key is the name of a metric. Pass this dictionary object towandb.Run.log() to log it to W&B:
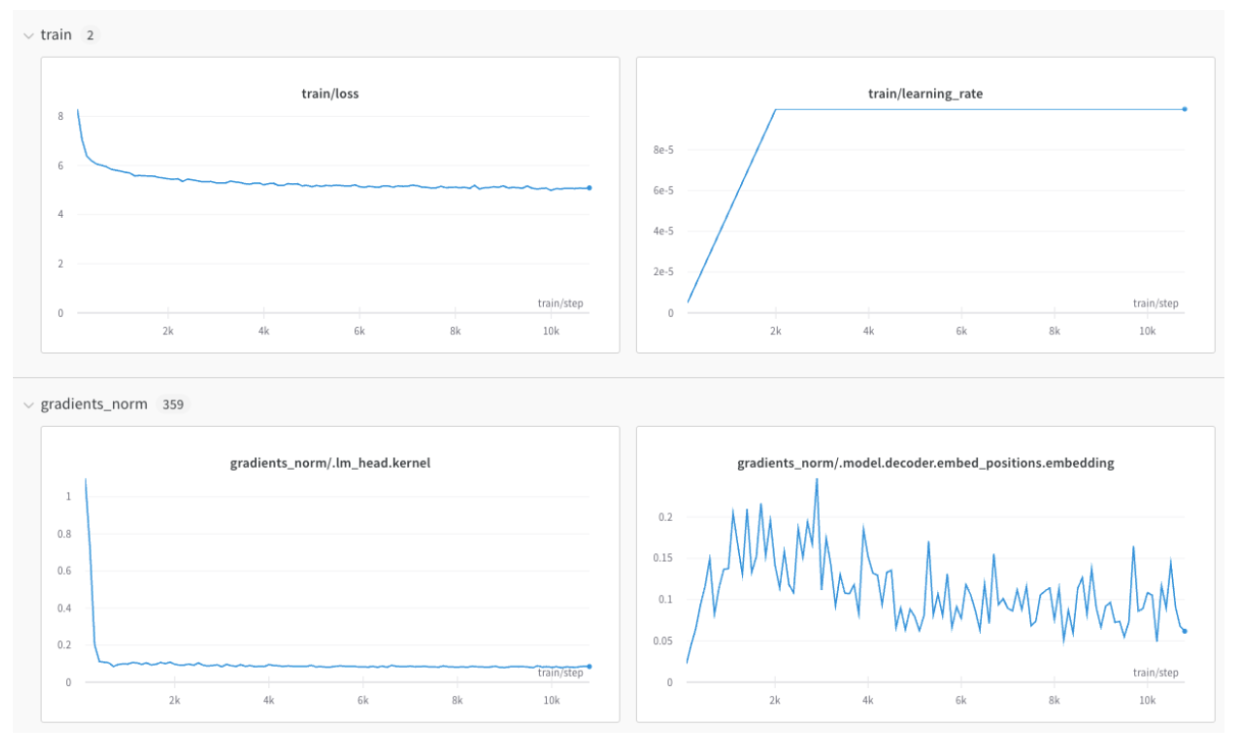
train/ and val/ for training and validation metrics, respectively, but you can use any prefix that makes sense for your use case.
This creates separate sections in your project’s workspace for your training and validation metrics, or other metric types you’d like to separate:
wandb.Run.log().
Control the x-axis
By default, the W&B Python SDK manages its own step counter, which might not match the step semantics of your training loop. If you perform multiple calls towandb.Run.log() for the same training step, the wandb SDK increments an internal step counter for each call to wandb.Run.log(). This counter might not align with the training step in your training loop.
To avoid this situation, define your x-axis step explicitly with wandb.Run.define_metric(), one time, immediately after you call wandb.init():
*, means that every metric uses global_step as the x-axis in your charts. If you only want certain metrics logged against global_step, you can specify them instead:
step metric, and your global_step each time you call wandb.Run.log():
global_step isn’t available during your validation loop), W&B automatically uses the previously logged value for global_step. In this case, ensure you log an initial value for the metric so that it’s defined when it’s needed.
Log media and structured data
In addition to scalars, you can log images, tables, text, audio, video, and more. Logging media alongside metrics helps users inspect qualitative model behavior over time. Some considerations when logging data include:- How often should the metric be logged? Should it be optional?
- What type of data could be helpful in visualizing?
- For images, you can log sample predictions and segmentation masks to see the evolution over time.
- For text, you can log tables of sample predictions for later exploration.
Support distributed training
If your library can run training across multiple processes or machines, decide how W&B should behave in that setting so that logs are coherent and not duplicated. For frameworks that support distributed environments, you can adapt any of the following workflows:- Log only from the main process (recommended).
- Log from every process and group runs using a shared
groupname.
Track models and datasets with artifacts
In addition to metrics, you can persist the models and datasets your library produces or consumes so that users can reproduce and compare runs. Use W&B Artifacts to track and version models and datasets. Artifacts provide storage and versioning for machine learning assets, and they automatically track lineage to show how data and models are related.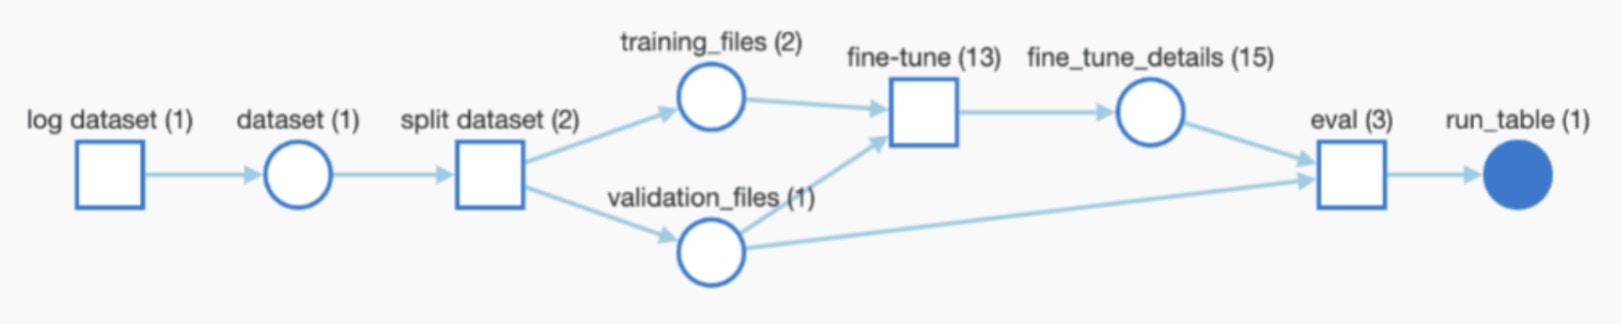
- Whether to log model checkpoints or datasets as artifacts (in case you want to make it optional).
- Artifact input references (for example,
entity/project/artifact). - Logging frequency of model checkpoints or datasets. For example, every epoch or every 500 steps.
Log model checkpoints
Logging model checkpoints as artifacts lets users recover, version, and share trained weights. A common approach is to log checkpoints as artifacts using the unique run ID that W&B generates as part of the artifact name.Log input artifacts
To capture lineage between data and models, log the datasets or pretrained models that a run consumes as inputs:wandb.Run.use_artifact() call associates the artifact with the current run so that W&B can track the lineage of the dataset used in the run.
Download artifacts
After you log artifacts, you can download previously logged artifacts from W&B to use in training or inference code. The right approach depends on whether you already have an active run. If you have a run context, usewandb.Run.use_artifact() to reference an artifact in W&B and then call wandb.Artifact.download() to download it to a local directory. Using wandb.Run.use_artifact() also records the artifact as an input to the current run, preserving lineage.