pip install before you run your YOLO experiments.
All W&B logging features are compatible with data-parallel multi-GPU training, such as with PyTorch DDP.
Track core experiments
To get started, install the W&B Python SDK (wandb) alongside YOLOv5 and run training as usual. By installing wandb, you activate the built-in W&B logging features: system metrics, model metrics, and media logged to interactive Dashboards.
Customize the integration
Once experiment tracking is working, you can enable additional W&B features (such as model versioning, dataset versioning, and prediction visualization) by passing a few command-line arguments to YOLO.- If you pass a number to
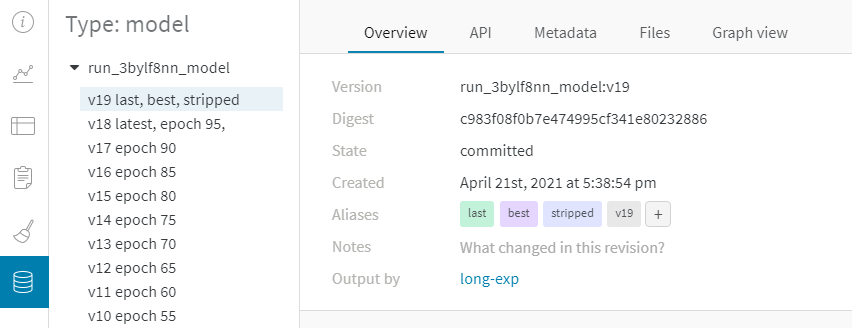
--save_period, W&B saves a model version at the end of everysave_periodepochs. The model version includes the model weights and tags the best-performing model in the validation set. - Turning on the
--upload_datasetflag also uploads the dataset for data versioning. - Passing a number to
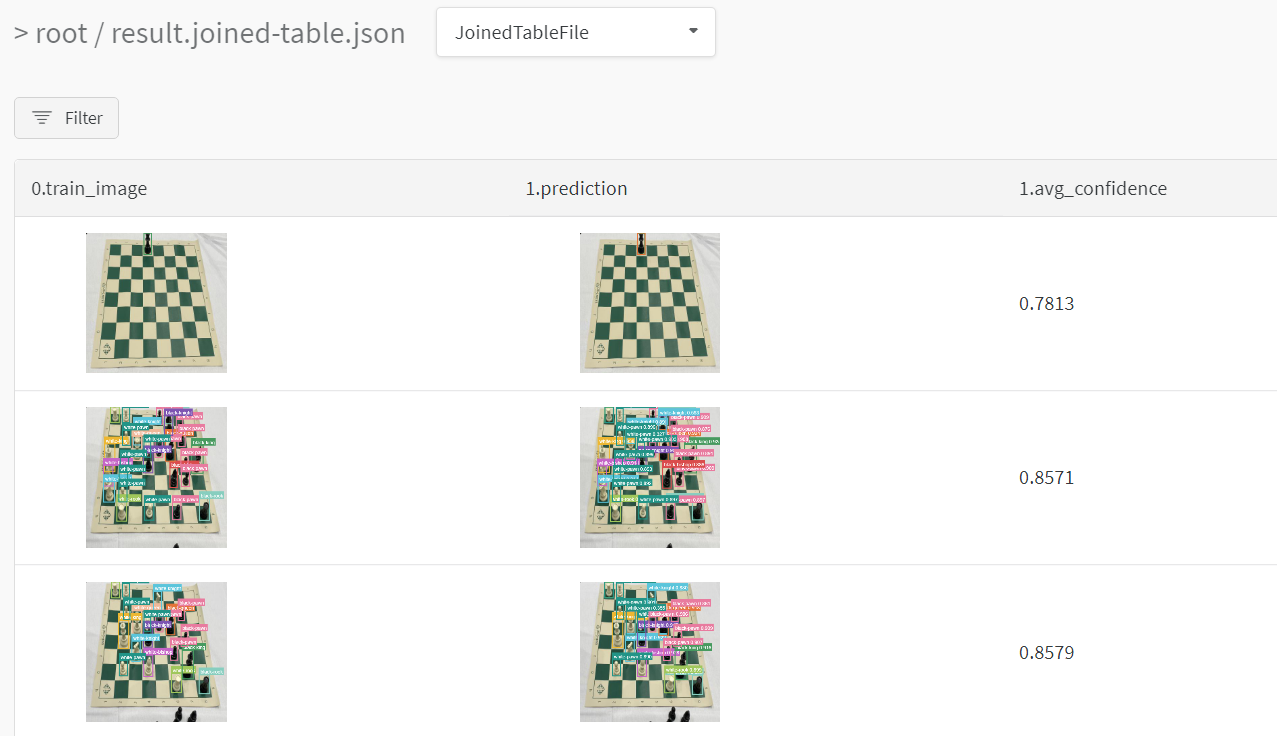
--bbox_intervalturns on data visualization. At the end of everybbox_intervalepochs, W&B uploads the outputs of the model on the validation set.
- Model versioning only
- Model versioning and data visualization
Every W&B account comes with 100 GB of free storage for datasets and models.
With data and model versioning, you can resume paused or crashed experiments from any device, no setup necessary. See the Colab for details.