W&B Report and Workspace API is in Public Preview.
Run the Programmatic workspaces notebook for an end-to-end tutorial of creating a customized saved workspace view.
To programmatically edit a report, you must have the W&B Report and Workspace API (
wandb-workspaces) installed along with the W&B Python SDK:Add plots
Plots let you visualize run data inside a report. Each panel grid has a set of run sets and a set of panels. The run sets in the panel grid control what data appears on the panels in the grid. Create a new panel grid if you want to add charts that pull data from a different set of runs.- App UI
- Report and Workspace API
Enter a forward slash (
/) in the report to display a dropdown menu. Select Add panel to add a panel. You can add any panel that W&B supports, including a line plot, scatter plot, or parallel coordinates chart.Add run sets
Add run sets from projects interactively with the App UI or the W&B SDK.- App UI
- Report and Workspace API
Enter a forward slash (
/) in the report to display a dropdown menu. From the dropdown, choose Panel Grid. W&B automatically imports the run set from the project the report was created from.If you import a panel into a report, the report inherits the run names from the project. In the report, you can optionally rename a run to give the reader more context. The rename applies only to the individual panel. If you clone the panel in the same report, the cloned panel also reflects the new name.- In the report, click the pencil icon to open the report editor.
-
In the run set, find the run to rename. Hover over the run name and click the action () menu. Select one of the following choices, then submit the form.
- Rename run for project: Rename the run across the entire project. To generate a new random name, leave the field blank.
- Rename run for panel grid: Rename the run only in the report, preserving the existing name in other contexts. You can’t generate a new random name with this option.
- Click Publish report.
Freeze a run set
A report automatically updates run sets to show the latest data from the project. Freeze a run set to preserve its state in a report at a specific time, so that later runs don’t change what the report displays. To freeze a run set when viewing a report, click the snowflake icon in its panel grid near the Filter button.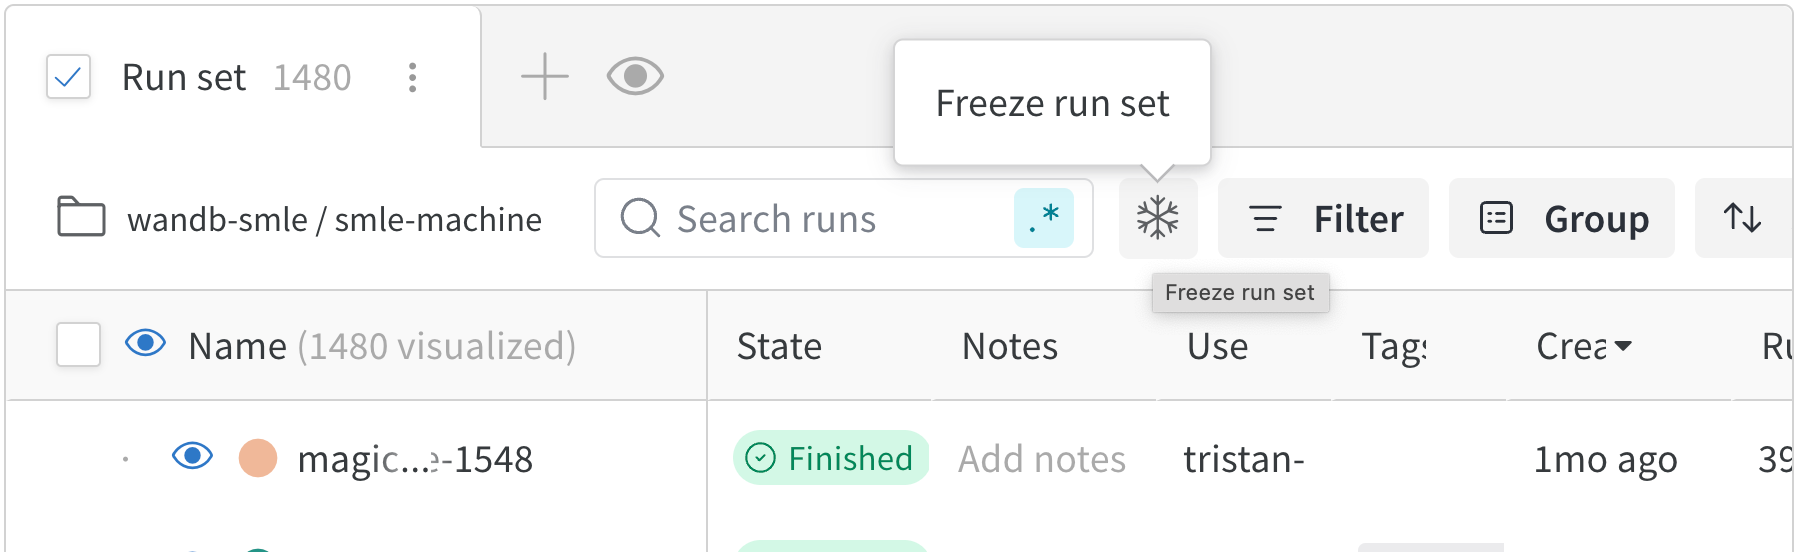
Group a run set programmatically
Group runs in a run set programmatically with the Workspace and Reports API. Grouping organizes related runs together in panels, which makes comparing configurations and results easier. You can group runs in a run set by config values, run metadata, or summary metrics. The following table lists the available grouping methods along with the available keys for each grouping method:Group runs by config values
Group runs by config values to compare runs with similar configurations. Config values are parameters you specify in your run configuration(wandb.init(config=)). To group runs by config values, use the config.[KEY] syntax, where [KEY] is the name of the config value you want to group by.
For example, the following code snippet first initializes a run with a config value for group, then groups runs in a report based on the group config value. Replace [ENTITY] and [PROJECT] with your W&B entity and project names.
config.group value:
Group runs by run metadata
Group runs by metadata to organize them based on intrinsic run properties rather than logged values. You can group by a run’s name (Name), state (State), or job type (JobType).
Continuing from the previous example, you can group your runs by their name with the following code snippet:
The name of the run is the name you specify in the
wandb.init(name=) parameter. If you don’t specify a name, W&B generates a random name for the run.You can find the name of the run in the Overview page of a run in the W&B App or programmatically with Api.runs().run.name.Group runs by summary metrics
The following examples demonstrate how to group runs by summary metrics. Summary metrics are the values you log to a run withwandb.Run.log(). After you log a run, you can find the names of your summary metrics in the W&B App under the Summary section of a run’s Overview page.
The syntax for grouping runs by summary metrics is summary.[KEY], where [KEY] is the name of the summary metric you want to group by.
For example, suppose you log a summary metric called acc. Replace [ENTITY] and [PROJECT] with your W&B entity and project names:
summary.acc summary metric:
Filter a run set programmatically
Programmatically filter run sets and add them to a report with the Workspace and Reports API. Filtering narrows a run set to the specific runs you want to display, based on config values, metrics, tags, or run properties. The general syntax for a filter expression is:[KEY] is the name of the filter, operation is a comparison operator (for example, >, <, ==, in, not in, or, and and), and [VALUE] is the value to compare against. Filter is a placeholder for the type of filter you want to apply. The following table lists the available filters and their descriptions:
After you define your filters, you can create a report and pass the filtered run sets to
wr.PanelGrid(runsets=). See the Report and Workspace API tabs throughout this page for more information about how to add different elements to a report programmatically.
The following examples demonstrate how to filter run sets in a report. Replace values enclosed in brackets (for example, [ENTITY] and [PROJECT]) with your own values.
Config filters
Filter a run set by one or more config values. Config values are parameters you specify in your run configuration (wandb.init(config=)).
For example, the following code snippet first initializes a run with a config value for learning_rate and batch_size, then filters runs in a report based on the learning_rate config value.
0.01.
and operator:
Metric filters
Filter run sets based on a run’s tag (tags), run state (state), run name (displayName), or job type (jobType).
Metric filters use a different syntax than other filters. You must pass values as a list.run1, run2, and run3, you can use the following code:
You can find the name of the run in the Overview page of a run in the W&B App or programmatically with
Api.runs().run.name.finished, crashed, or running):
SummaryMetric filters
Filter a run set by summary metrics to focus on runs that meet specific outcome thresholds, such as accuracy or loss values. Summary metrics are the values you log to a run withwandb.Run.log(). After you log a run, you can find the names of your summary metrics in the W&B App under the Summary section of a run’s Overview page.
Tags filters
Filter a run set by tags to show only runs that you’ve labeled with a particular tag. Tags are values you add to a run (programmatically or with the W&B App).Add code blocks
Add code blocks to share configuration, examples, or snippets alongside your results. You can add them interactively with the App UI or programmatically with the W&B SDK.- App UI
- Report and Workspace API
Enter a forward slash (
/) in the report to display a dropdown menu. From the dropdown, choose Code.Select the name of the programming language in the code block to expand a dropdown. From the dropdown, select your programming language syntax. You can choose from JavaScript, Python, CSS, JSON, HTML, Markdown, and YAML.Add markdown
Add markdown to format narrative text, headings, and inline emphasis in your report. You can add markdown interactively with the App UI or programmatically with the W&B SDK.- App UI
- Report and Workspace API
Enter a forward slash (
/) in the report to display a dropdown menu. From the dropdown, choose Markdown.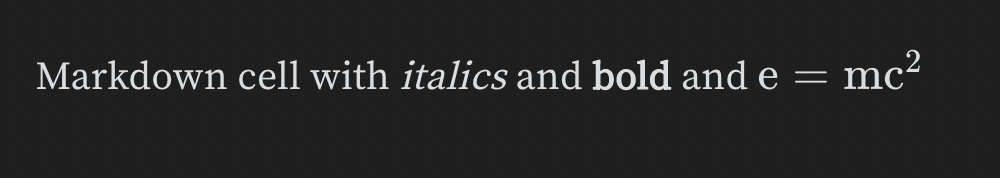
Add HTML elements
Add HTML elements such as headings and lists to structure your report. You can add them interactively with the App UI or programmatically with the W&B SDK.When you log an image with
wandb.Image, W&B saves the file under a generated name that includes a content hash, such as media/images/[key]_[step]_[hash].png, instead of the original filename. As a result, an <img> tag or markdown image that references the original filename doesn’t resolve. To embed a logged image in a report, log the image first, then use the generated file path as the image’s src value.- App UI
- Report and Workspace API
Enter a forward slash (
/) in the report to display a dropdown menu. From the dropdown, select a type of text block. For example, to create an H2 heading block, select the Heading 2 option.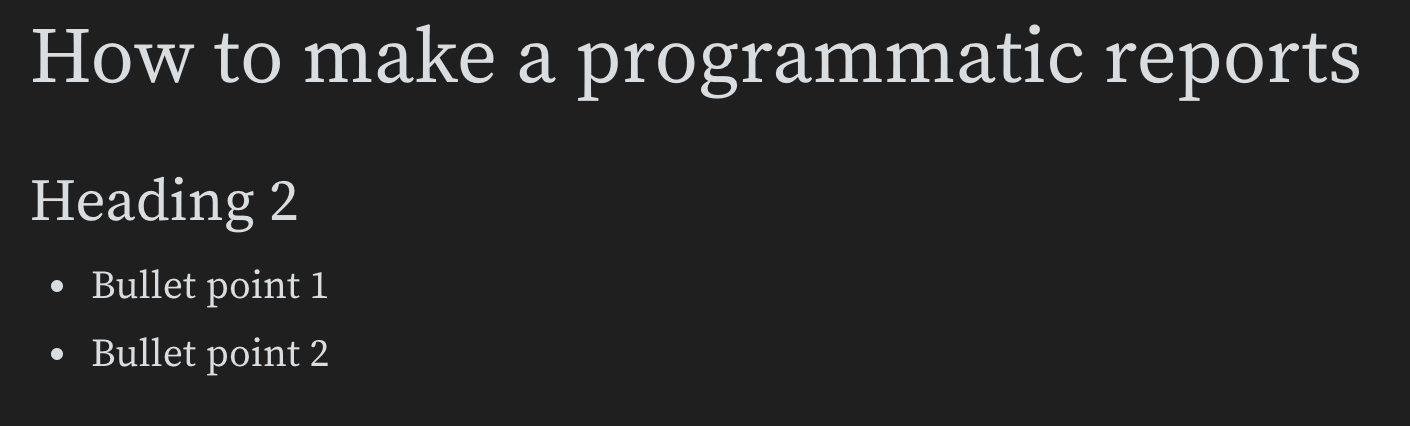
Embed rich media links
Embed rich media such as tweets, videos, and audio to enrich your report with external context. You can embed rich media with the App UI or with the W&B SDK.- App UI
- Report and Workspace API
Copy and paste URLs into reports to embed rich media within the report. The following animations demonstrate how to copy and paste URLs from Twitter, YouTube, and SoundCloud.Twitter
Copy and paste a Tweet link URL into a report to view the Tweet within the report.
YouTube
Copy and paste a YouTube video URL link to embed a video in the report.SoundCloud
Copy and paste a SoundCloud link to embed an audio file into a report.Duplicate panel grids
Duplicate a panel grid to reuse its layout in the same report or in a different report. Select a panel grid and copy-paste it to duplicate it in the same report or paste it into a different report. Highlight a whole panel grid section by selecting the drag handle in the upper right corner. Click and drag to highlight and select a region in a report such as panel grids, text, and headings.
Delete panel grids
Delete a panel grid when you no longer need its layout or content in the report. Select a panel grid and pressdelete on your keyboard to delete a panel grid.
Collapse headers to organize reports
Collapse headers in a report to hide content within a text block. When the report loads, only expanded headers show content. Collapsing headers in reports helps organize your content and prevents loading more data than you need. The following animation demonstrates the process.
Visualize relationships across multiple dimensions
When you want to surface relationships between three or more variables in a single chart, a standard 2D plot can be limiting. To compare more variables than a 2D plot can show, you can use a color gradient as an additional dimension. Using a color gradient to represent one of the variables can make patterns easier to interpret.- Choose a variable to represent with a color gradient, like penalty scores or learning rates. This provides a clearer understanding of how penalty (color) interacts with reward or side effects (y-axis) over training time (x-axis).
- Highlight key trends. Hover over a specific group of runs to highlight them in the visualization.