- Training a model and recording metrics such as accuracy and loss
- Conducting hyperparameter tuning and running new experiments
- Conducting a new machine learning experiment with a different model
- Tracking and saving datasets and models as W&B Artifacts
- Downloading and using datasets or models used by other members of your team as W&B Artifacts
wandb.init() method from the W&B Python SDK. This starts a new run and returns a wandb.Run object that you can use to log metrics, artifacts, and other information to the run. For more information about initializing a run, see Initialize runs.
Each run object has a unique identifier known as a run ID. You can specify a unique ID or let W&B randomly generate one for you. Each run object also has a human-readable, non-unique run name. You can specify a name for your run or let W&B randomly generate one for you. You can rename a run after initializing it.
W&B logs your run to a project. You specify the project when you initialize the run with wandb.init(project=""). W&B creates a new project if the project does not exist. If the project does exist, W&B logs the run to the project you specified.
If you do not specify a project name, W&B stores the run in a project called
Uncategorized.wandb.init() returns a wandb.Run object that contains properties of the run, such as its ID, name, configuration, and state. Use the run object to log metrics, artifacts, and other information to the run with methods such as wandb.Run.log(), wandb.Run.log_code(), and wandb.Run.use_artifact().
Each run has a state that describes the current status of the run. See Run states for a full list of possible run states.
View runs and their properties within the run’s project workspace on the W&B App. You can also programmatically access run properties with the wandb.Api.Run object.
As an example, consider the following code snippet that initializes a W&B run and logs some metrics to it:
Pass your W&B entity to the
entity variable in the code snippets below if you want to follow along. Your entity is your W&B username or team name. You can find it in the URL of your W&B App workspace. For example, if your workspace URL is https://wandb.ai/nico/awesome-project, then your entity is nico.awesome-project under the entity nico. The third line logs the accuracy and loss of the model to that run.
Within the terminal, W&B returns:
wandb.Run.log() 10 times. Each time the script calls wandb.Run.log(), W&B logs the accuracy and loss for that epoch.
Within your terminal, you should see output similar to the following:
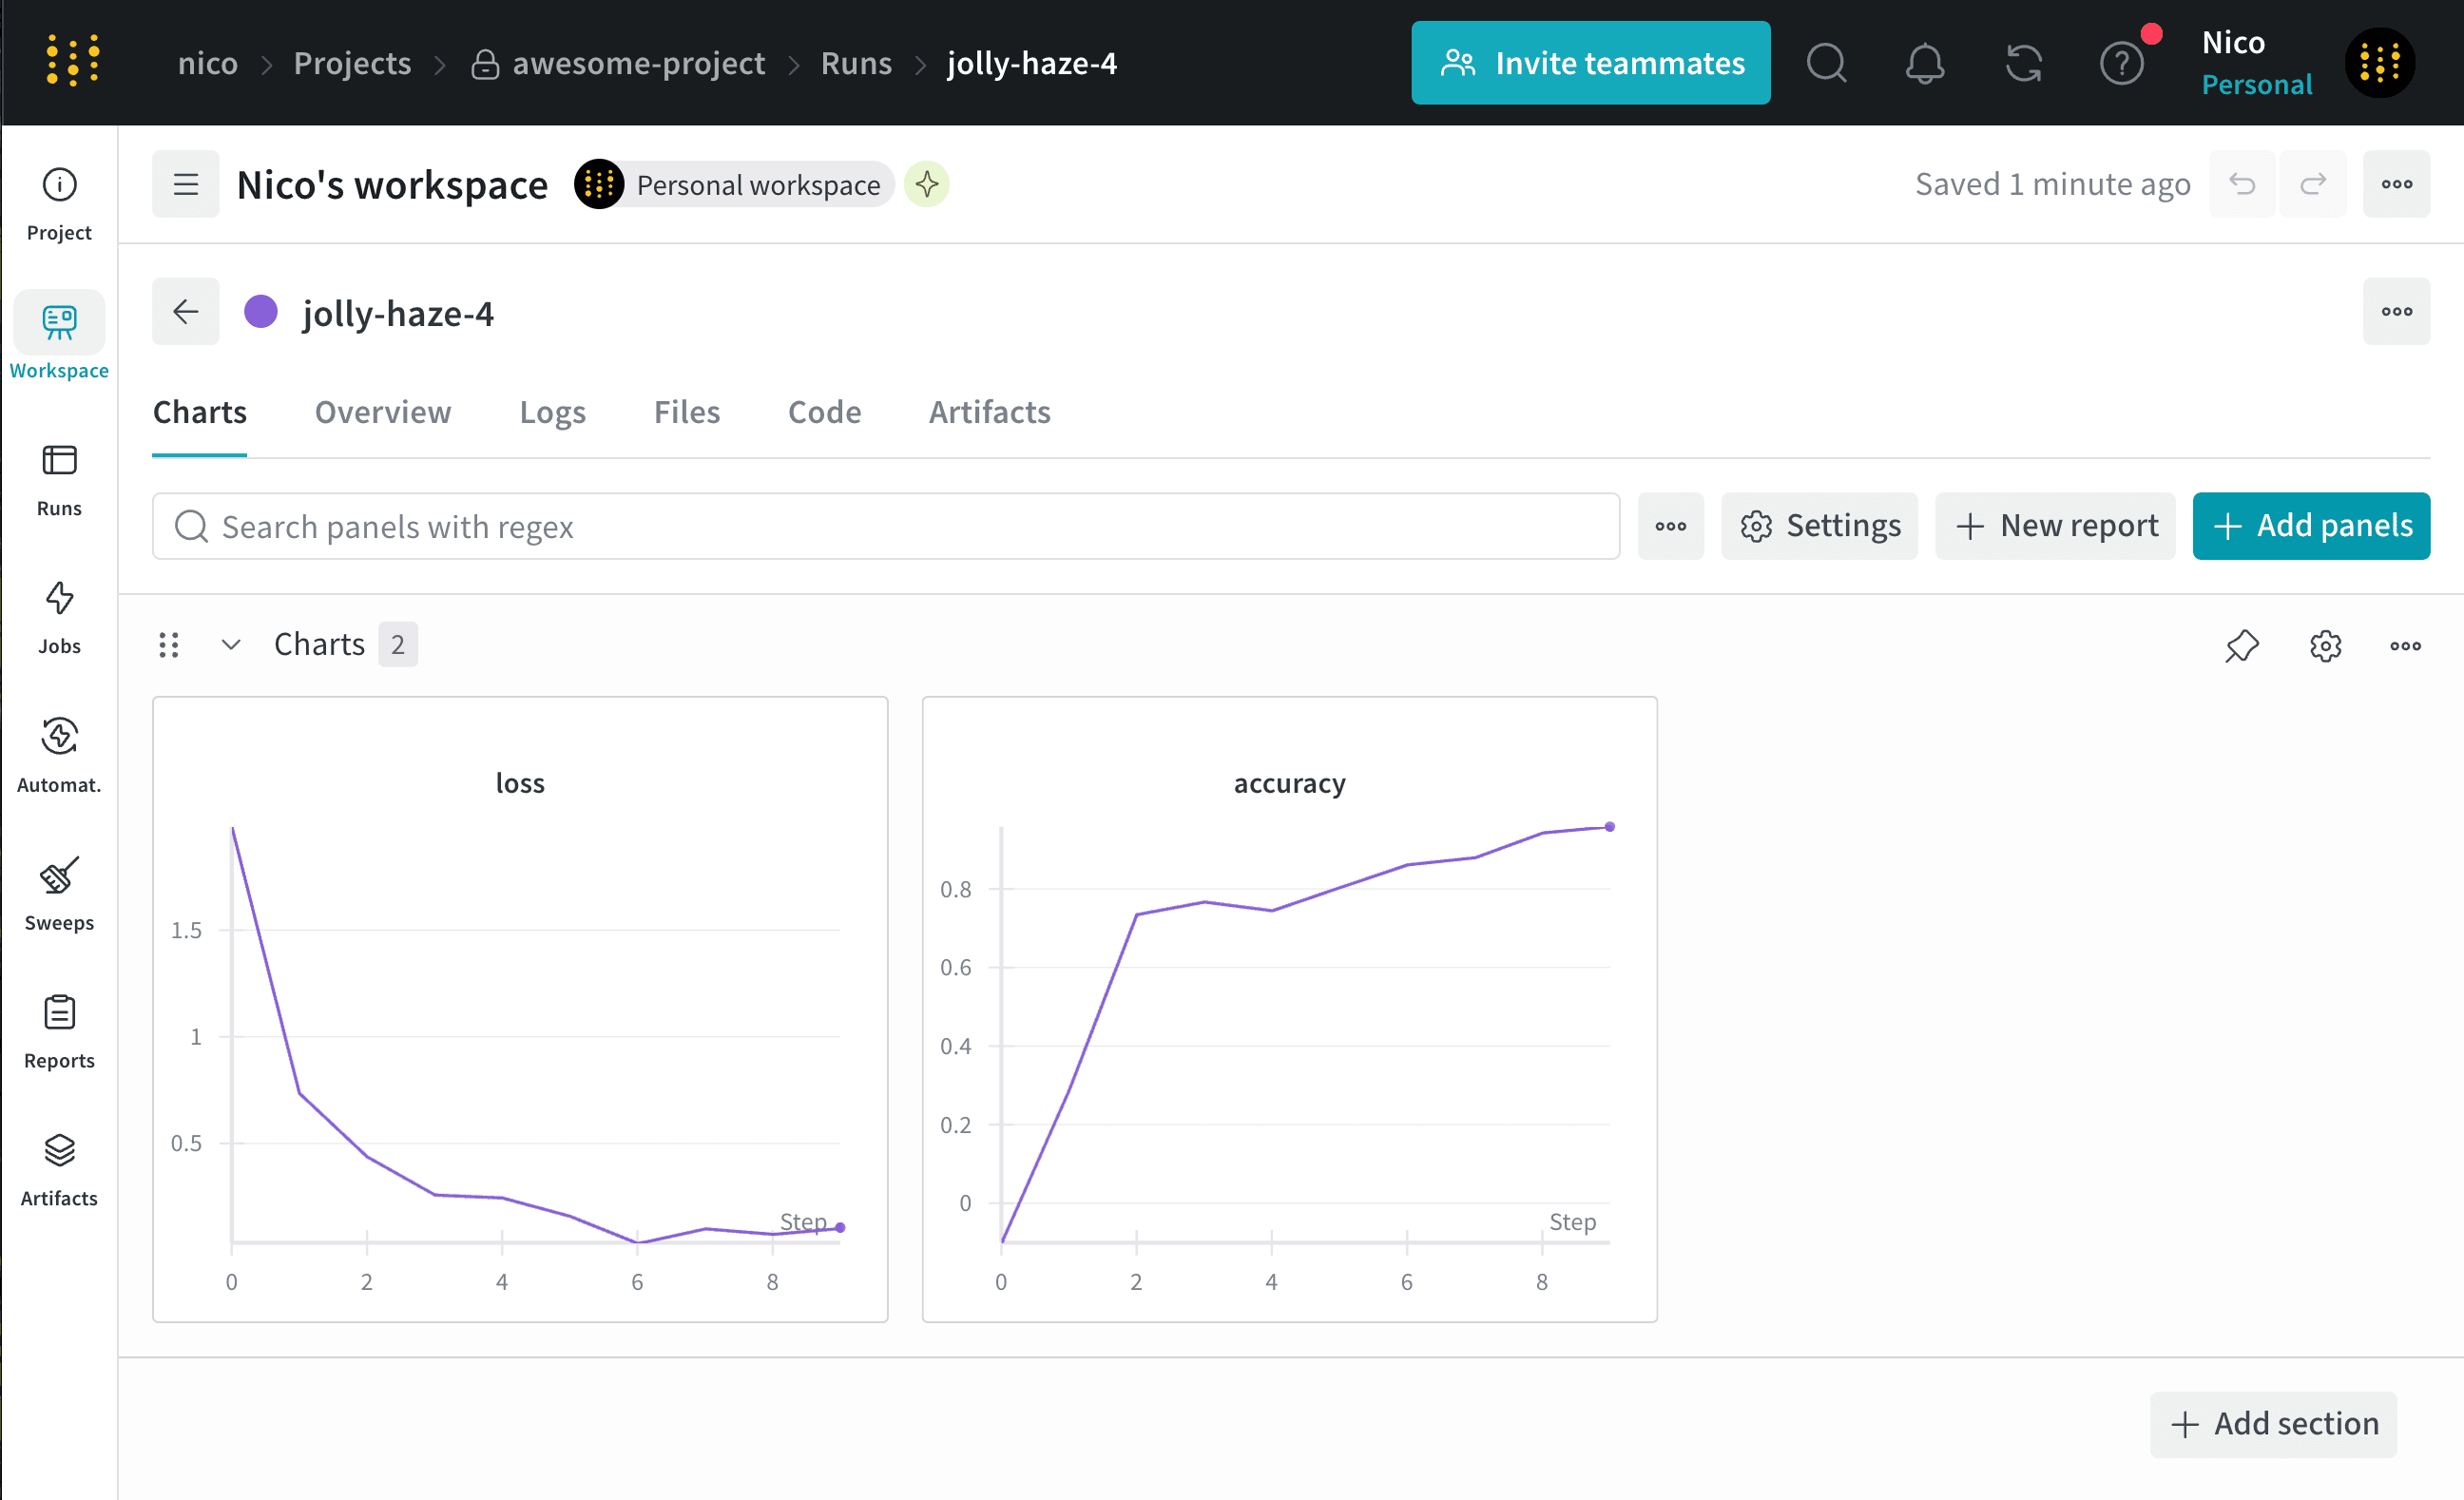
jolly-haze-4. This is because the script calls wandb.init() method only once.
Copy and paste the URL that W&B prints from the previous output into your browser. The URL directs you to the run’s workspace in the W&B App UI. For example, the following image shows the workspace for the run jolly-haze-4: