Common operators by type
The above table shows only a subset of available fields and operators. The expression editor shows all available fields and operators.
Create a filter expression
- Navigate to the Runs tab from the project sidebar.
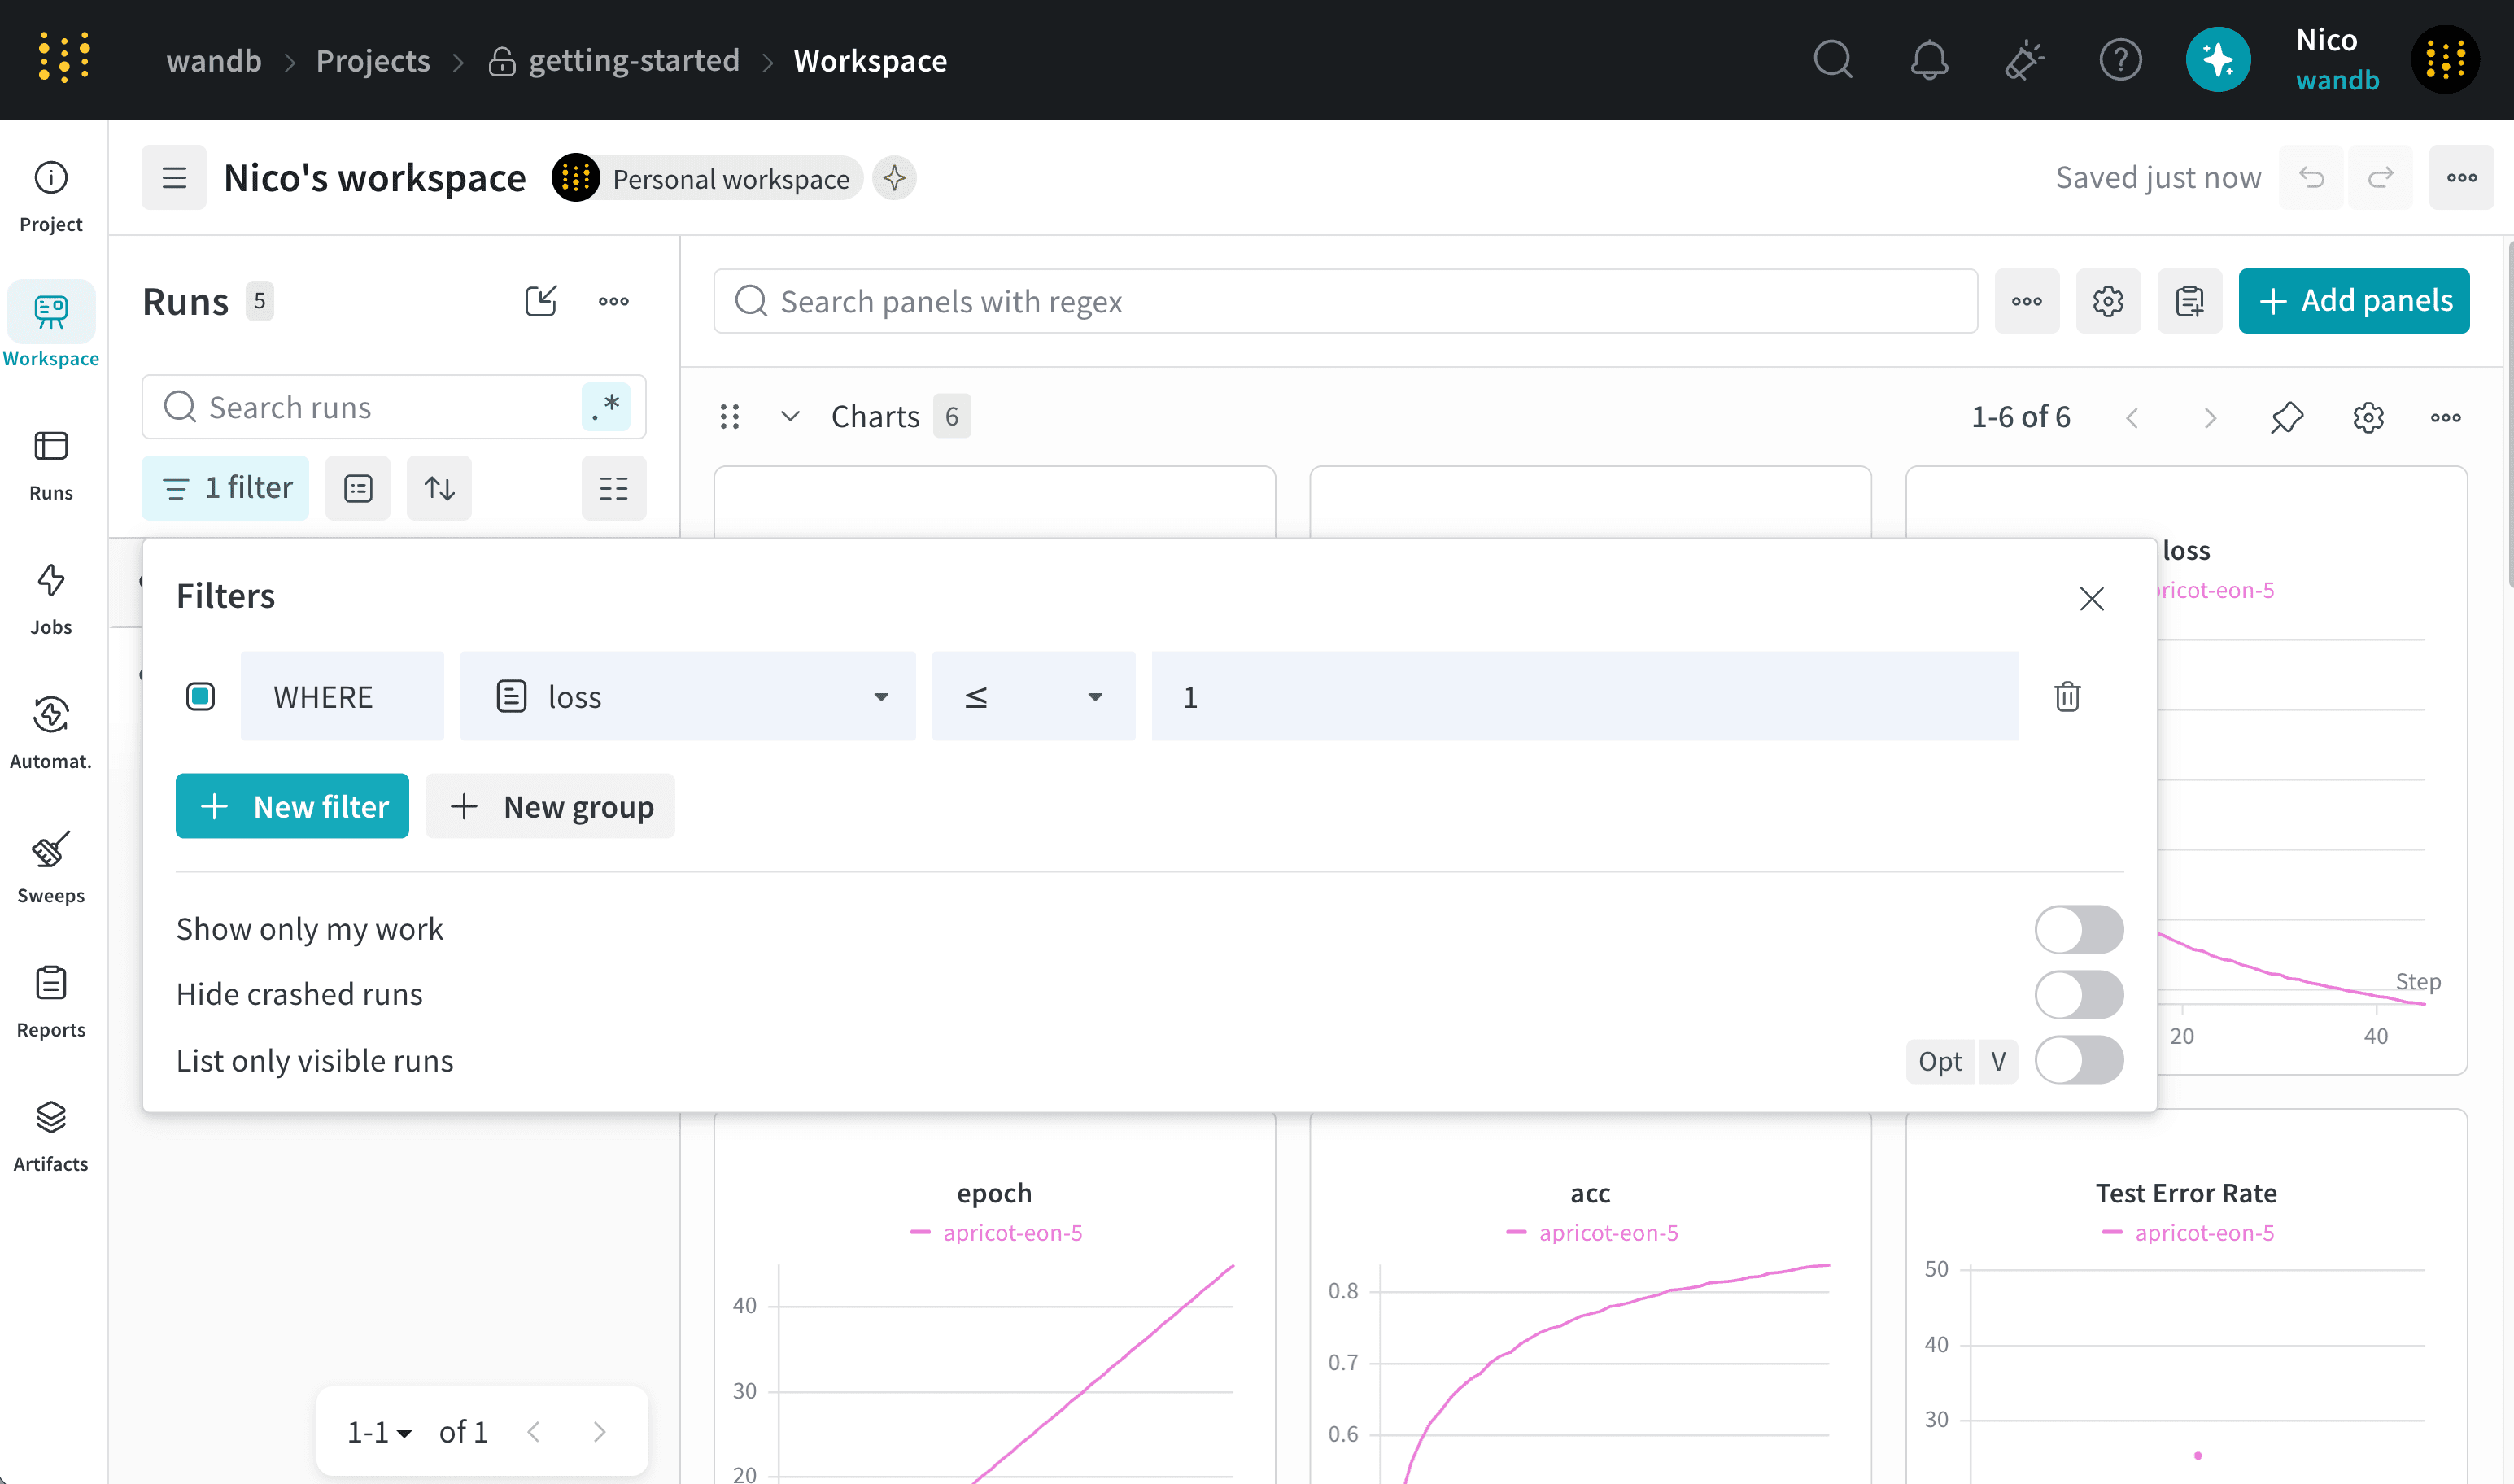
- Select the Filter button, which looks like a funnel, above the runs table.
- From left to right, select a column name, a logical operator, and a filter value to create a filter expression. The filter is applied as soon as you select a filter value.
- Optionally select New Filter to apply additional AND or OR conditions.
- Optionally select New group to group filters together with parentheses. This allows you to create complex filter expressions such as A AND (B OR C).
- Close the filter expression editor by clicking the x icon in the top right corner.
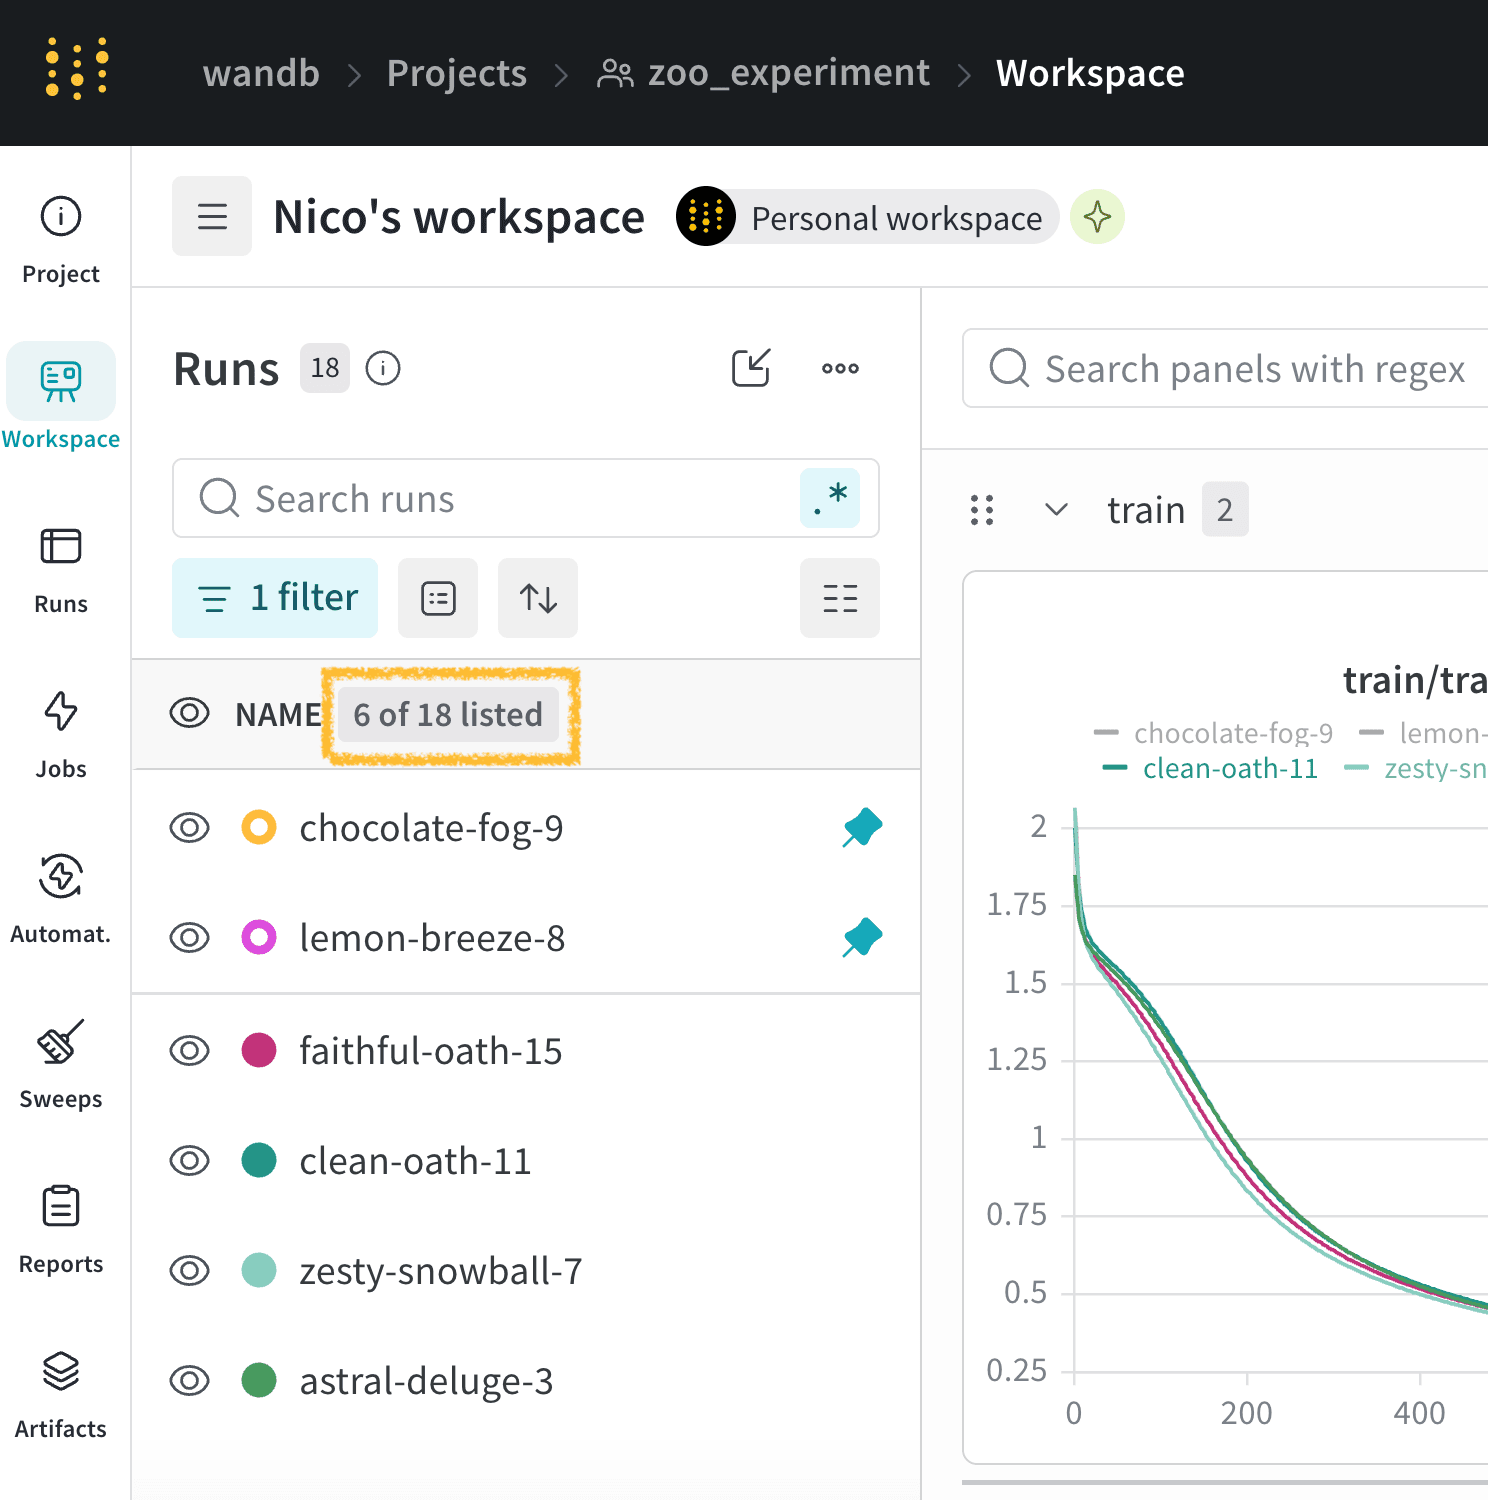
1:
6 of 18 listed which means 6 of the 18 listed runs match the filter expression and are currently displayed. The count is highlighted in the yellow box.
Example: Filter runs with tags
Filter runs based on their tags:- Click on the Runs tab from the project sidebar.
- Select the Filter button, which looks like a funnel, above the runs table.
- From left to right, select
"Tags"from the dropdown menu, then select a logic operator. - Select is, is not, in, or not in from the second dropdown menu.
- Enter the tag name you want to filter by from the third dropdown menu.
Example: Combine filters with AND and OR conditions
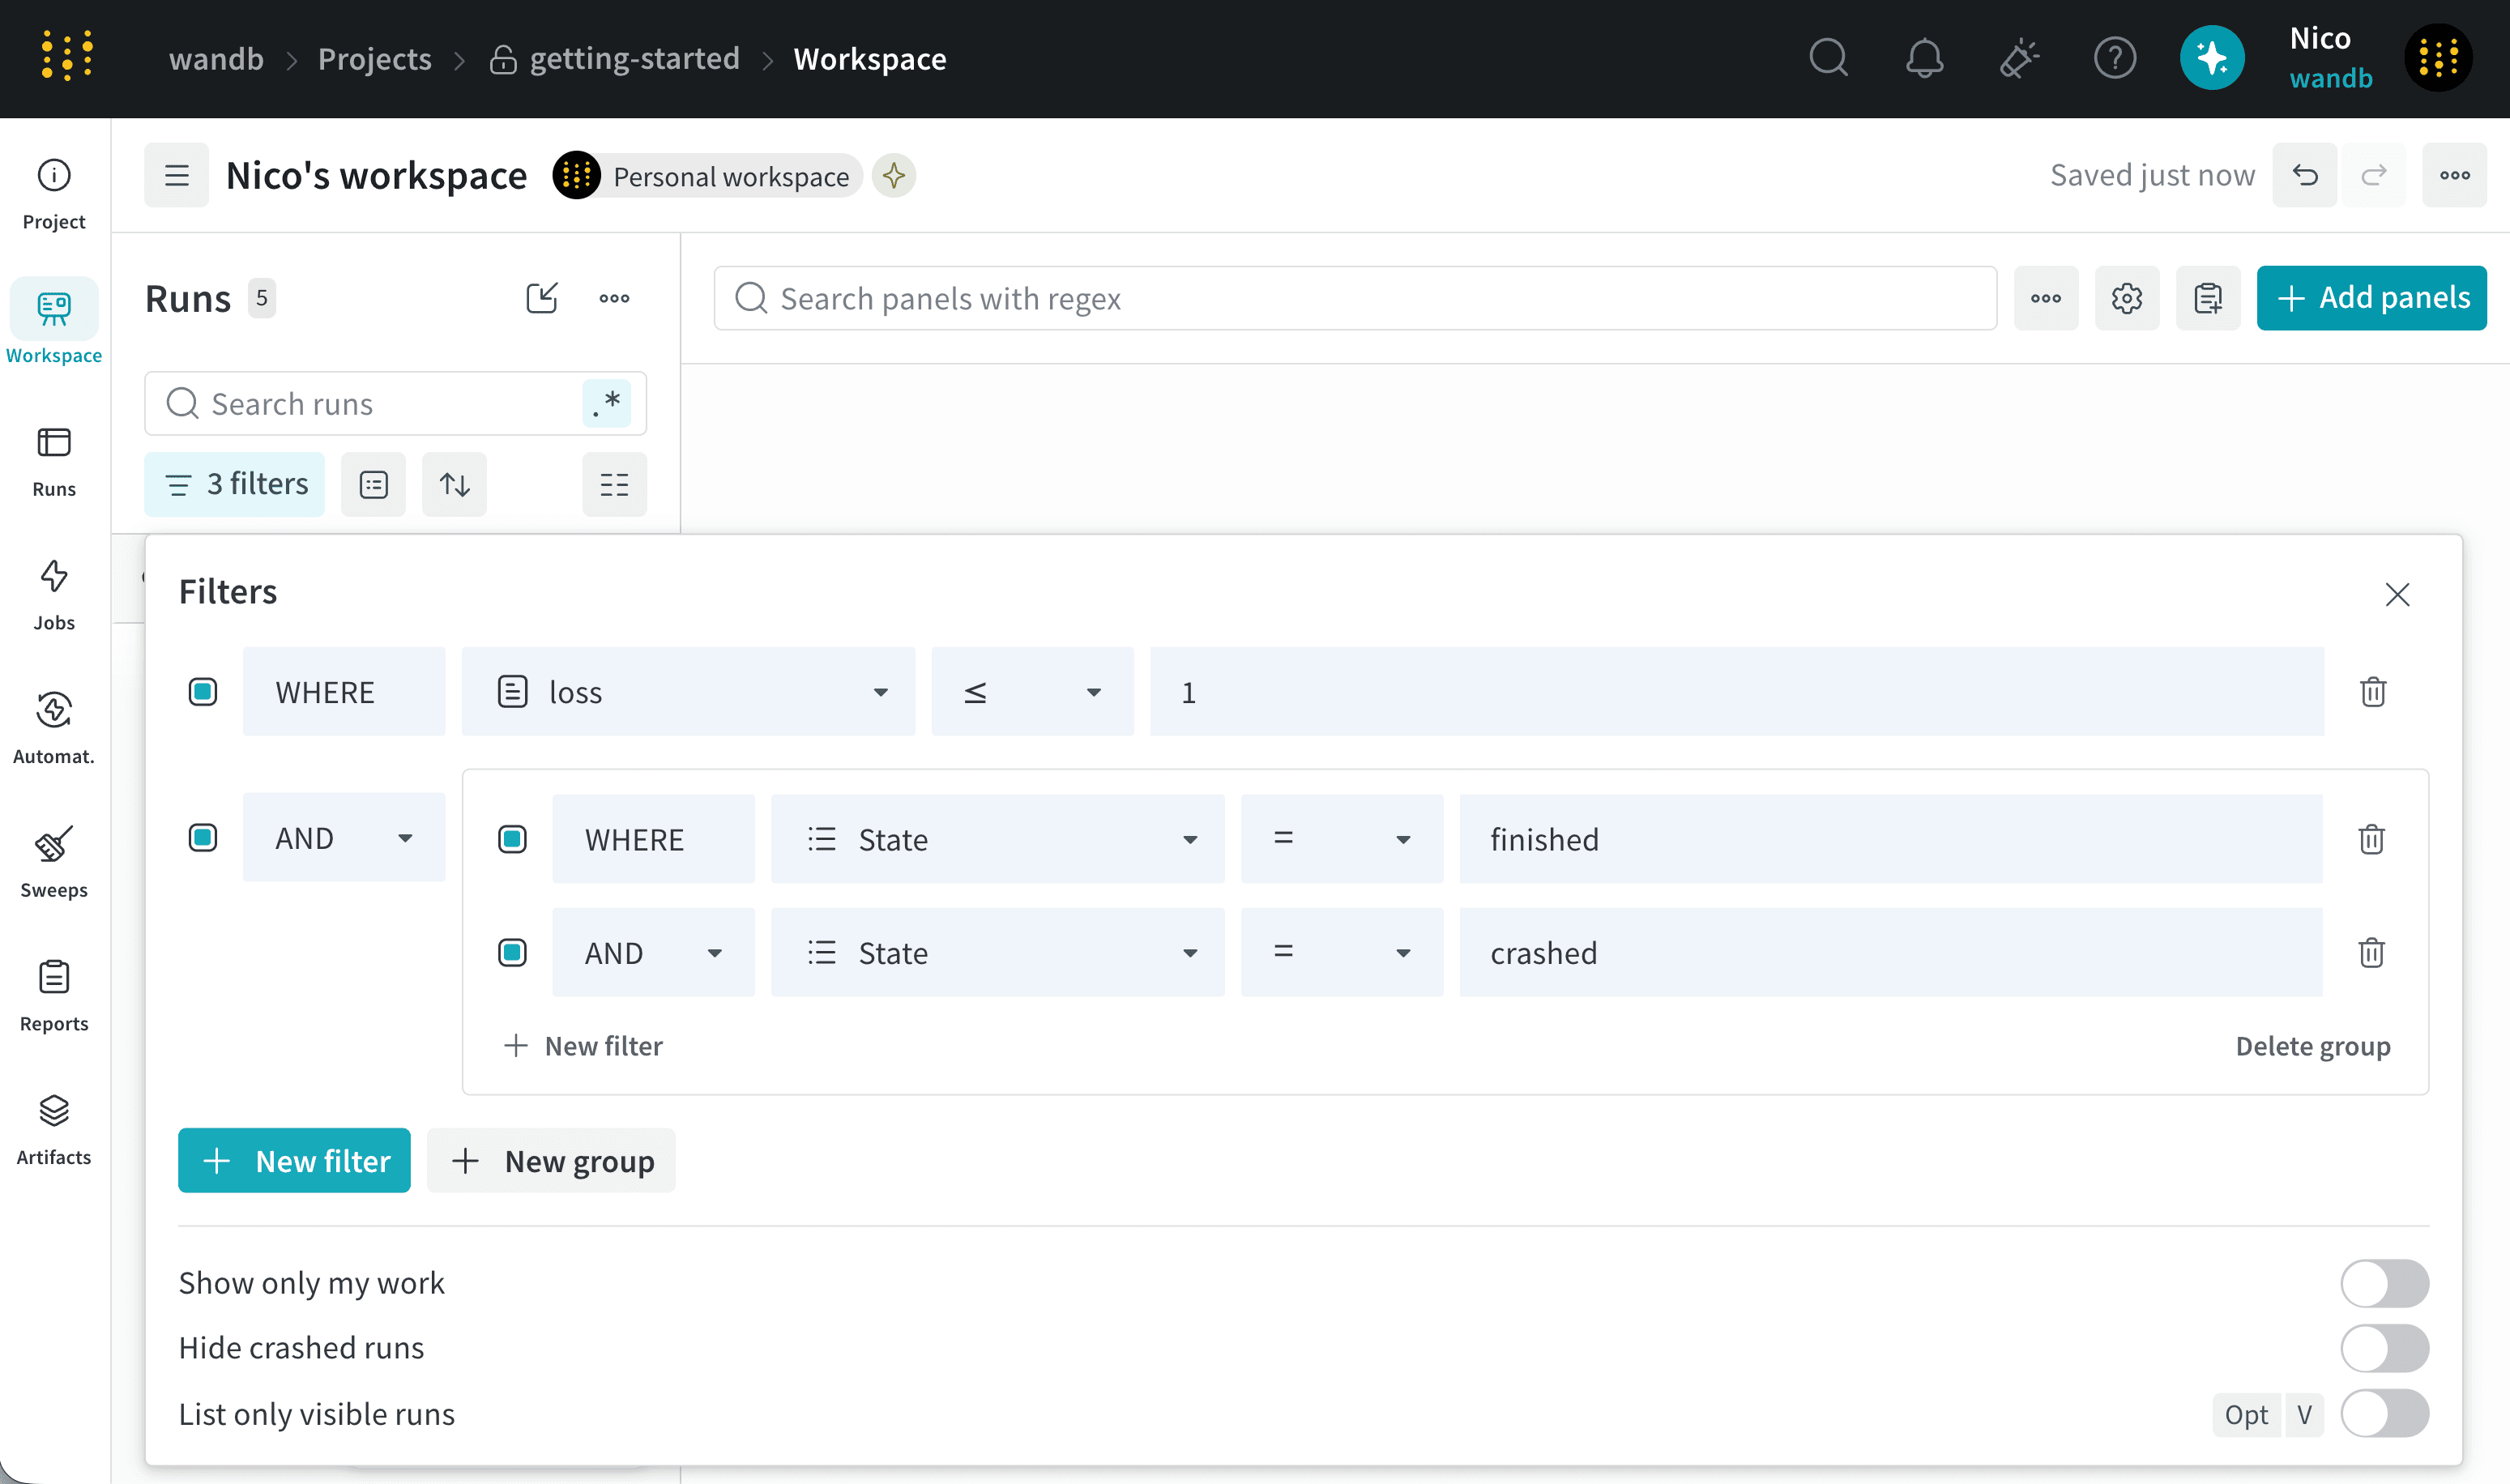
This section describes how to create a complex filter expression likeA AND (B OR C). In this example, A is loss ≤ 1, B is State = finished, and C is State = crashed.
- Click on the Runs tab from the project sidebar.
- Select the Filter button, which looks like a funnel, above the runs table.
- From left to right, select
lossfrom the first dropdown menu, select ≤ from the second dropdown menu, and enter1in the third dropdown menu. This creates filter A. - Click New Filter and select New group to create a new group for filters B and C.
- For filter B, select
Statefrom the first dropdown menu, select=from the second dropdown menu, and selectfinishedfrom the third dropdown menu. - Click New Filter to create filter C, and select
Statefrom the first dropdown menu, select=from the second dropdown menu, and selectcrashedfrom the third dropdown menu.
Default filters
By default, W&B provides the following filters:- Show only my works: Shows only runs created by the current user.
- Hide crashed runs: Hides runs with the
crashedstate.
Remove a filter
To remove a filter from the Runs table:- Click on the Filter button, which looks like a funnel, above the runs table.
- Select the
xicon next to the filter you want to remove.