preprocessing, training, or evaluation.
Organize runs into groups
You can add runs to a group programmatically using the W&B Python SDK or interactively in the W&B App.W&B stores group names as a run
wandb.Run.group property.- Python SDK
- W&B App
Programmatically add one or more runs to a group with the W&B Python SDK. Pass the name of your group as an argument to the In the project’s workspace, you can view runs organized by group. The following image illustrates organizing the runs table by group name. Three groups named 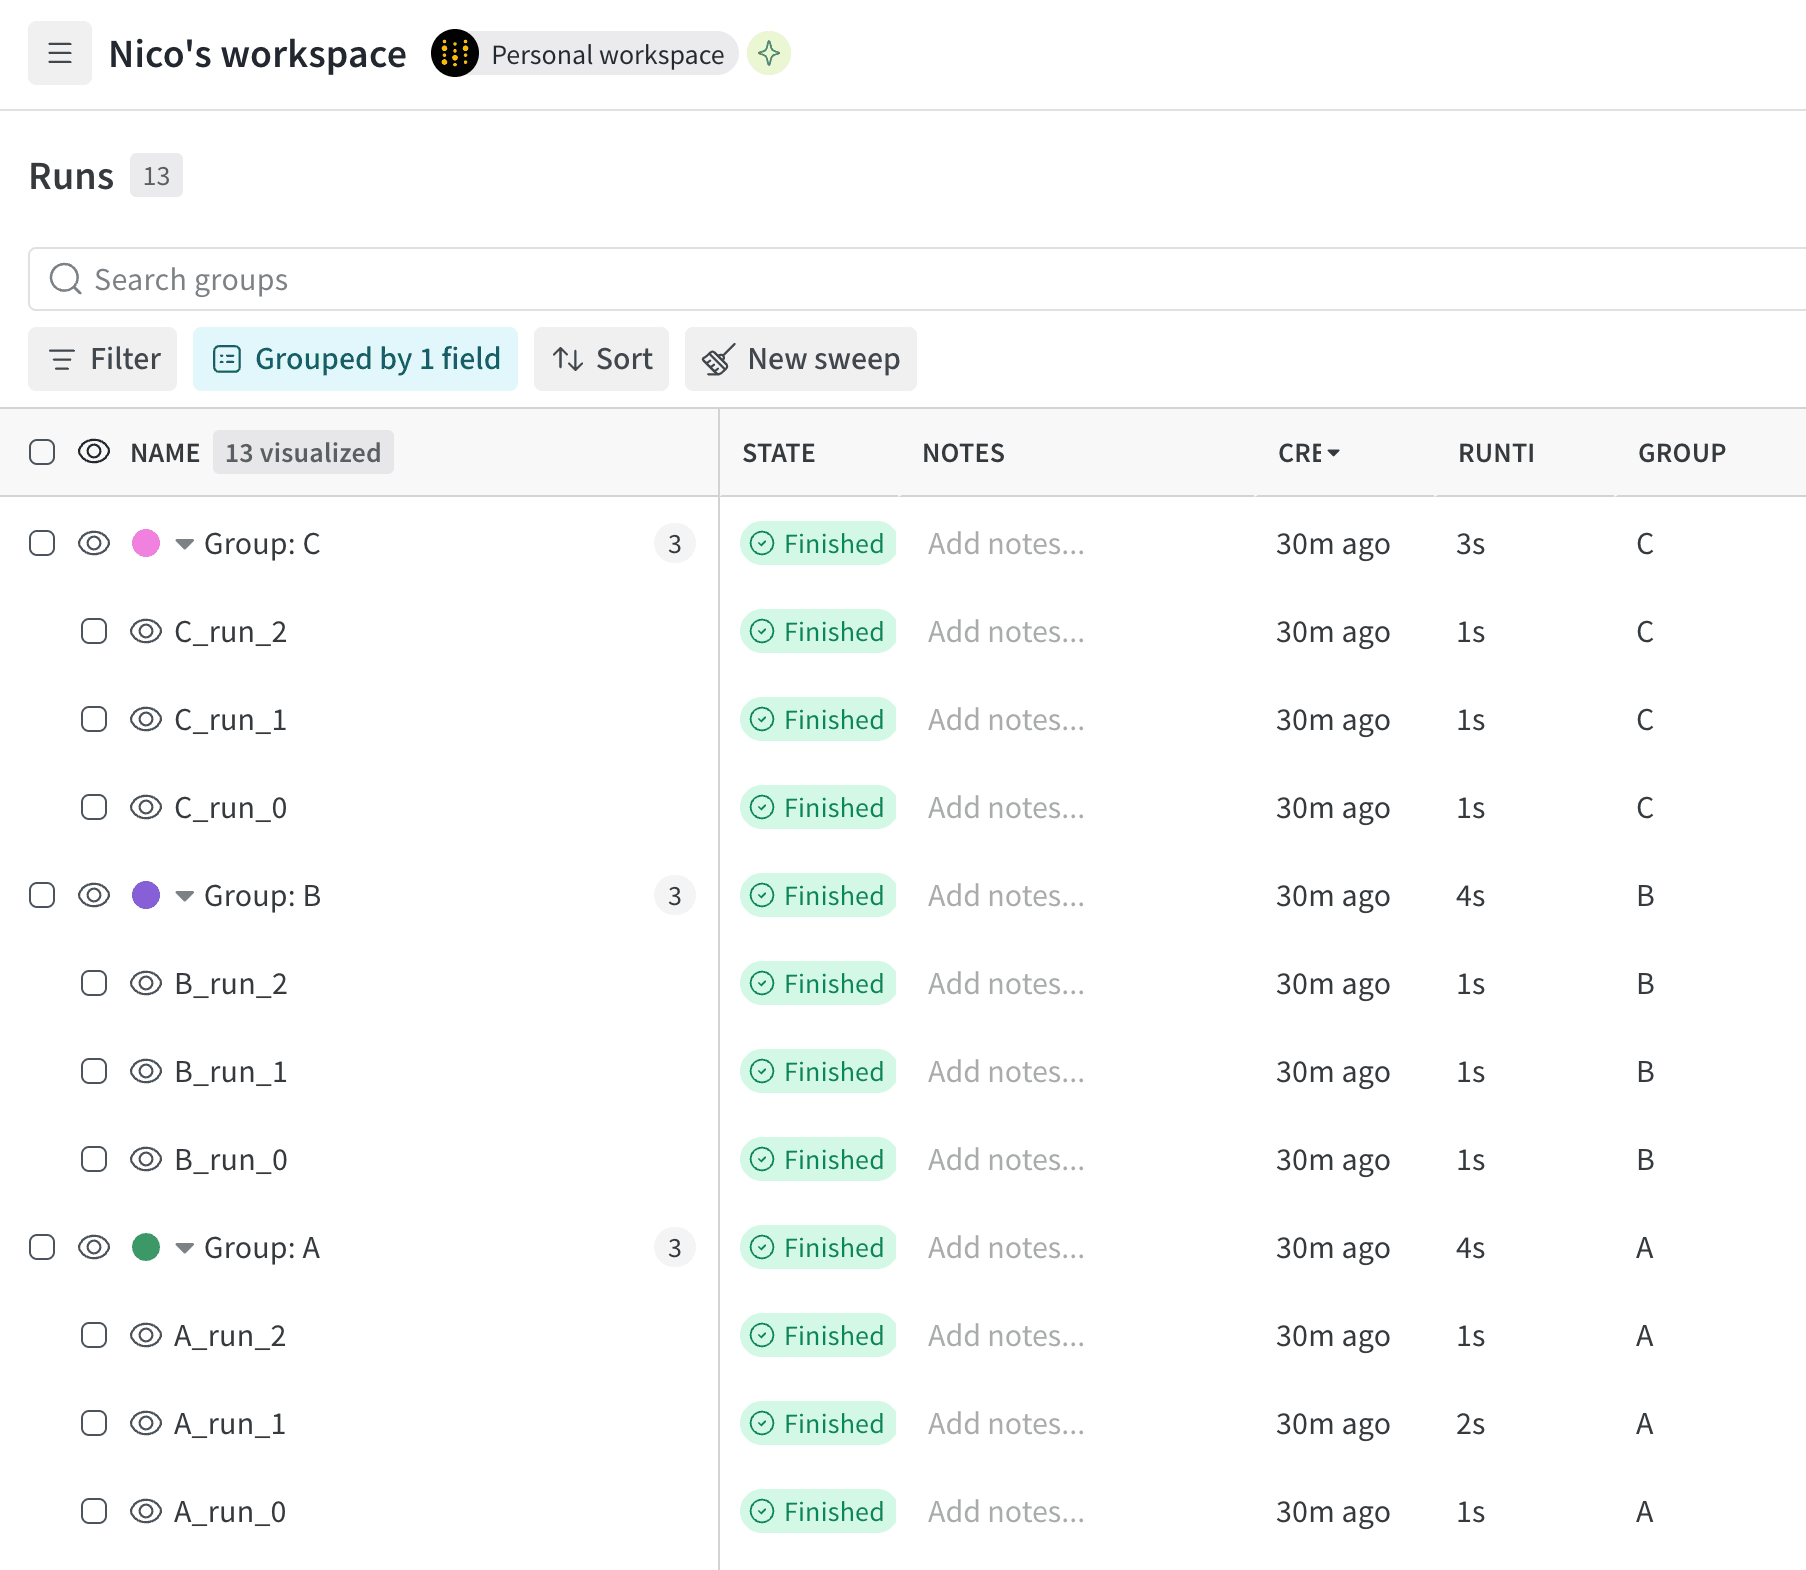
group parameter when you initialize a run with wandb.init(group=""). You can use group names to organize and filter runs in the W&B App.The following example creates three groups named A, B, and C. Each group contains three runs.A, B, and C appear in the runs table, each containing three runs.View groups
View runs organized by group in the W&B App:- In your project sidebar, select the Runs tab.
- Above the list of runs, click the Group button.
- From the dropdown, select a Group.
Move runs between groups
Move runs from one group to another group:- Navigate to your W&B project.
- Select the Runs tab from the project sidebar.
- Select one or more runs by clicking their checkboxes.
- Above the table, click Move to group.
- Within the drawer, select the target group or create a new group.
- Click Move.
Remove runs from a group
- Navigate to your W&B project.
- Select the Runs tab from the project sidebar.
- Above the list of runs, click the Group button.
- From the dropdown, select the X next to the name of the group you want to remove.
Delete a group
To delete a group, remove all runs from it. This automatically deletes the group.Organize runs by job type
Organize runs by their job type. A job type indicates the function of a run, such aspreprocessing, training, or evaluation.
View a run’s job type by accessing the run’s
wandb.Run.job_type property.job_type parameter to wandb.init(job_type=""). For example, the following code snippet creates runs with job types of either training or evaluation:
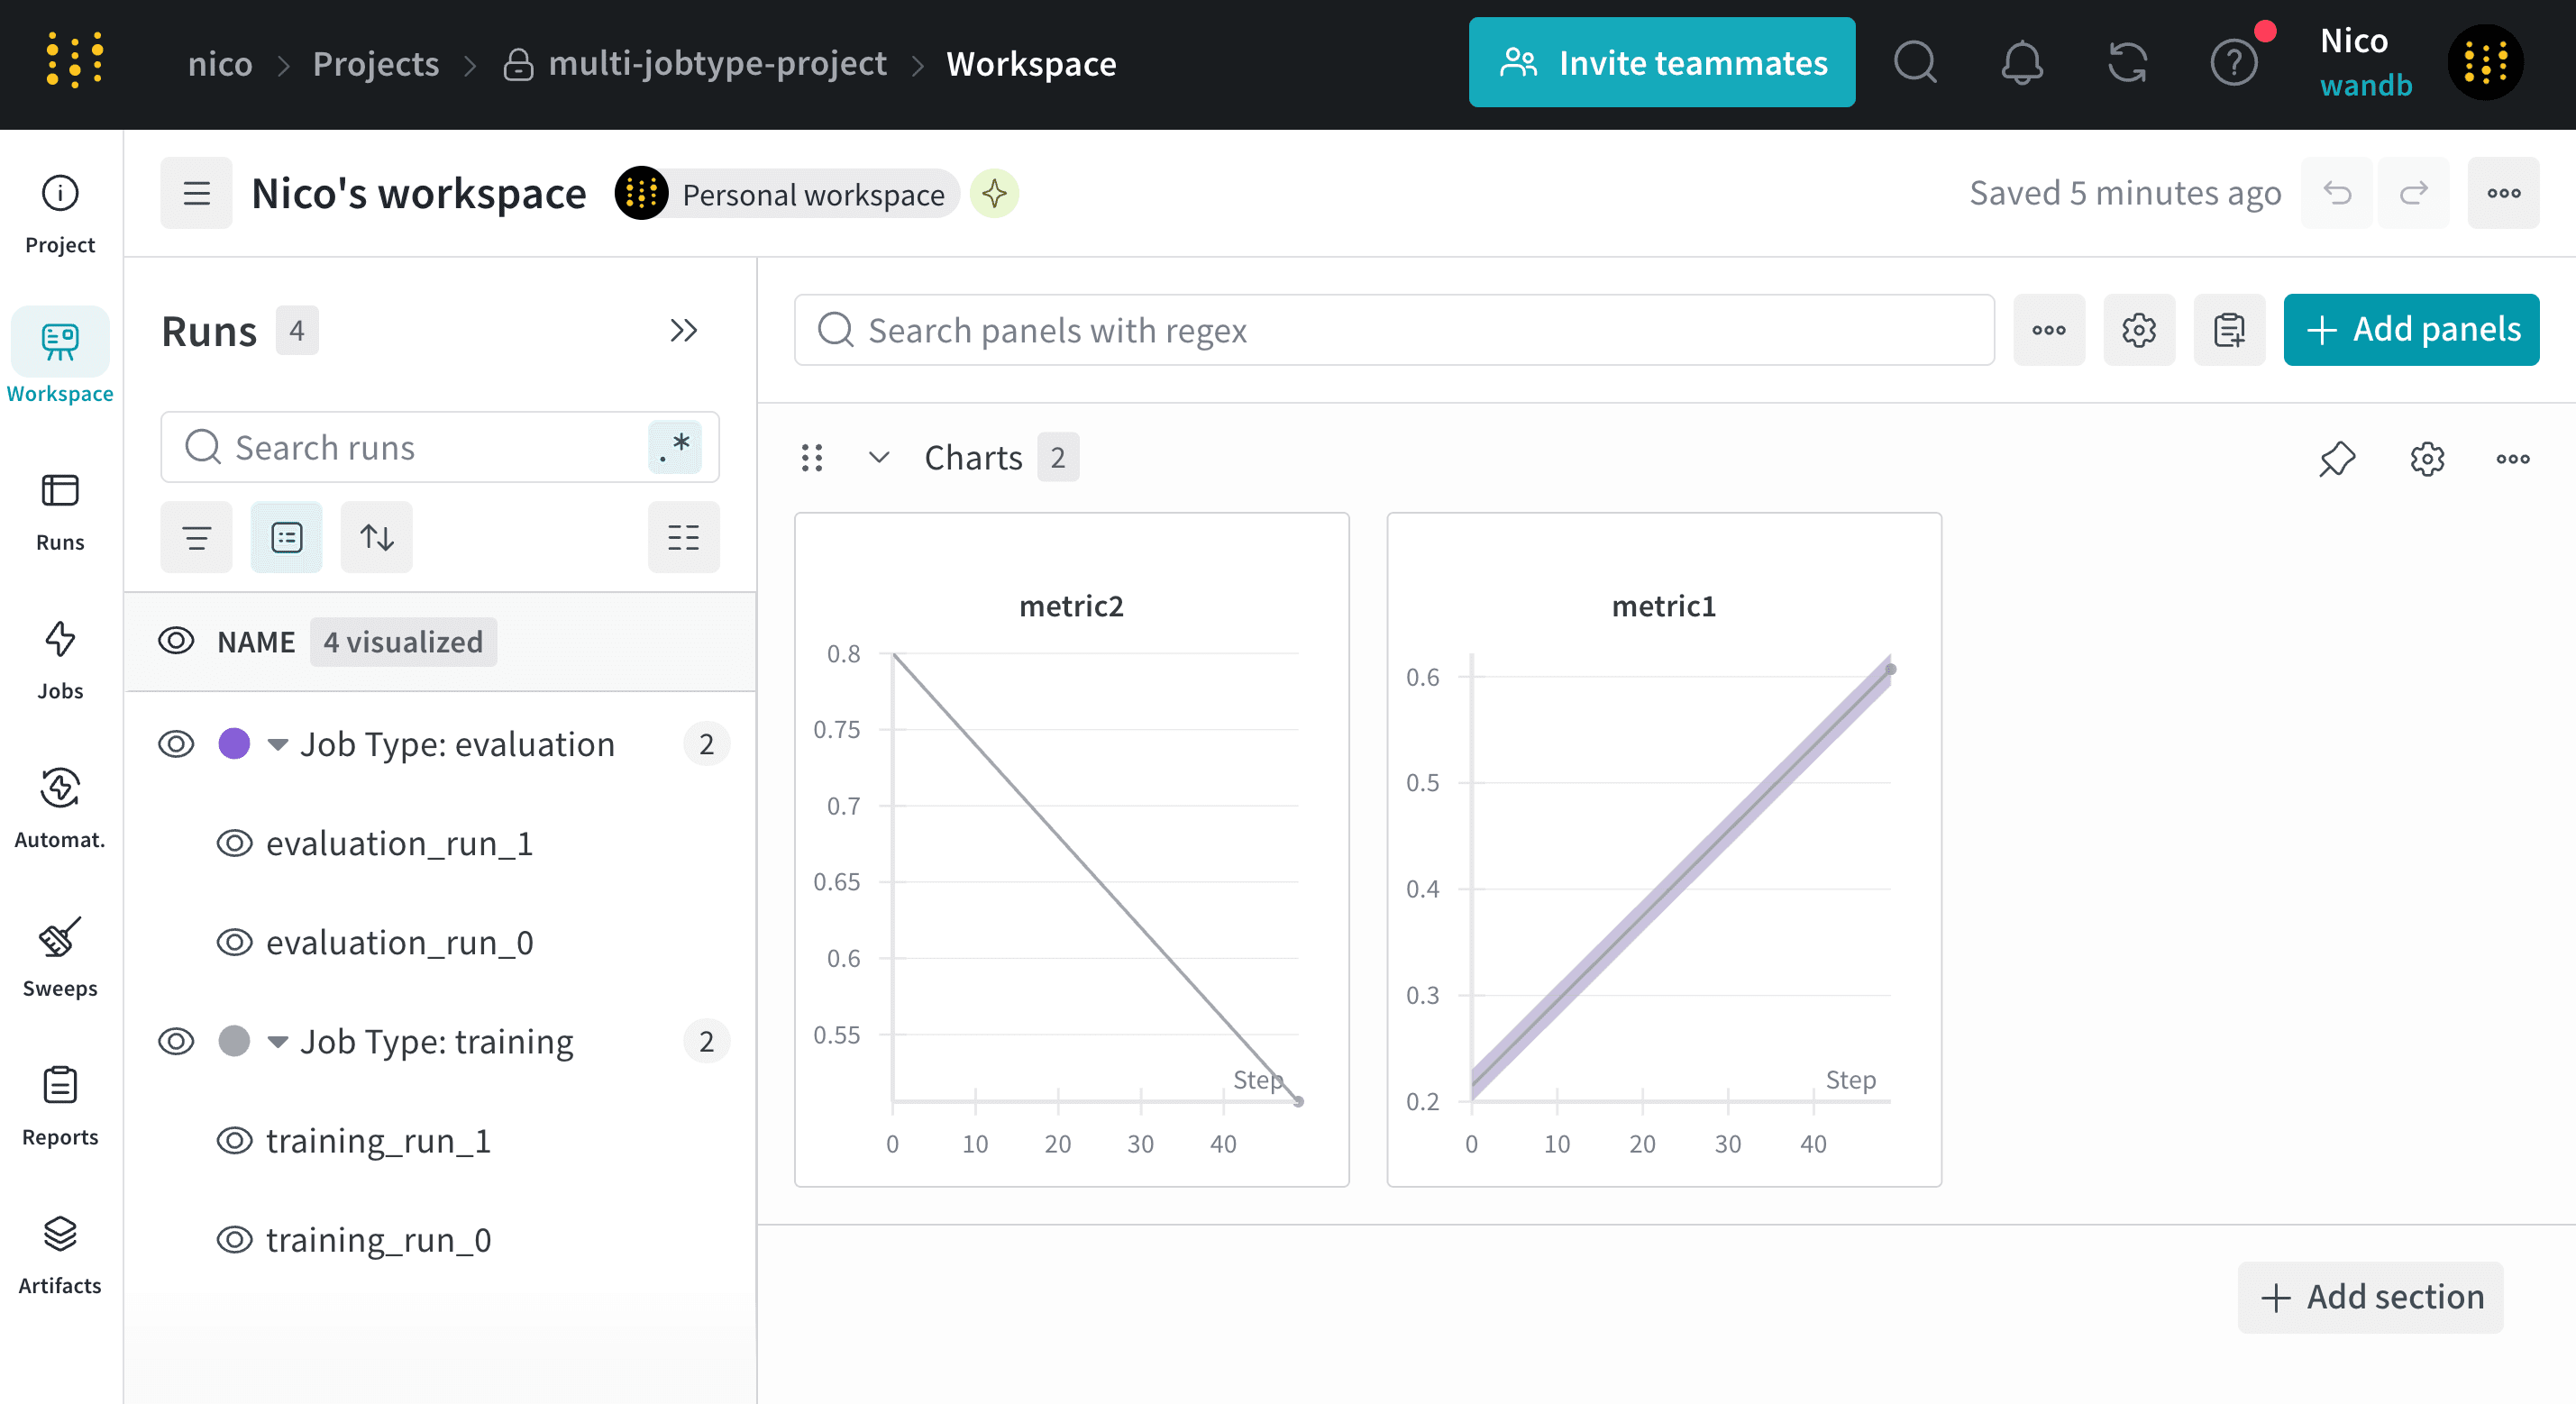
View runs organized by job type
View runs organized by group in the W&B App:- In your project sidebar, select the Runs tab.
- Above the list of runs, click the Group button.
- From the dropdown, select Job Type.