wandb
Python library to track machine learning experiments with a few lines of code. If you're using a popular framework like PyTorch or Keras, we have lightweight integrations.wandb.init()
: Initialize a new run at the top of your script. This returns a Run
object and creates a local directory where all logs and files are saved, then streamed asynchronously to a W&B server. If you want to use a private server instead of our hosted cloud server, we offer Self-Hosting.wandb.config
: Save a dictionary of hyperparameters such as learning rate or model type. The model settings you capture in config are useful later to organize and query your results.wandb.log()
: Log metrics over time in a training loop, such as accuracy and loss. By default, when you call wandb.log
it appends a new step to the history
object and updates the summary
object.history
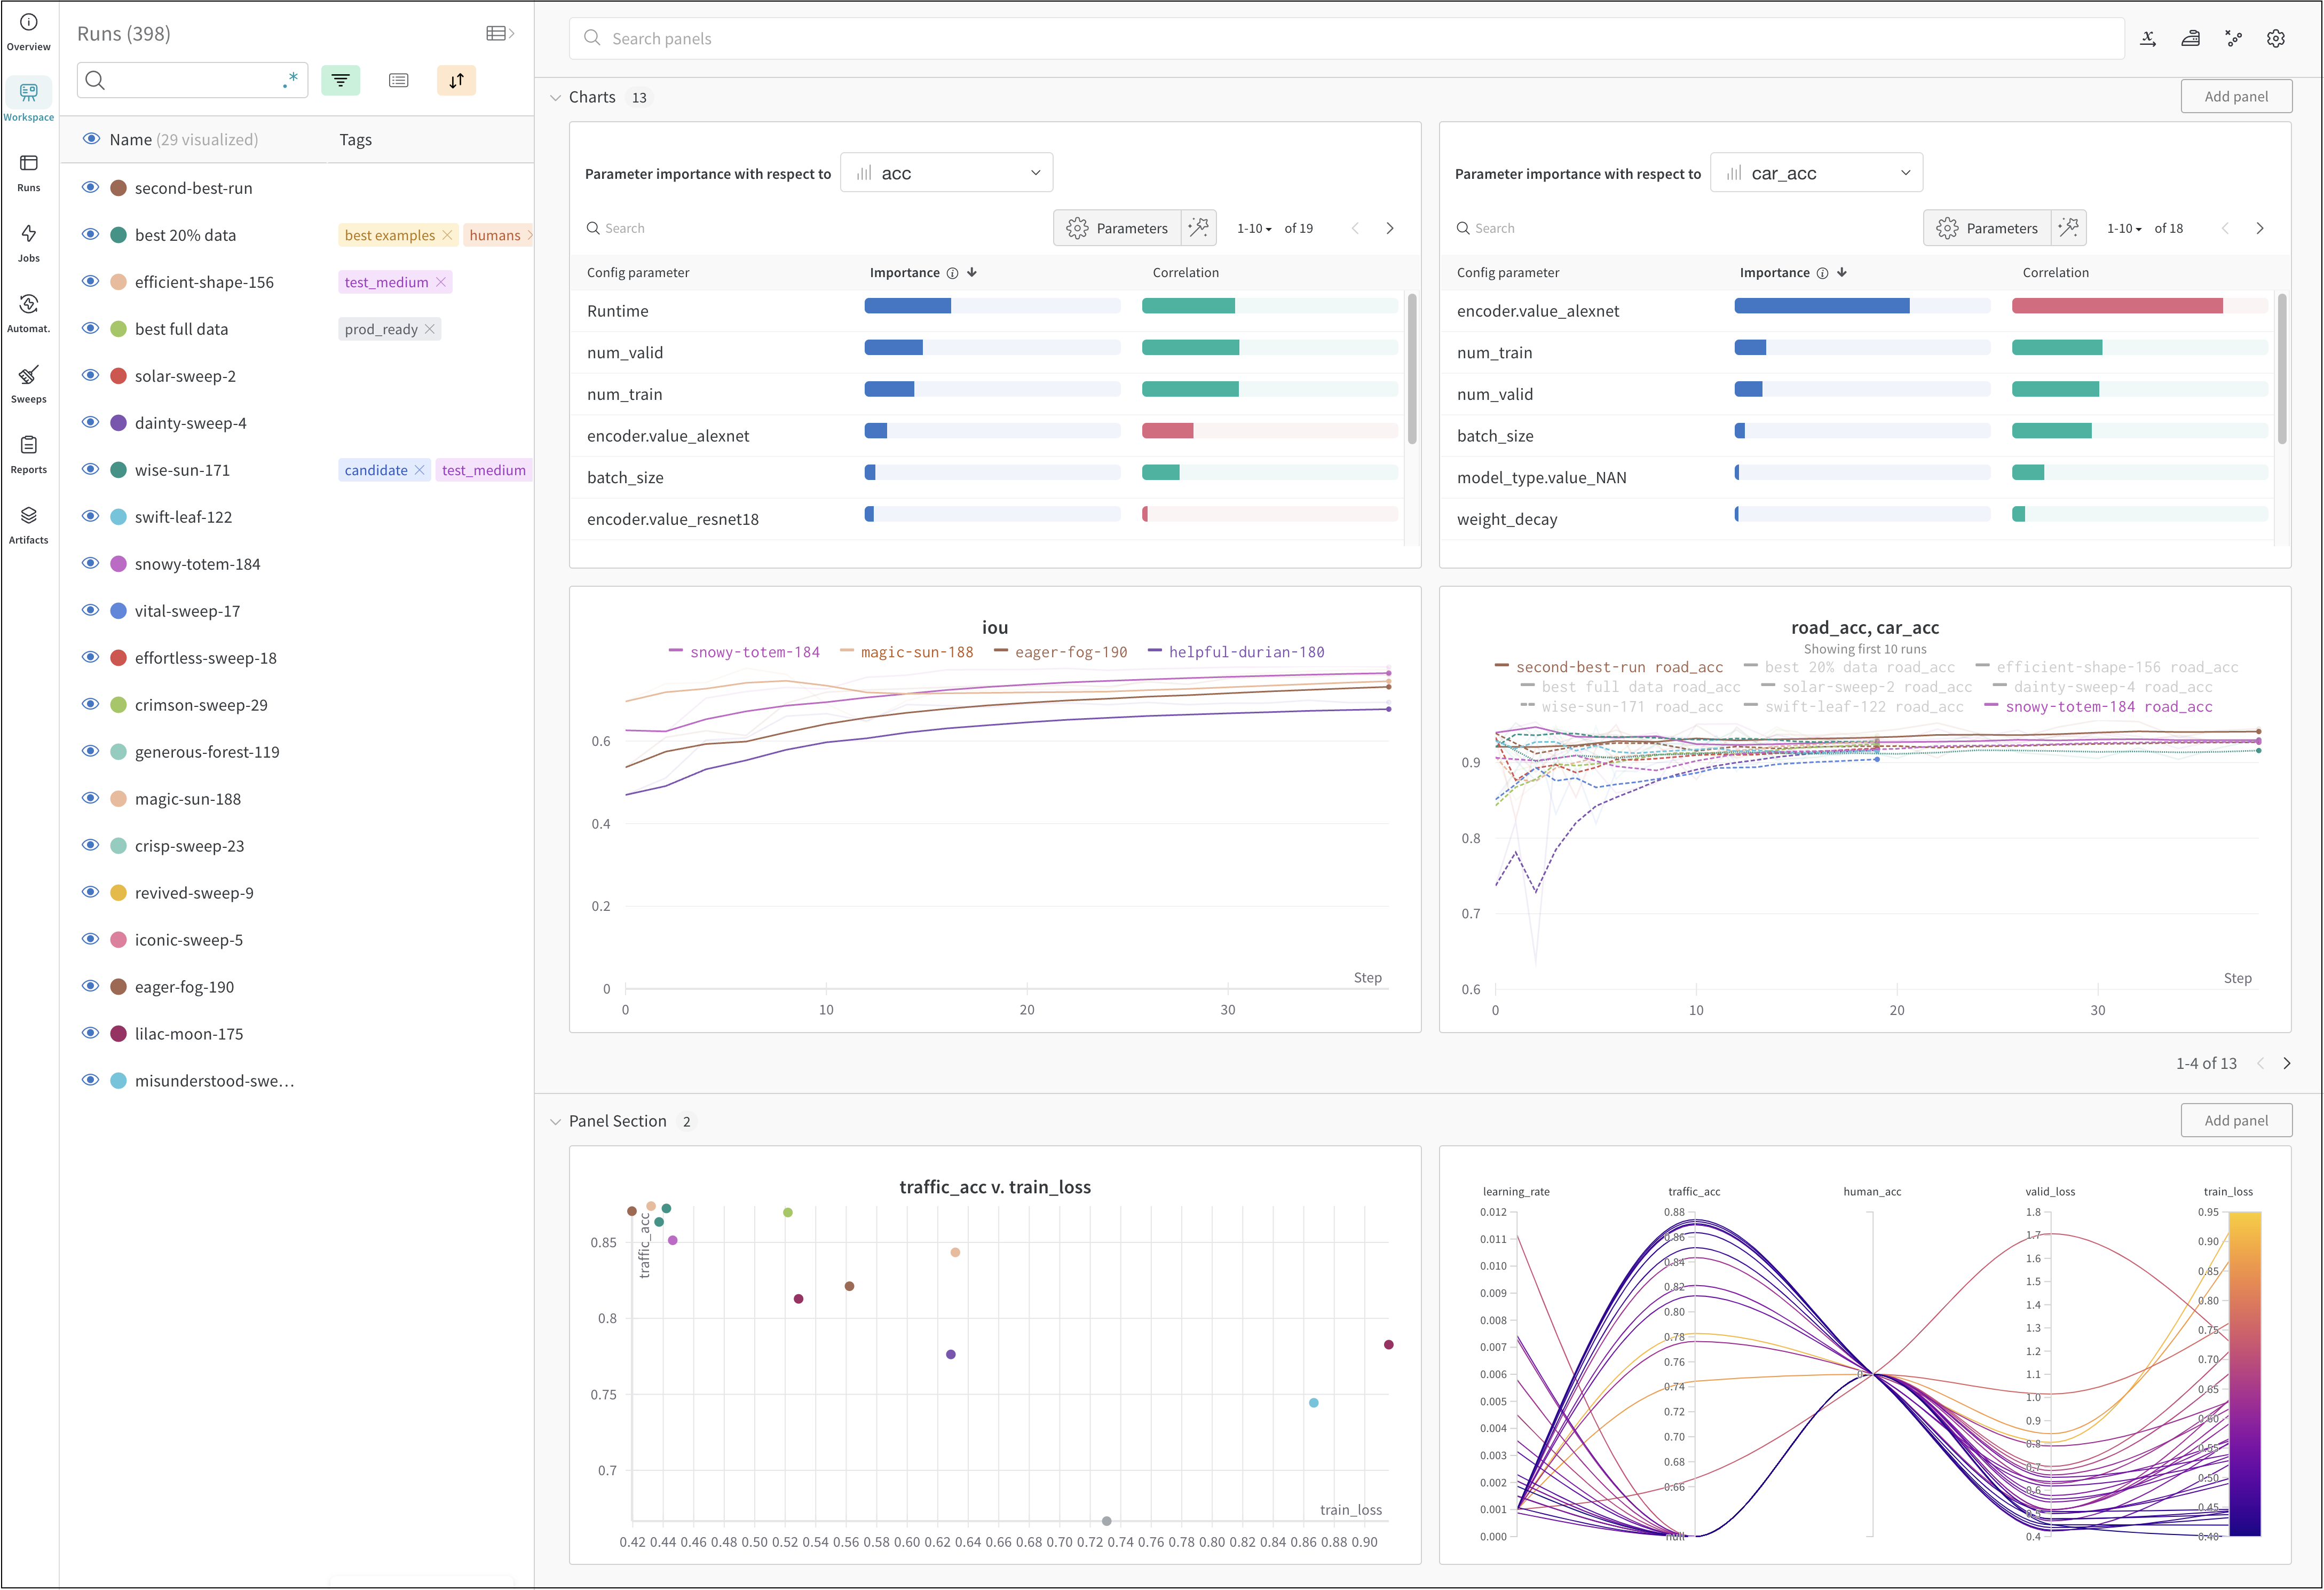
: An array of dictionary-like objects that tracks metrics over time. These time series values are shown as default line plots in the UI.summary
: By default, the final value of a metric logged with wandb.log(). You can set the summary for a metric manually to capture the highest accuracy or lowest loss instead of the final value. These values are used in the table, and plots that compare runs — for example, you could visualize at the final accuracy for all runs in your project.wandb.log_artifact
: Save outputs of a run, like the model weights or a table of predictions. This lets you track not just model training, but all the pipeline steps that affect the final model.wandb
library is incredibly flexible. Here are some suggested guidelines.wandb
, then synced to the W&B cloud or your private server.nvidia-smi
.diff.patch
file if there are any uncommitted changes.requirements.txt
file will be uploaded and shown on the files tab of the run page, along with any files you save to the wandb
directory for the run.wandb.watch(model)
to see gradients of the weights as histograms in the UI.wandb.init(config=your_config_dictionary)
.wandb.log
to see metrics from your model. If you log metrics like accuracy and loss from inside your training loop, you'll get live updating graphs in the UI.