
Log data and experiments from a CSV file

Use the W&B Python Library to log a CSV file and visualize it in a W&B Dashboard. W&B Dashboard are the central place to organize and visualize results from your machine learning models. This is particularly useful if you have a CSV file that contains information of previous machine learning experiments that are not logged in W&B or if you have CSV file that contains a dataset.

Import and log your dataset CSV fileโ€‹

We suggest you utilize W&B Artifacts to make it easier to re-use the contents of the CSV file easier to use.

  1. To get started, first import your CSV file. In the proceeding code snippet, replace the iris.csv filename with the name of your CSV filename:
import wandb
import pandas as pd

# Read our CSV into a new DataFrame
new_iris_dataframe = pd.read_csv("iris.csv")
  1. Convert the CSV file to a W&B Table to utilize W&B Dashboards.
# Convert the DataFrame into a W&B Table
iris_table = wandb.Table(dataframe=new_iris_dataframe)
  1. Next, create a W&B Artifact and add the table to the Artifact:
# Add the table to an Artifact to increase the row
# limit to 200000 and make it easier to reuse
iris_table_artifact = wandb.Artifact("iris_artifact", type="dataset")
iris_table_artifact.add(iris_table, "iris_table")

# Log the raw csv file within an artifact to preserve our data
iris_table_artifact.add_file("iris.csv")

For more information about W&B Artifacts, see the Artifacts chapter.

  1. Lastly, start a new W&B Run to track and log to W&B with wandb.init:
# Start a W&B run to log data
run = wandb.init(project="tables-walkthrough")

# Log the table to visualize with a run...
run.log({"iris": iris_table})

# and Log as an Artifact to increase the available row limit!
run.log_artifact(iris_table_artifact)

The 
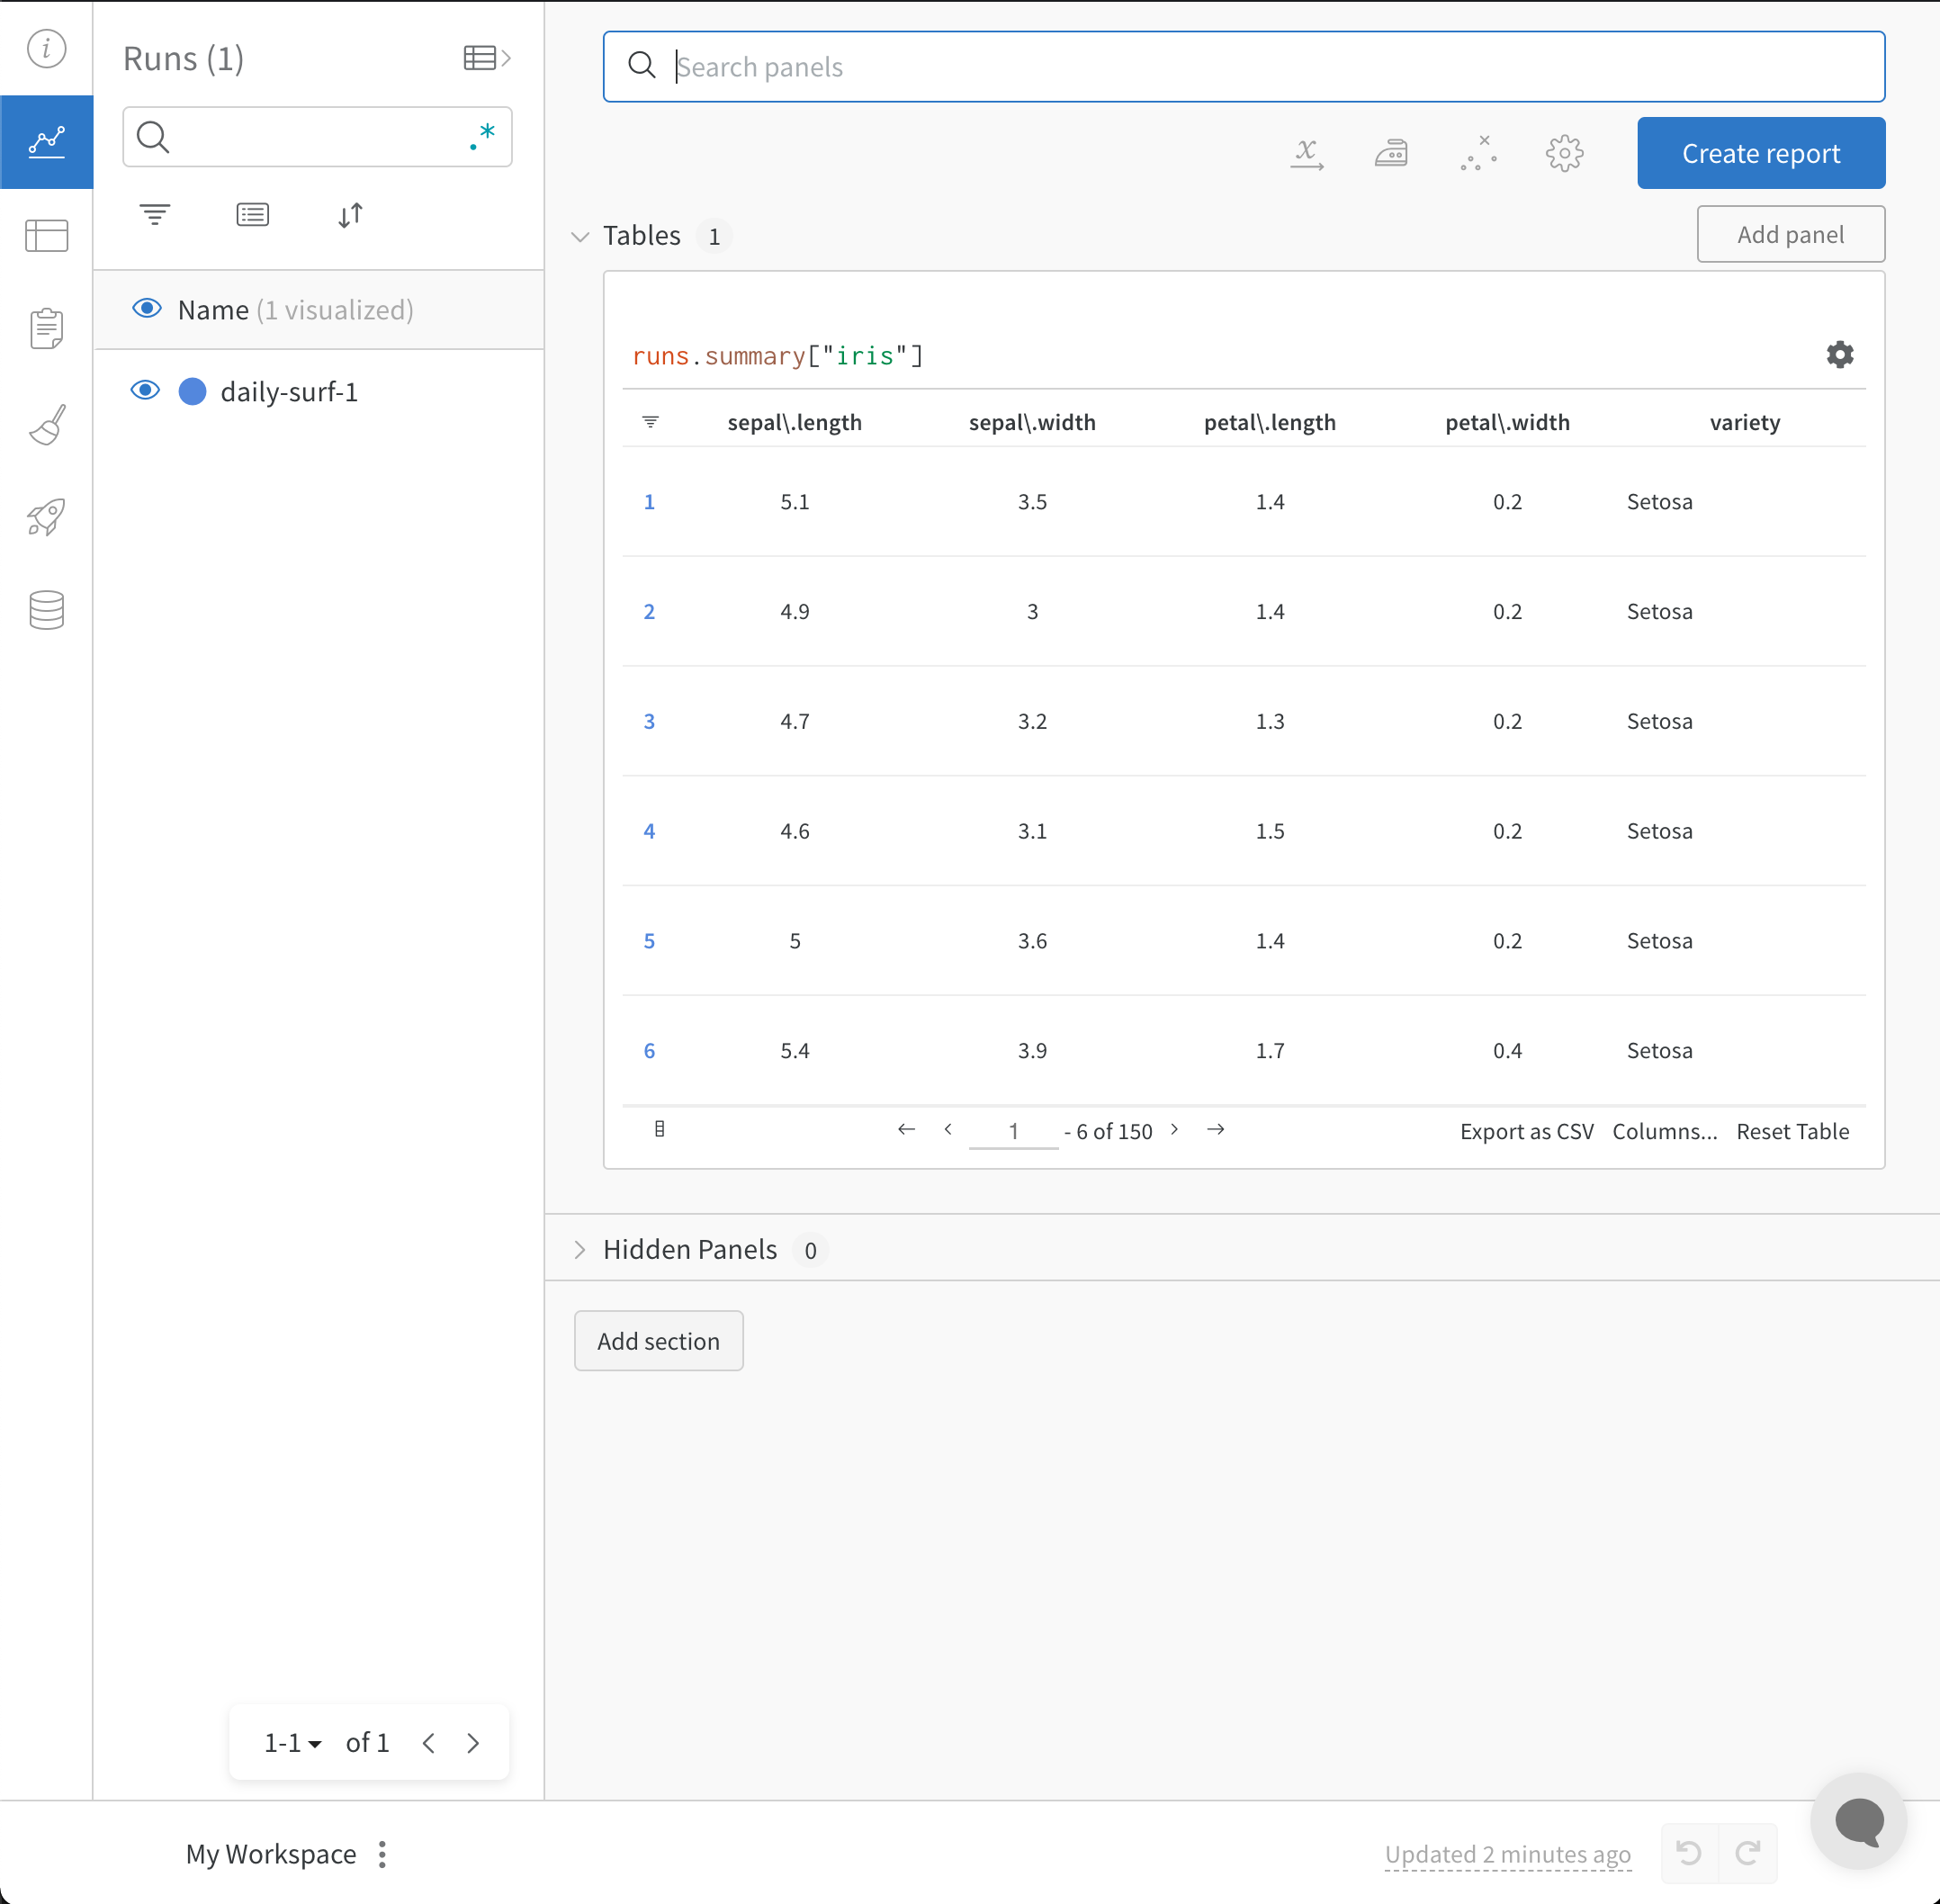
wandb.init() API spawns a new background process to log data to a Run, and it synchronizes data to wandb.ai (by default). View live visualizations on your W&B Workspace Dashboard. The following image demonstrates the output of the code snippet demonstration.

CSV file imported into W&B Dashboard

The full script with the preceding code snippets is found below:

import wandb
import pandas as pd

# Read our CSV into a new DataFrame
new_iris_dataframe = pd.read_csv("iris.csv")

# Convert the DataFrame into a W&B Table
iris_table = wandb.Table(dataframe=new_iris_dataframe)

# Add the table to an Artifact to increase the row
# limit to 200000 and make it easier to reuse
iris_table_artifact = wandb.Artifact("iris_artifact", type="dataset")
iris_table_artifact.add(iris_table, "iris_table")

# log the raw csv file within an artifact to preserve our data
iris_table_artifact.add_file("iris.csv")

# Start a W&B run to log data
run = wandb.init(project="tables-walkthrough")

# Log the table to visualize with a run...
run.log({"iris": iris_table})

# and Log as an Artifact to increase the available row limit!
run.log_artifact(iris_table_artifact)

# Finish the run (useful in notebooks)
run.finish()

Import and log your CSV of Experimentsโ€‹

In some cases, you might have your experiment details in a CSV file. Common details found in such CSV files include:

  • A name for the experiment run
  • Initial notes
  • Tags to differentiate the experiments
  • Configurations needed for your experiment (with the added benefit of being able to utilize our Sweeps Hyperparameter Tuning).
ExperimentModel NameNotesTagsNum LayersFinal Train AccFinal Val AccTraining Losses
Experiment 1mnist-300-layersOverfit way too much on training data[latest]3000.990.90[0.55, 0.45, 0.44, 0.42, 0.40, 0.39]
Experiment 2mnist-250-layersCurrent best model[prod, best]2500.950.96[0.55, 0.45, 0.44, 0.42, 0.40, 0.39]
Experiment 3mnist-200-layersDid worse than the baseline model. Need to debug[debug]2000.760.70[0.55, 0.45, 0.44, 0.42, 0.40, 0.39]
.....................
Experiment Nmnist-X-layersNOTES............[..., ...]

W&B can take CSV files of experiments and convert it into a W&B Experiment Run. The proceeding code snippets and code script demonstrates how to import and log your CSV file of experiments:

  1. To get started, first read in your CSV file and convert it into a Pandas DataFrame. Replace "experiments.csv" with the name of your CSV file:
import wandb
import pandas as pd

FILENAME = "experiments.csv"
loaded_experiment_df = pd.read_csv(FILENAME)

PROJECT_NAME = "Converted Experiments"

EXPERIMENT_NAME_COL = "Experiment"
NOTES_COL = "Notes"
TAGS_COL = "Tags"
CONFIG_COLS = ["Num Layers"]
SUMMARY_COLS = ["Final Train Acc", "Final Val Acc"]
METRIC_COLS = ["Training Losses"]

# Format Pandas DataFrame to make it easier to work with
for i, row in loaded_experiment_df.iterrows():
run_name = row[EXPERIMENT_NAME_COL]
notes = row[NOTES_COL]
tags = row[TAGS_COL]

config = {}
for config_col in CONFIG_COLS:
config[config_col] = row[config_col]

metrics = {}
for metric_col in METRIC_COLS:
metrics[metric_col] = row[metric_col]

summaries = {}
for summary_col in SUMMARY_COLS:
summaries[summary_col] = row[summary_col]
  1. Next, start a new W&B Run to track and log to W&B with wandb.init():
run = wandb.init(
project=PROJECT_NAME, name=run_name, tags=tags, notes=notes, config=config
)

As an experiment runs, you might want to log every instance of your metrics so they are available to view, query, and analyze with W&B. Use the run.log() command to accomplish this:

run.log({key: val})

You can optionally log a final summary metric to define the outcome of the run. Use the W&B define_metric API to accomplish this. In this example case, we will add the summary metrics to our run with run.summary.update():

run.summary.update(summaries)

For more information about summary metrics, see Log Summary Metrics.

Below is the full example script that converts the above sample table into a W&B Dashboard:

FILENAME = "experiments.csv"
loaded_experiment_df = pd.read_csv(FILENAME)

PROJECT_NAME = "Converted Experiments"

EXPERIMENT_NAME_COL = "Experiment"
NOTES_COL = "Notes"
TAGS_COL = "Tags"
CONFIG_COLS = ["Num Layers"]
SUMMARY_COLS = ["Final Train Acc", "Final Val Acc"]
METRIC_COLS = ["Training Losses"]

for i, row in loaded_experiment_df.iterrows():
run_name = row[EXPERIMENT_NAME_COL]
notes = row[NOTES_COL]
tags = row[TAGS_COL]

config = {}
for config_col in CONFIG_COLS:
config[config_col] = row[config_col]

metrics = {}
for metric_col in METRIC_COLS:
metrics[metric_col] = row[metric_col]

summaries = {}
for summary_col in SUMMARY_COLS:
summaries[summary_col] = row[summary_col]

run = wandb.init(
project=PROJECT_NAME, name=run_name, tags=tags, notes=notes, config=config
)

for key, val in metrics.items():
if isinstance(val, list):
for _val in val:
run.log({key: _val})
else:
run.log({key: val})

run.summary.update(summaries)
run.finish()
Was this page helpful?๐Ÿ‘๐Ÿ‘Ž