Organization dashboard
Organization dashboard is only available with Dedicated Cloud and Self-managed instances.
View organization usage of W&B
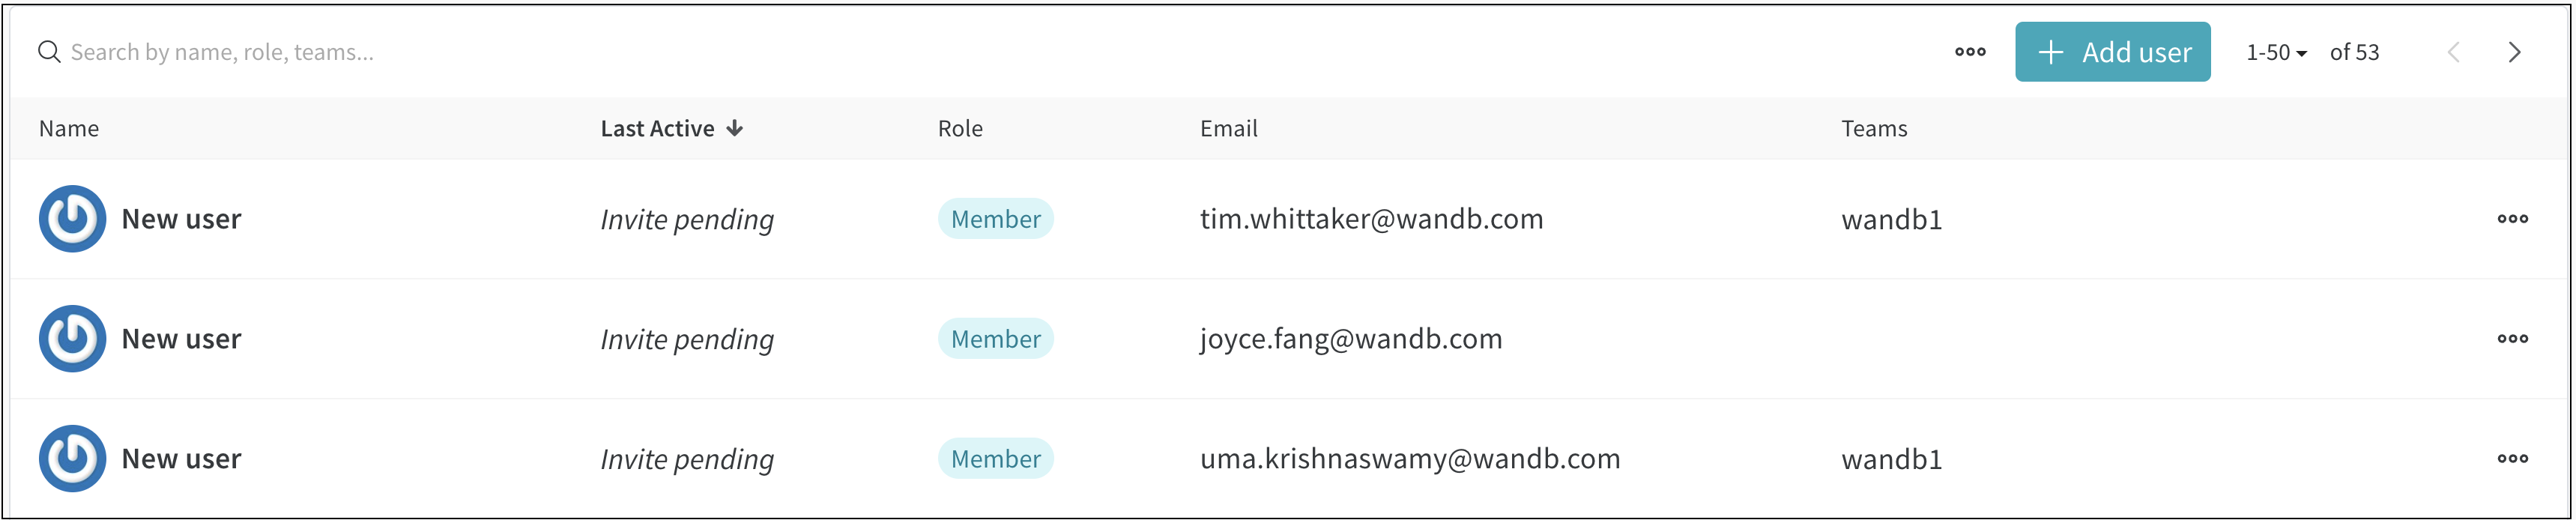
Use the organization dashboard to get a holistic view of users that belong to your organization, how users of your organization use W&B, along with properties such as:
- Name: The name of the user and their W&B username.
- Last active: The time the user last used W&B. This includes any activity that requires authentication, including viewing pages in the product, logging runs or taking any other action, or logging in.
- Role: The role of the user.
- Email: The email of the user.
- Team: The names of teams the user belongs to.
View the status of a user
The Last Active column shows if a user is pending an invitation or an active user. A user is one of three states:
- Pending invitation: Admin has sent invite but user has not accepted invitation.
- Active: User has accepted the invite and created an account.
- Deactivated: Admin has revoked access of the user.
View and share how your organization uses W&B
View how your organization uses W&B in CSV format.
- Select the three dots next to the Add user button.
- From the dropdown, select Export as CSV.
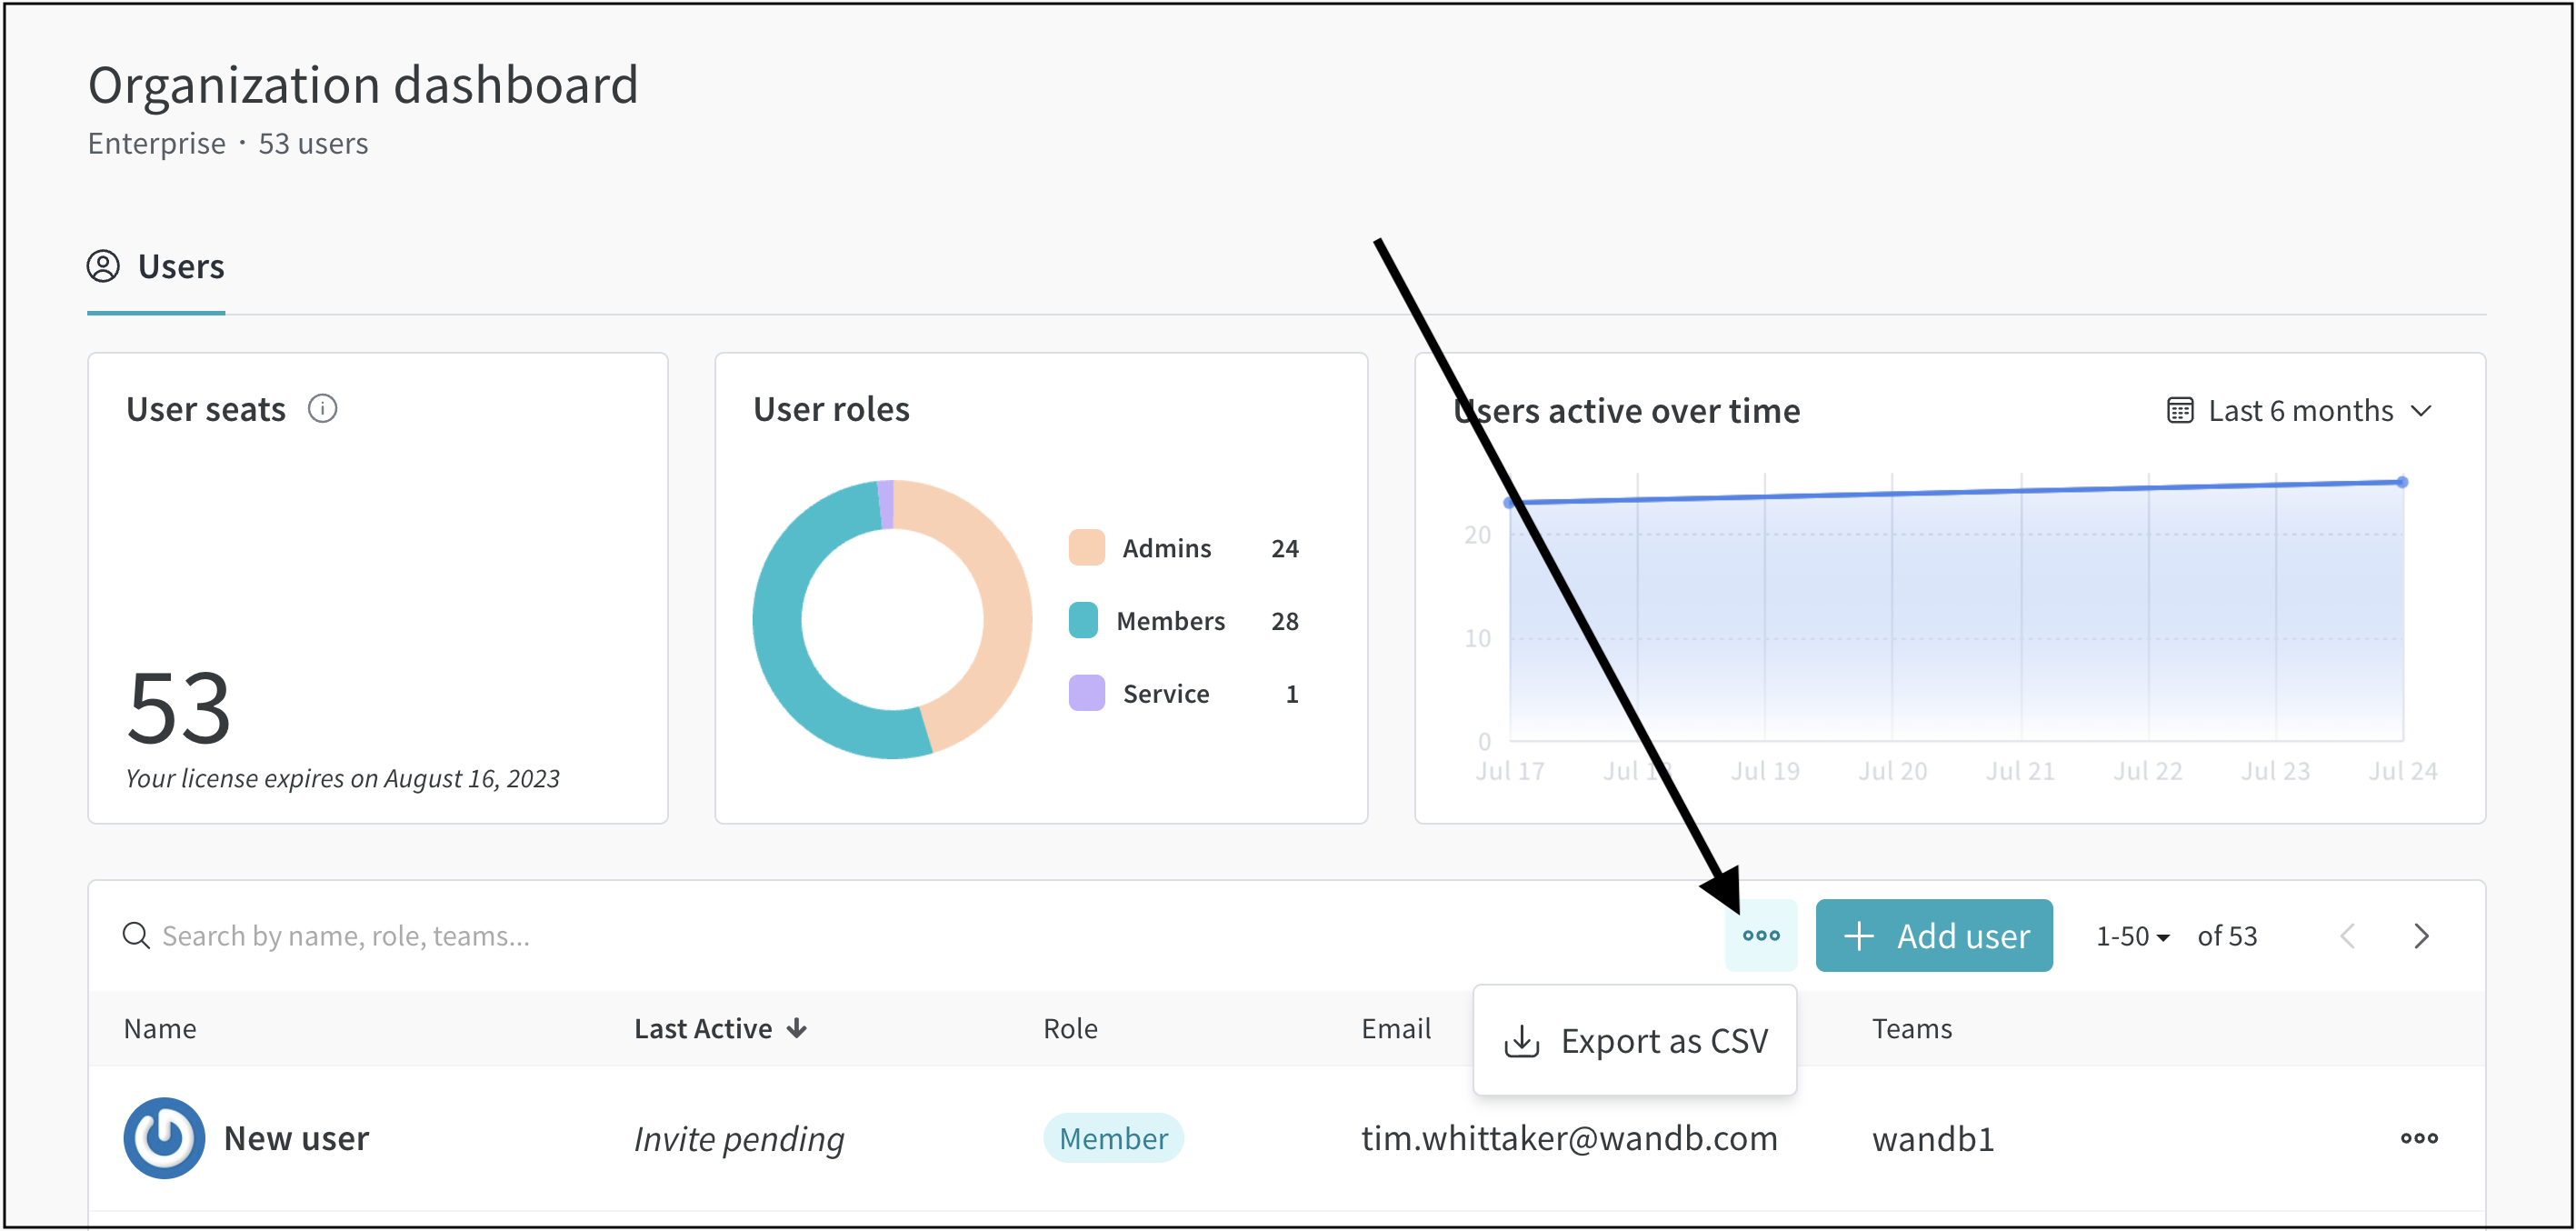
This will export a CSV file that lists all users of an organization along with their: user name, time stamp of when they were last active, role, email, teams they belong to, and their status (active, pending, or deactivated).
View user activity
Use the Last Active column to get an Activity summary of an individual user.
- Hover your mouse over the Last Active entry for a user.
- A tooltip appears and provides a summary of information about the user's activity.
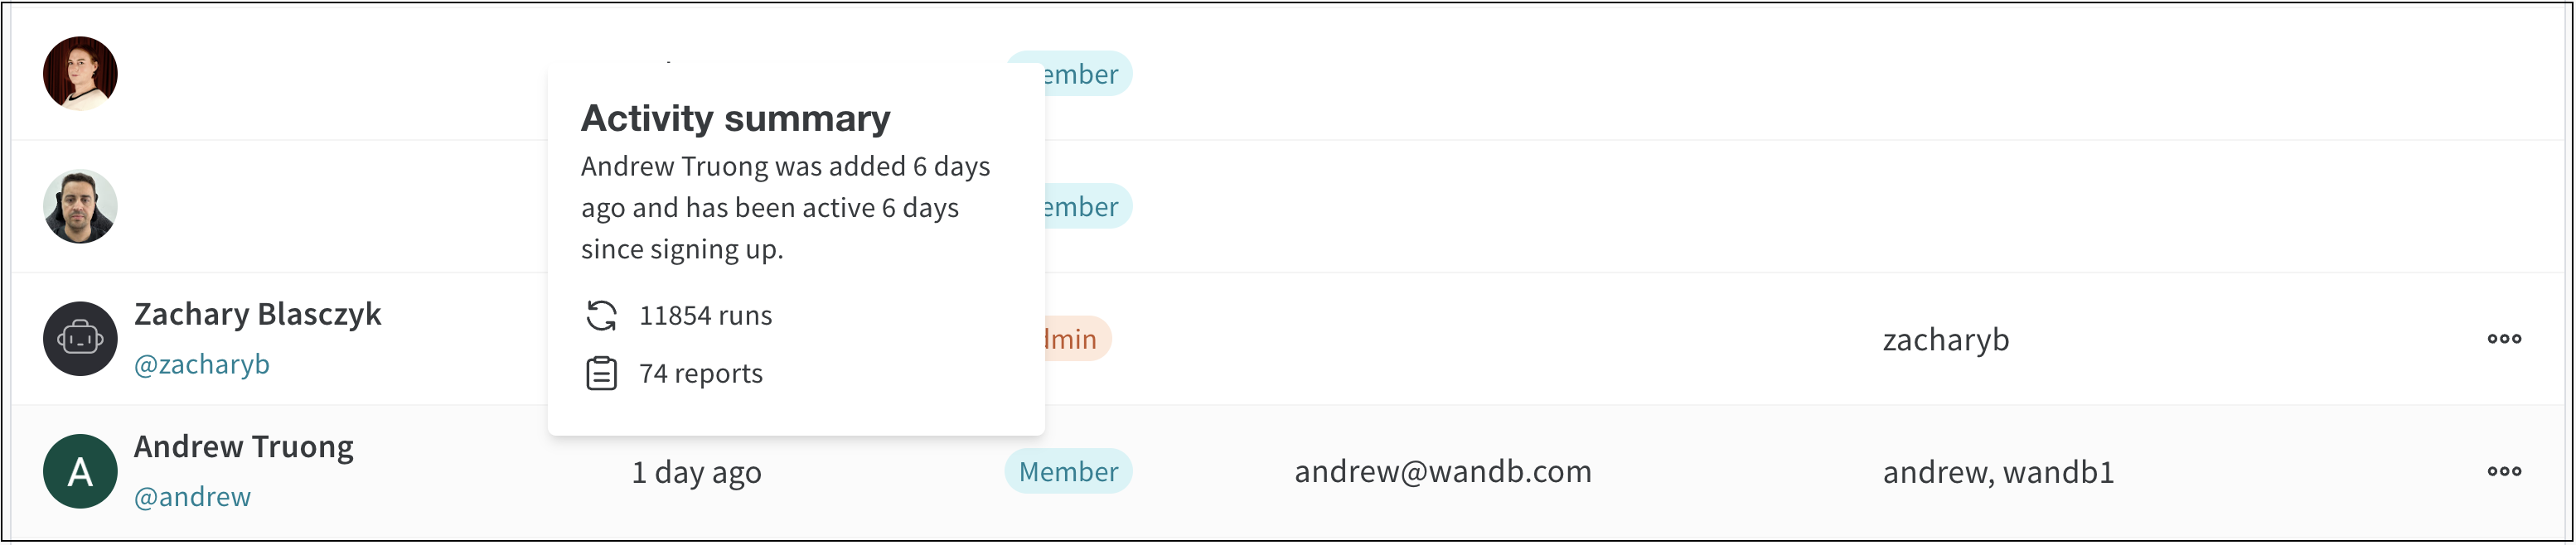
A user is active if they: log in to W&B, view any page in the W&B App, log runs, use the SDK to track an experiment, or interact with the W&B server in any way.
View active users over time
Use the Users active over time plot in the Organization dashboard to get an aggregate overview of how many users are active over time (right most plot in image below).
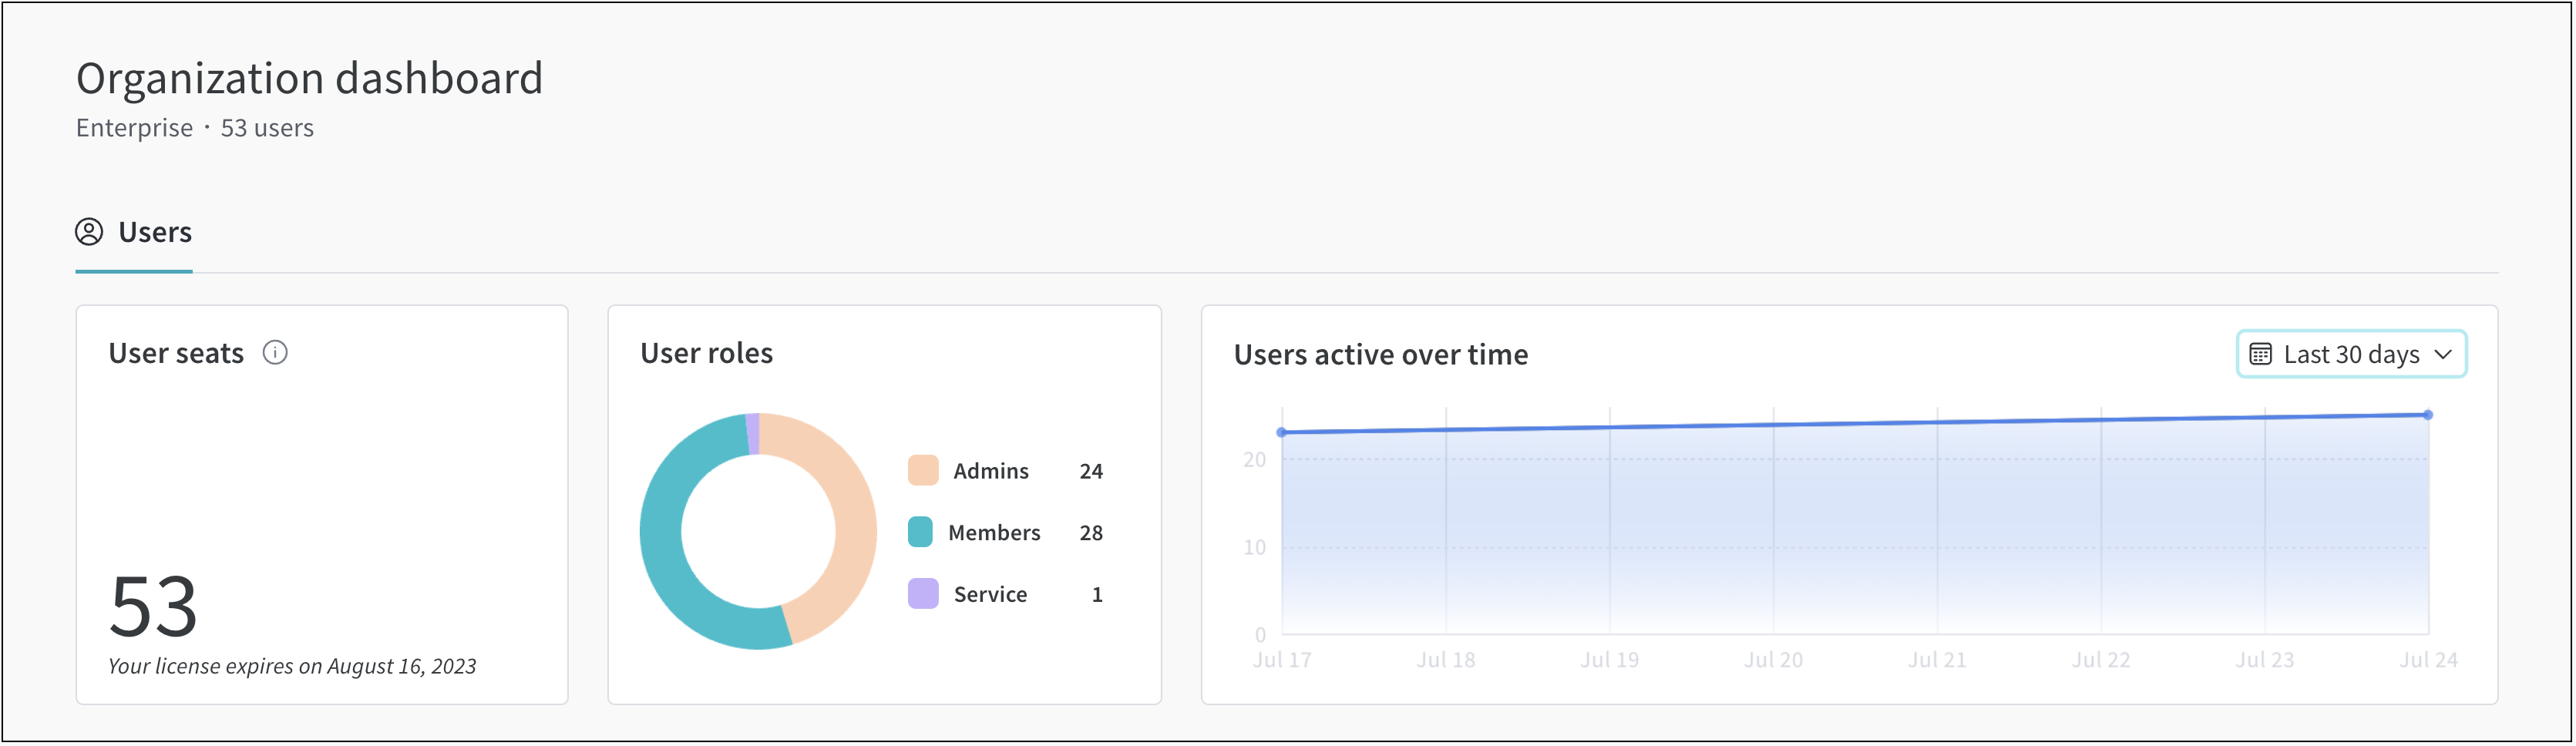
You can use the dropdown menu to filter results based on days, months, or all time.